. 2016 Oct:497:279-293.
doi: 10.1016/j.virol.2016.07.021. Epub 2016 Aug 5.

Human Cytomegalovirus nuclear egress and secondary envelopment are negatively affected in the absence of cellular p53

Affiliations

Human Cytomegalovirus nuclear egress and secondary envelopment are negatively affected in the absence of cellular p53

Man I Kuan et al. Virology. 2016 Oct.

Abstract

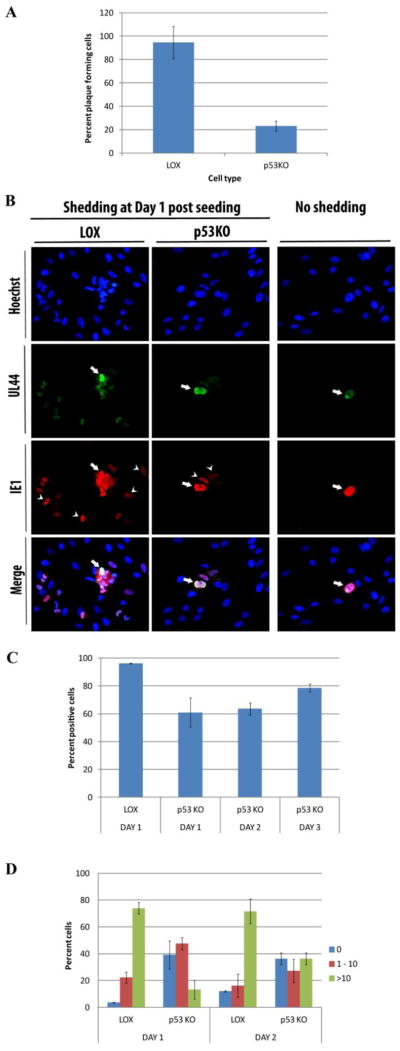
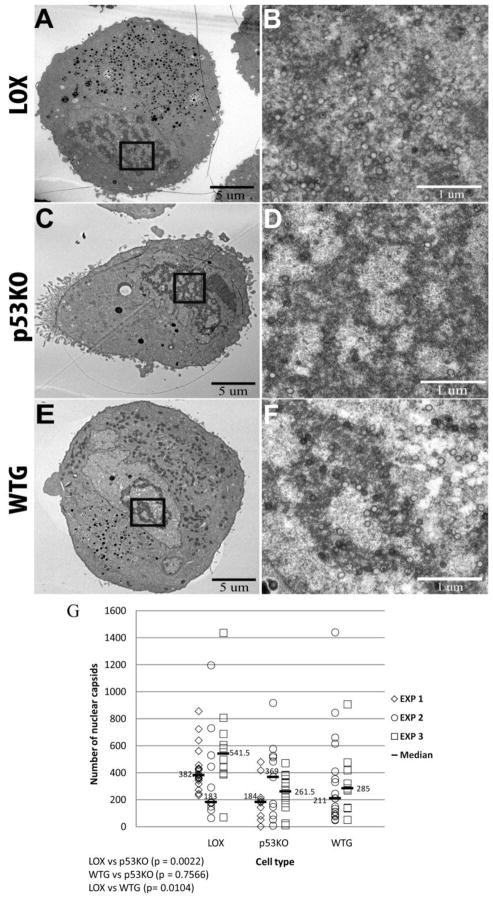
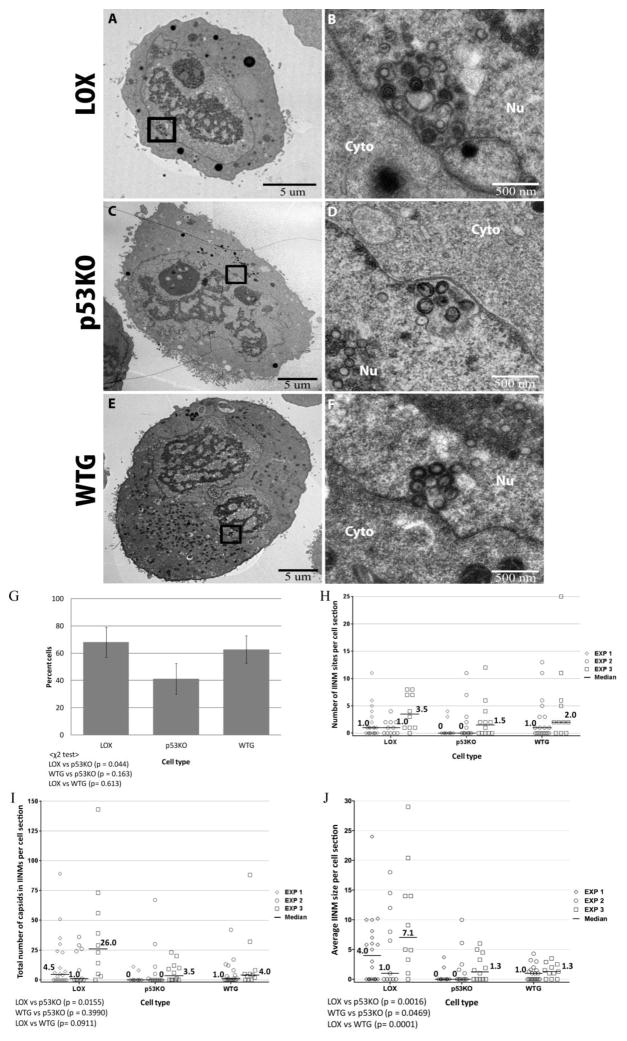
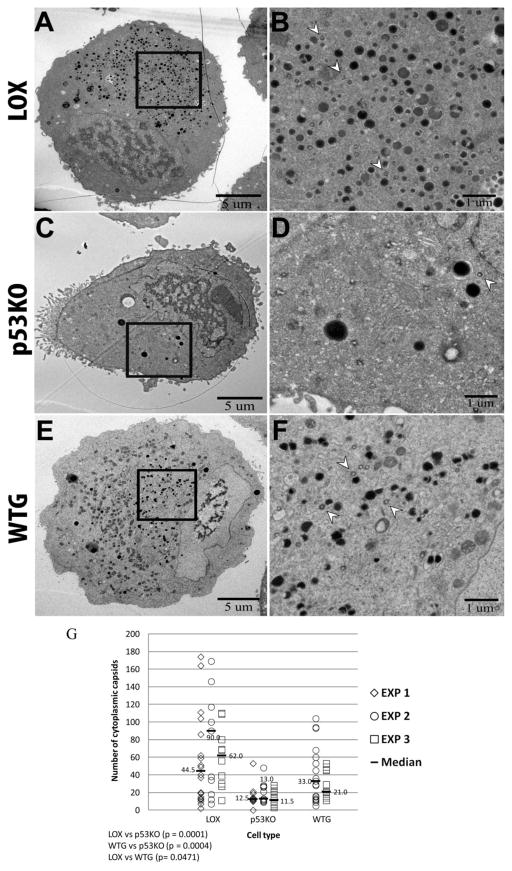
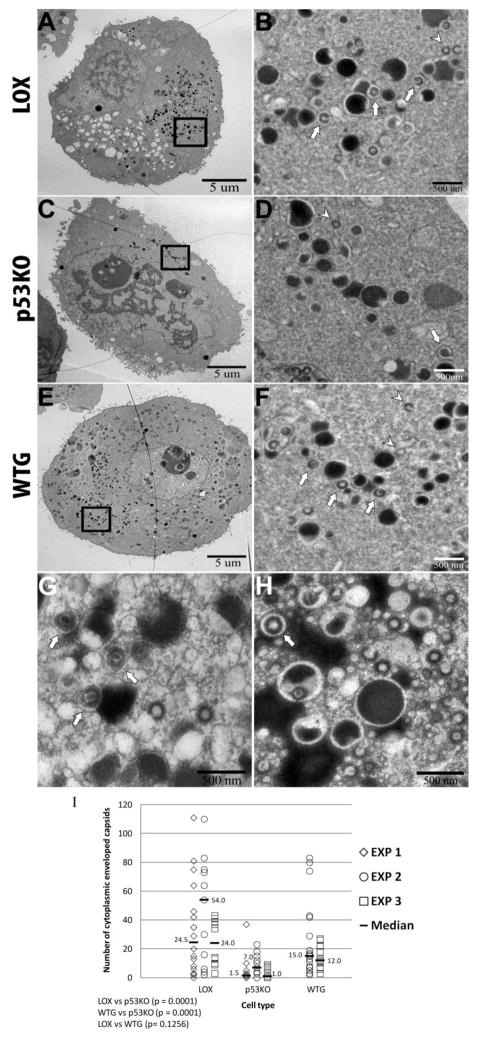
Human Cytomegalovirus (HCMV) infection is compromised in cells lacking p53, a transcription factor that mediates cellular stress responses. In this study we have investigated compromised functional virion production in cells with p53 knocked out (p53KOs). Infectious center assays found most p53KOs released functional virions. Analysis of electron micrographs revealed modestly decreased capsid production in infected p53KOs compared to wt. Substantially fewer p53KOs displayed HCMV-induced infoldings of the inner nuclear membrane (IINMs). In p53KOs, fewer capsids were found in IINMs and in the cytoplasm. The deficit in virus-induced membrane remodeling within the nucleus of p53KOs was mirrored in the cytoplasm, with a disproportionately smaller number of capsids re-enveloped. Reintroduction of p53 substantially recovered these deficits. Overall, the absence of p53 contributed to inhibition of the formation and function of IINMs and re-envelopment of the reduced number of capsids able to reach the cytoplasm.

Keywords: Capsids; Human Cytomegalovirus; Infoldings of the inner nuclear membrane (IINM); Nuclear egress; Secondary envelopment; Transmission electron microscopy (TEM); p53.


Figures

Figure 1
Figure 1
Quantitation of virion shedding cells in wt LOX cells compared to p53KO cells. Infected LOX and p53KO cells were harvested for seeding onto monolayers at 120 h pi. (A) The mean percentage of cells generating visible plaques in conventional plaque forming assays. Error bars represent one standard error calculated from five experiments. (B) Infectious center assays to more sensitively detect virion shedding. Coverslips were stained for UL44 to detect seeded cells (arrows) and IE1 to detect newly infected neighboring cells (arrow heads). (C) Mean percentage of shedding positive cells detected by immunofluorescent staining of infectious center assays. Error bars represent one standard error calculated from three technical replicates. (D) Quantitation of newly infected neighboring cells at day 1 and 2 post seeding. Mean numbers of infected neighboring cells were binned at 0, 1–10, and more than 10. Error bars represent one standard error calculated from three technical replicates.
Figure 2
Figure 2
Quantitation of capsid production in the nucleus in wt cell sections compared to p53KO cell sections. TEM micrographs of infected cell sections showed RCs with numerous HCMV capsids at 120 h pi. Cross sections of entire cell sections were captured at a magnification of 1,700X (A, C and E). Examples of nuclear capsids present in the boxed areas in A, C and E as visualized in images captured at 5,000x are shown for LOX (panel B), p53KO (panel D) and WTG (panel F). As necessary, images captured at higher magnification in this and all subsequent figures were stitched together to form a mosaic image of the individual captures from an individual cell section. Capsids were enumerated using these mosaic images. Statistical tests for differences among the EM sections of the LOX, p53KO and WTG cells (all graphs in Figures 2–5 and Supplemental Figures) were conducted using the Kruskal-Wallace test as described in Materials and Methods. If the overall tests were found statistically significant (p-values reported in the figure legends), then pairwise comparisons among the three cell lines were conducted using the same test (and reported within the figures). For all analyses, a p-value of 0.05 or less was considered statistically different. (G) Quantitation of capsids in the nucleus in wt LOX cell sections compared to p53KO and WTG cell sections. Each symbol represents an individual cell section in an experiment in this, and all following figures. Experiment 1 (EXP 1) used LOX cell sections (n=20) compared to p53KO cell sections (n=10). Experiment 2 (EXP 2) used LOX cell sections (n=11) compared to p53KO cell sections (n=11) and WTG cell sections (n=19). Experiment 3 (EXP 3) used LOX cell sections (n=10) compared to p53KO cell sections (n=12) and WTG cell sections (n=11). Median capsid counts for each cell type in a given experiment are marked with a horizontal bar in this, and all following figures. Kruskal-Wallace overall test, p=0.0025.
Figure 3
Figure 3
Identification of capsids exiting the nucleus via infoldings of the inner nuclear membrane (IINMs). (A, C and E) Whole cell sections were captured at a magnification of 1,700X. (B, D and F) Examples of nuclear capsids present within the boxed areas in 2A, C and E, as visualized in images captured at 5,000x. In Figure 3G, a χ2 test, implemented in SAS, was used to determine differences between LOX, p53KO and WTG in the proportion of cell sections with IINMs. In this analysis, an overall test was performed first, followed by pairwise analysis. (G) Percentage of cell sections containing IINMs in LOX, p53KO and WTG. Error bars represent one standard error calculated from three (LOX and p53KO) or two (WTG) experiments. χ2 overall test, p=0.0509. As this overall test was just outside statistical significance, pairwise comparisons were still reported. (H) Number of IINMs per cell section. All cell sections in each experiment are represented whether they contain IINMs or not. Kruskal-Wallace overall test, p=0.13 (not significant). (I) Total number of capsids found within IINMs per cell section for LOX, p53KO and WTG. Kruskal-Wallace overall test, p=0.016. (J) The number of capsids in IINMs was divided by the number of IINMs in that cell section to determine the mean content/size of each cell section’s IINMs. Kruskal-Wallace overall test, p<0.0001. Nu = nucleus; Cyto = cytoplasm.
Figure 4
Figure 4
Quantitation of cytoplasmic capsids. Whole cell sections were captured at a magnification of 1,700X (A, C, and E). Images captured at higher magnification (2500x) were used to quantitate cytoplasmic capsids. Arrow heads in B, D and F show examples of cytoplasmic capsids present within the boxed areas in A, C and E, as visualized in 2,500x images. (G) Quantitation of capsids in the cytoplasm in LOX, p53KO and WTG cell sections. Kruskal-Wallace overall test, p<0.0001.
Figure 5
Figure 5
Identification and quantitation of enveloped cytoplasmic capsids. (A–F) Whole cell sections were captured at a magnification of 1,700X (A, C, and E). Images captured at higher magnification (2500x) were used to quantitate enveloped and non-enveloped capsids. B, D and F show examples of enveloped (arrows) and non-enveloped (arrow heads) capsids present within the boxed areas in A, C and E, as visualized in 2,500x images. (G and H) LOX (G) and WTG (H) cell sections captured at higher magnification (6500x and 5000x, respectively), displayed secondary envelopes more distinctly (arrows). (I) Quantitation of enveloped capsids in the cytoplasm in LOX, p53KO, and WTG cell sections. Kruskal-Wallace overall test, p<0.0001.
Figure 6
Figure 6
Consumption of lipid precursors was compromised in the absence of p53. Cells stained with Sudan IV. (A) Uninfected LOX and p53KO cells were largely full of lipid droplets. (B) Lipid droplets were depleted in infected LOX cells, but not in p53KO cells. (C) Quantitation of the percentage of cells in each cell type containing lipid droplets. Error bars represent one standard error calculated from four experiments. Analysis of variance for differences among infected and uninfected LOX and p53KO cells was found to be statistically significant (p=0.034), therefore Tukey’s Studentized Range Test was used for pairwise comparisons of the transformed percentages (values reported in (C)).

Similar articles

Cited by

References

    1. Adler B, Sinzger C. Cytomegalovirus Interstrain Variance in Cell Type Tropism. In: Reddehase MJ, Lemmermann NAW, editors. Cytomegaloviruses: From Molecular Pathogenesis to Intervention. Caister Academic Press; Norfolk, UK: 2013. pp. 297–321.
    1. AuCoin DP, Smith GB, Meiering CD, Mocarski ES. Betaherpesvirus-conserved cytomegalovirus tegument protein ppUL32 (pp150) controls cytoplasmic events during virion maturation. J Virol. 2006;80:8199–8210. - PMC - PubMed
    1. Azzeh M, Honigman A, Taraboulos A, Rouvinski A, Wolf DG. Structural changes in human cytomegalovirus cytoplasmic assembly sites in the absence of UL97 kinase activity. Virology. 2006;354:69–79. - PubMed
    1. Baxter MK, Gibson W. Cytomegalovirus basic phosphoprotein (pUL32) binds to capsids in vitro through its amino one-third. J Virol. 2001;75:6865–6873. - PMC - PubMed
    1. Bigalke JM, Heuser T, Nicastro D, Heldwein EE. Membrane deformation and scission by the HSV-1 nuclear egress complex. Nat Commun. 2014;5:4131. - PMC - PubMed

Publication types

MeSH terms

Substances