. 2016 Aug 8;16(1):173.
doi: 10.1186/s12870-016-0836-y.

Vine nitrogen status and volatile thiols and their precursors from plot to transcriptome level

Affiliations

Vine nitrogen status and volatile thiols and their precursors from plot to transcriptome level

Pierre Helwi et al. BMC Plant Biol. .

Abstract

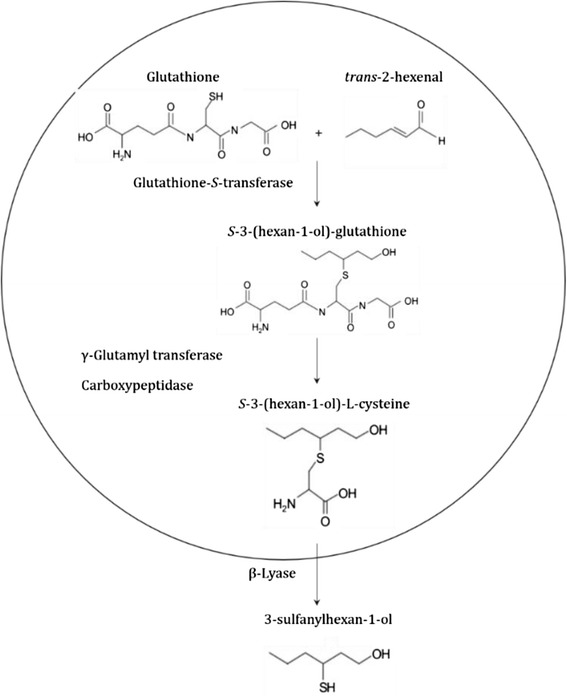
Background: Volatile thiols largely contribute to the organoleptic characteristics and typicity of Sauvignon blanc wines. Among this family of odorous compounds, 3-sulfanylhexan-1-ol (3SH) and 4-methyl-4-sulfanylpentan-2-one (4MSP) have a major impact on wine flavor. These thiols are formed during alcoholic fermentation by the yeast from odorless, non-volatile precursors found in the berries and the must. The present study investigates the effects of vine nitrogen (N) status on 3SH and 4MSP content in Sauvignon blanc wine and on the glutathionylated and cysteinylated precursors of 3SH (Glut-3SH and Cys-3SH) in the berries and the must. This is paralleled by a RNA-seq analysis of gene expression in the berries. The impact of N supply on the expression of the glutathione-S-transferase 3 and 4 (VviGST3 and VviGST4) and the γ-glutamyltranspeptidase (VviGGT), considered as key genes in their biosynthesis, was also evaluated.

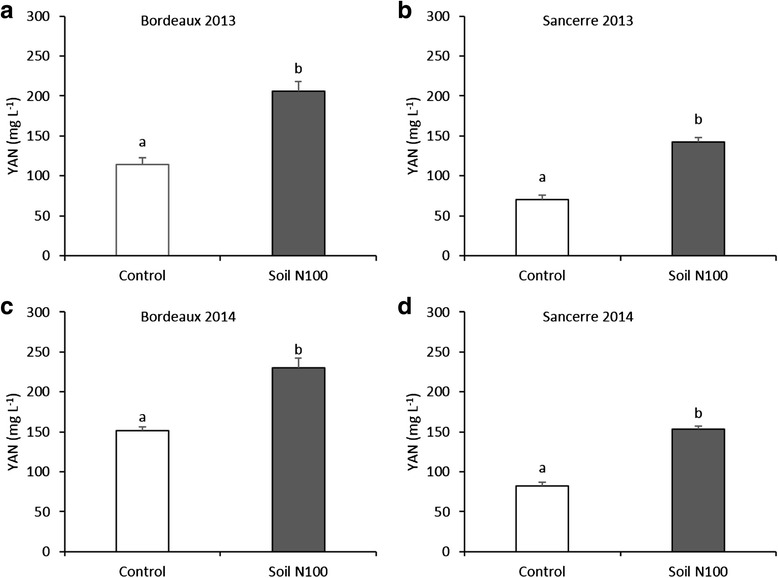
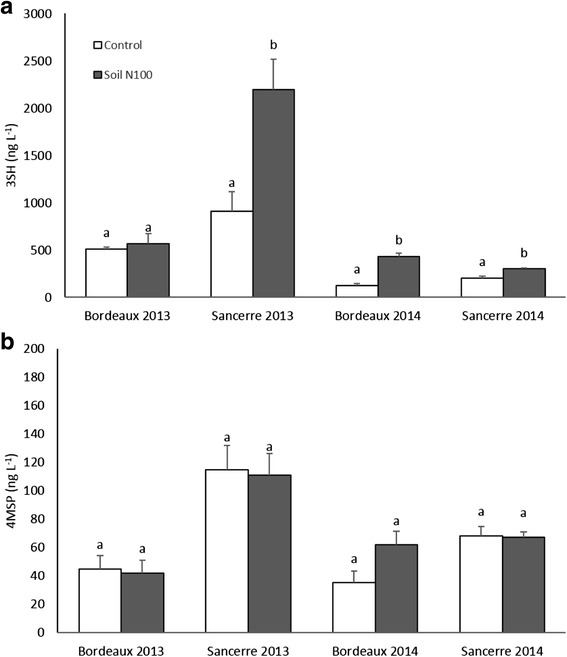
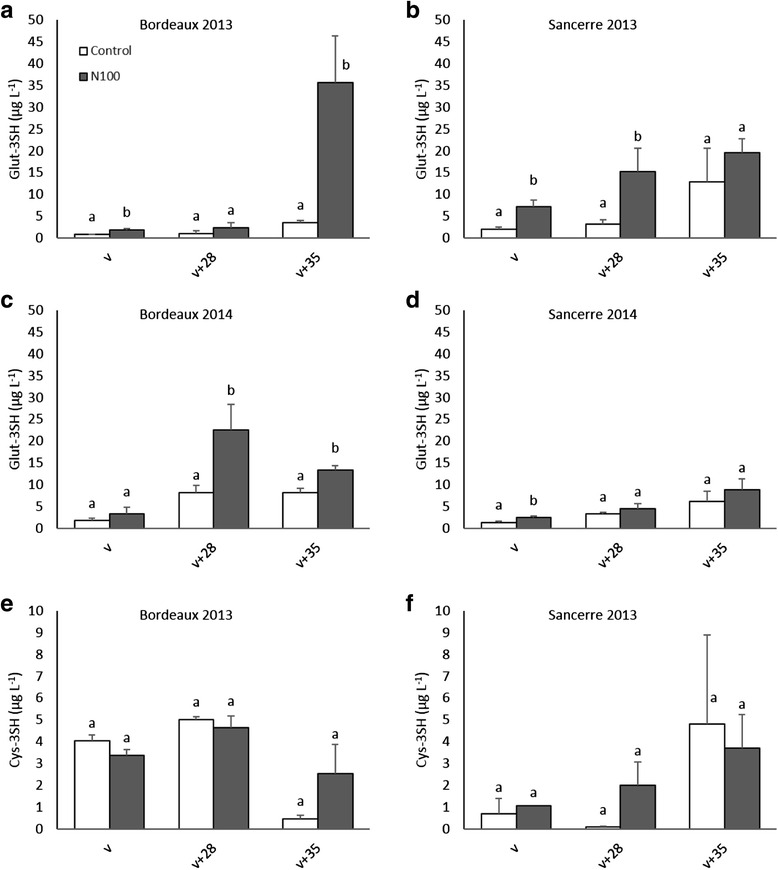
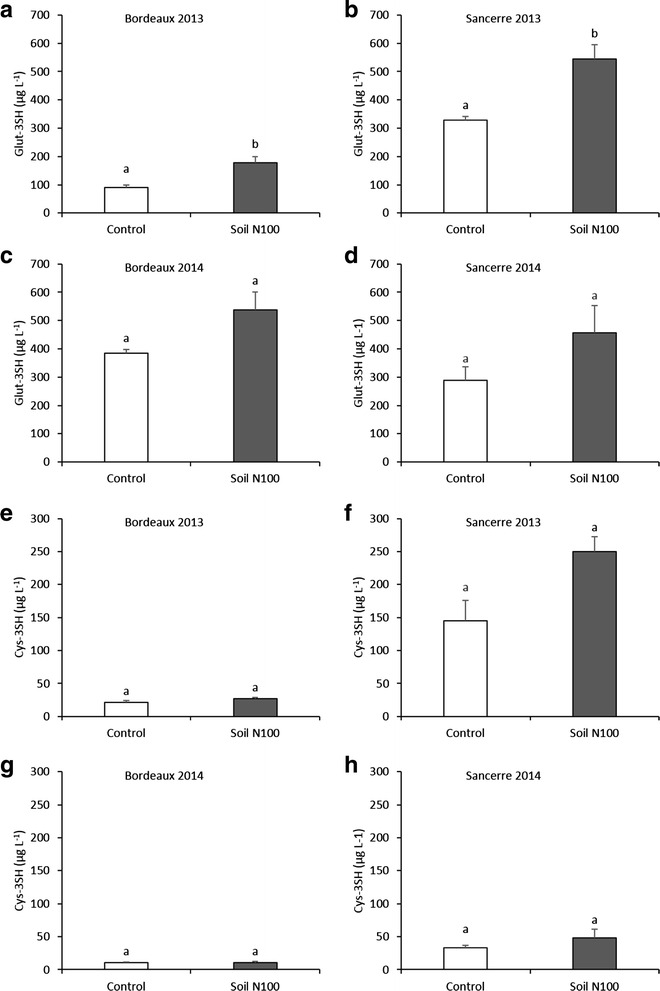
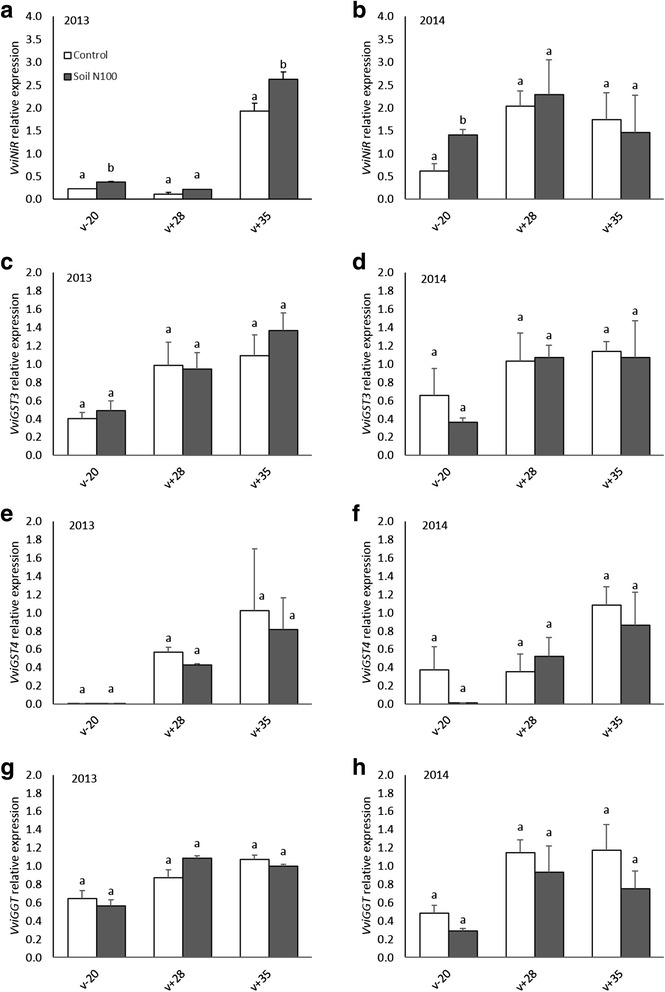
Results: N supply (N100 treatment) increased the 3SH content in wine while no effect was noticed on 4MSP level. Furthermore, N supply increased Glut-3SH levels in grape berries at late berry ripening stages, and this effect was highly significant in must at harvest. No significant effect of N addition was noticed on Cys-3SH concentration. The transcript abundance of the glutathione-S-transferases VviGST3 and VviGST4 and the γ-glutamyltranspeptidase (VviGGT), were similar between the control and the N100 treatment. New candidate genes which might be implicated in the biosynthetic pathway of 3SH precursors were identified by whole transcriptome shotgun sequencing (RNA-seq).

Conclusions: High vine N status has a positive effect on 3SH content in wine through an increase of Glut-3SH levels in grape berries and must. Candidate GSTs and glutathione-S-conjugates type transporters involved in this stimulation were identified by RNA-seq analysis.

Keywords: 3-sulfanylhexan-1-ol; 4-methyl-4-sulfanylpentan-2-one; Cysteinylated precursors; GGT; GST; Glutathionylated precursors; Nitrogen; Vitis vinifera; Volatile thiols.


Figures

Fig. 1
Fig. 1
Hypothetical pathway of the glutathionylated precursor (Glut-3SH) and cysteinylated precursor (Cys-3SH) of 3SH in grape berries as described by Kobayashi et al. and Thibon et al. [21, 22]. In the berry, illustrated as a circle, Glut-3SH derives from Glut-3SH-al, which is formed by the combination of the glutathione (GSH) with the trans-2-hexenal. In the must, the production of 3-sulfanylhexan-1-ol (3SH) occurs during the alcoholic fermentation by the yeast
Fig. 2
Fig. 2
Stem water potential (MPa) as an indicator of vine water status, measured in Bordeaux (a and c) and Sancerre (b and d) in 2013 and 2014. All data are presented as the mean of four biological replicates. Error bars indicate Standard Error (SE)
Fig. 3
Fig. 3
N-tester measurements, as an indicator of vine nitrogen status in Bordeaux (a and c) and Sancerre (b and d) vineyards in 2013 and 2014. This device measures the intensity of the leaf blade color which is in relation with chlorophyll content. All data are presented as the mean of four biological replicates. Different letters indicate significant differences. Error bars indicate Standard Error (SE). Statistical significance was determined by Student’s t test (p value ≤ 0.05)
Fig. 4
Fig. 4
Yeast Available Nitrogen (YAN) determined for each plot in 2013 and 2014 prior to commercial harvest (mg L−1). All data are presented as mean of four biological replicates. Different letters indicate significant differences. Error bars indicate Standard Error (SE). Statistical significance was determined by Student’s t test (p value ≤ 0.05). The white and grey bars represent the control and the soil N100 treatment respectively
Fig. 5
Fig. 5
Effects of nitrogen supply on the level of (a) 3SH (ng L−1) and (b) 4MSP (ng L−1) in wines made by small-scale vinifications. All data are presented as mean of four biological replicates. Different letters indicate significant differences. Error bars indicate Standard Error (SE). Statistical significance was determined by Student’s t test (p value ≤ 0.05)
Fig. 6
Fig. 6
Effects of nitrogen supply on the amount of Glut-3SH (a - d) and Cys-3SH (e and f) (μg L−1) in grape berries at (v), (v + 28) and (v + 35). All data are presented as mean of four biological replicates. Different letters indicate significant differences. Error bars indicate Standard Error (SE). Statistical significance was determined by Student’s t test (p value ≤ 0.05)
Fig. 7
Fig. 7
Effect of nitrogen supply on the level of Glut-3SH (a - d) and Cys-3SH (e - h) (μg L−1) in grape musts. All data are presented as mean of four biological replicates. Letters indicate significant differences. Error bars indicate Standard Error (SE). Statistical significance was determined by Student’s t test (p value ≤ 0.05)
Fig. 8
Fig. 8
Changes in relative transcript levels of genes of VviNiR, VviGST3, VviGST4 and VviGGT in grape berries throughout their development in the Bordeaux experimental site. Transcript levels were analyzed by real-time PCR and are shown relative to expression of VviGAPDH and VviActin in each sample. All data are presented as mean of three biological replicates and two technical replicates. Letters indicate significant differences. Error bars indicate Standard Error (SE). Statistical significance was determined by Student’s t test (p value ≤ 0.05). The white and grey bars represent the control and the soil N100 treatment respectively. (v-20), 20 days before mid-veraison; (v+28), mid-ripening; (v+35), ripeness
Fig. 9
Fig. 9
Comparison of differential gene expression between the soil N100 and the control at two developmental stages in (a) 2013 and (b) 2014. Venn diagrams indicate overlap of all differentially expressed genes obtained from each comparison between the soil N100 treatment and the control at mid-ripening (v + 28) and ripeness (v + 35). The numbers of up-regulated genes and down-regulated genes are given in red and in green, respectively. C, control

References

    1. Ferreira V. Managing wine quality. 2010. Volatile aroma compounds and wine sensory attributes; pp. 3–28.
    1. Coetzee C, Brand J, Emerton G, Jacobson D, Silva Ferreira AC, du Toit WJ. Sensory interaction between 3-mercaptohexan-1-ol, 3-isobutyl-2-methoxypyrazine and oxidation-related compounds. Aust J Grape Wine Res. 2015;21:179–188. doi: 10.1111/ajgw.12133. - DOI
    1. Ribéreau-Gayon P, Glories Y, Maujean A, Dubourdieu D. Handbook of enology: the chemistry of wine stabilization and treatments. 2. 2006. Varietal aroma; pp. 205–230.
    1. Peyrot des Gachons C, van Leeuwen C, Tominaga T, Soyer JP, Gaudillère JP, Dubourdieu D. Influence of water and nitrogen deficit on fruit ripening and aroma potential of Vitis vinifera L. cv. Sauvignon blanc in field conditions. J Sci Food Agric. 2005;85:73–85. doi: 10.1002/jsfa.1919. - DOI
    1. Bayonove C, Cordonnier R, Dubois P. Study of an aromatic characteristic fraction of cabernet-sauvignon grape variety, identification of 2-methoxy-3-isobutyl-pyrazine. Comptes rendus Hebd des séances l’académie des Sci série D. 1975;281:75–78.