. 2016 Oct 10;26(19):2659-2666.
doi: 10.1016/j.cub.2016.07.057. Epub 2016 Aug 4.

The Demographic Development of the First Farmers in Anatolia

Affiliations

The Demographic Development of the First Farmers in Anatolia

Gülşah Merve Kılınç et al. Curr Biol. .

Abstract

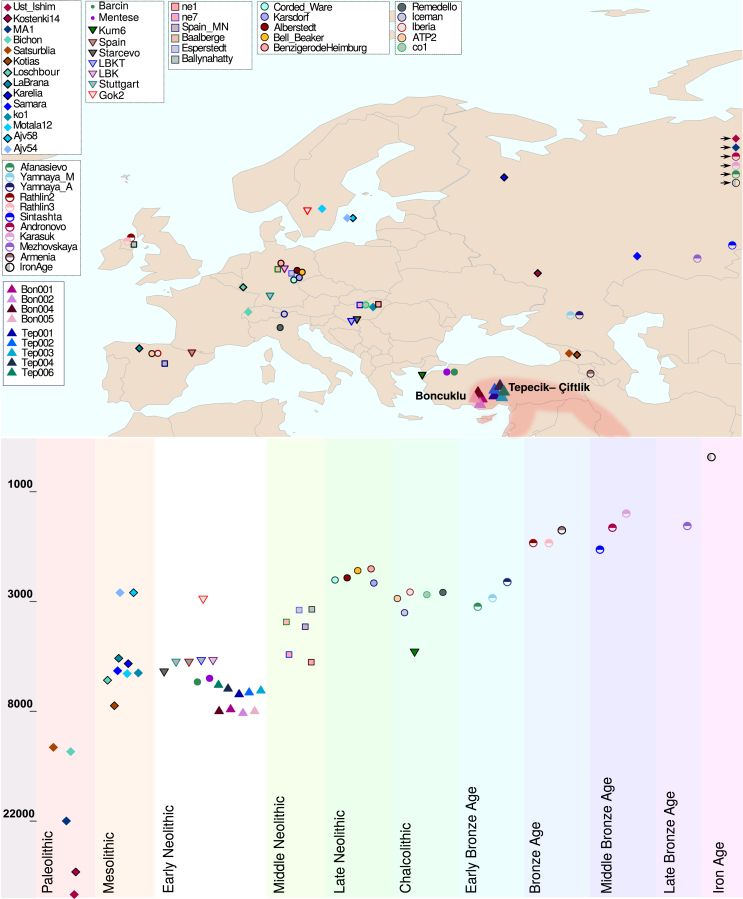
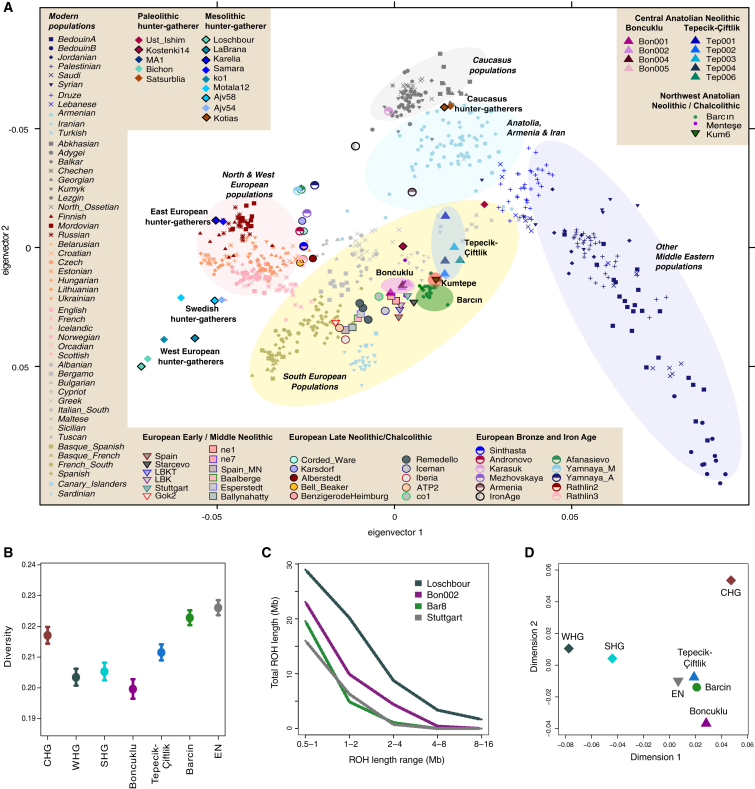
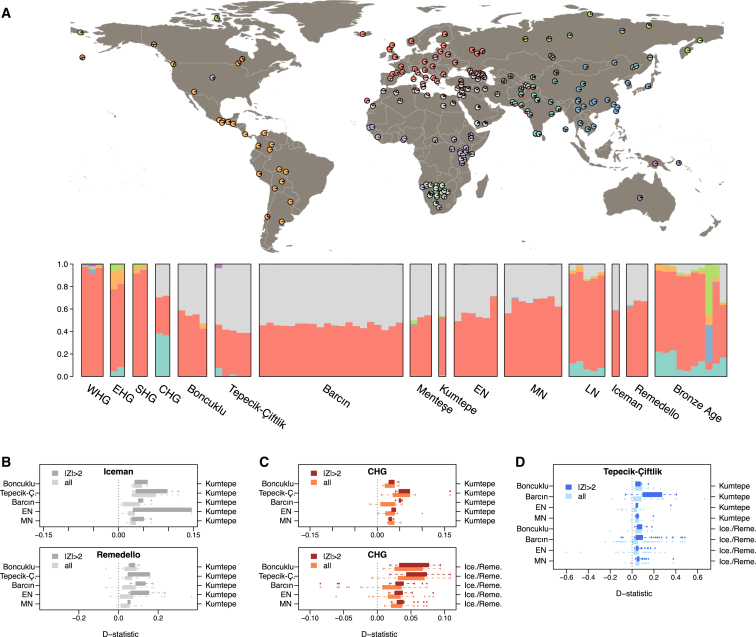
The archaeological documentation of the development of sedentary farming societies in Anatolia is not yet mirrored by a genetic understanding of the human populations involved, in contrast to the spread of farming in Europe [1-3]. Sedentary farming communities emerged in parts of the Fertile Crescent during the tenth millennium and early ninth millennium calibrated (cal) BC and had appeared in central Anatolia by 8300 cal BC [4]. Farming spread into west Anatolia by the early seventh millennium cal BC and quasi-synchronously into Europe, although the timing and process of this movement remain unclear. Using genome sequence data that we generated from nine central Anatolian Neolithic individuals, we studied the transition period from early Aceramic (Pre-Pottery) to the later Pottery Neolithic, when farming expanded west of the Fertile Crescent. We find that genetic diversity in the earliest farmers was conspicuously low, on a par with European foraging groups. With the advent of the Pottery Neolithic, genetic variation within societies reached levels later found in early European farmers. Our results confirm that the earliest Neolithic central Anatolians belonged to the same gene pool as the first Neolithic migrants spreading into Europe. Further, genetic affinities between later Anatolian farmers and fourth to third millennium BC Chalcolithic south Europeans suggest an additional wave of Anatolian migrants, after the initial Neolithic spread but before the Yamnaya-related migrations. We propose that the earliest farming societies demographically resembled foragers and that only after regional gene flow and rising heterogeneity did the farming population expansions into Europe occur.

Keywords: Anatolia; Neolithic; ancient DNA; archaeogenomics; genetic diversity; population genetics.


Figures

Figure 1
Figure 1
Geographical Location and Timeline of Ancient Individuals Included in This Study Map showing the geographical distribution and timeline showing the approximate log-scaled time period (BC) of the ancient individuals used in this study. The colors and symbols for each individual are same with the principal component analysis (PCA). The regions where the Neolithic first emerged and was established are shaded. See Figure S1 for deamination patterns, sequencing efficiency using different methods for the individuals sequenced in this study, and an mtDNA haplogroup network. See also Data S1.
Figure 2
Figure 2
Genetic Structure and Diversity of Central Anatolian Neolithic Populations (A) PCA on contemporary west Eurasian populations onto which a total of 85 ancient individuals are projected from this study and previous studies. See Table S1 for number of SNPs per individual. Neighboring modern populations and ancient Anatolian populations are shown encircled. Modern population names are in italics. (B) Conditional nucleotide diversity calculated as the average pairwise mismatches between individuals. Diversities for each group were calculated using the SNPs identified in Yoruba individuals. We used two individuals per group, which yields the highest number of SNPs. Western European, eastern European, Swedish, and Caucasus hunter-gatherers are represented as WHG, EHG, SHG, and CHG, respectively. The European early Neolithic population is denoted with EN. Note that the diversities calculated for CHG and WHG are overestimates, as the individuals representing CHG are separated by three millennia and those representing WHG are separated by >1,000 km (Supplemental Experimental Procedures; Table S1). The error bars represent ±2 SEMs. (C) Distribution of runs of homozygosity (ROH) for Loschbour (European Mesolithic), Bon002 (Anatolian Aceramic), Bar8 (Anatolian Pottery Neolithic), and Stuttgart (early European Neolithic). (D) Multidimensional scaling analysis based on the Weir and Cockerham’s Fst calculated between populations using transversions overlapping with African Yoruba individuals. See Data S3 for f3 statistics, D statistics, pairwise mismatch estimates, and Fst estimates; Figure S2 for outgroup f3 statistics with present-day populations; and Figure S3 for D statistics, mean pairwise f3 statistics, and MDS analysis based on pairwise f3 statistics.
Figure 3
Figure 3
Admixture Analysis and Genetic Affinities among Neolithic/Chalcolithic Populations (A) ADMIXTURE ancestry components (K = 10) for present-day world populations and for ancient individuals. Admixture fractions are shown on map for modern-day individuals and as bar charts for ancient individuals. See Figure S4 for K = 2 to K = 20 plots with all individuals. Western European, eastern European, Swedish, and Caucasus hunter-gatherers are represented as WHG, EHG, SHG, and CHG, respectively. European early, middle, and late Neolithic populations are denoted with EN, MN, and LN, respectively. (B–D) Distributions of D statistics calculated as (B) D(Denisova,Iceman;X,Kumtepe) and D(Denisova,Remedello;X,Kumtepe), (C) D(Denisova,CHG;X,Kumtepe) and D(Denisova,CHG;X,Iceman/Remedello), and (D) D(Denisova,Tepecik;X,Kumtepe) and D(Denisova,Tepecik;X,Iceman/Remedello), where X stands for an ancient Anatolian or European early Neolithic (EN) or middle Neolithic (MN) individual, indicated on the left-hand y axis. (See Figure S3 for a plot of D statistics of comparisons of CO1, EHG, and WHG.) In brief, D < 0 indicates higher genetic affinity between the test population (name indicated on the top) and X, and D > 0 indicates higher genetic affinity between the test population and the second population (name indicated on the right-hand y axis). In each comparison, lighter-color boxplots show all D statistics calculated using all available individuals in the populations compared, and darker-color boxplots show only nominally significant D statistics with |Z| ≥ 2. The numbers in the middle indicate the percentage of comparisons where the test population resembles the population indicated on the right-hand y axis (i.e., D > 0). See Data S3 for D statistics.

References

    1. Bramanti B., Thomas M.G., Haak W., Unterlaender M., Jores P., Tambets K., Antanaitis-Jacobs I., Haidle M.N., Jankauskas R., Kind C.-J. Genetic discontinuity between local hunter-gatherers and central Europe’s first farmers. Science. 2009;326:137–140. - PubMed
    1. Skoglund P., Malmström H., Raghavan M., Storå J., Hall P., Willerslev E., Gilbert M.T.P., Götherström A., Jakobsson M. Origins and genetic legacy of Neolithic farmers and hunter-gatherers in Europe. Science. 2012;336:466–469. - PubMed
    1. Lazaridis I., Patterson N., Mittnik A., Renaud G., Mallick S., Kirsanow K., Sudmant P.H., Schraiber J.G., Castellano S., Lipson M. Ancient human genomes suggest three ancestral populations for present-day Europeans. Nature. 2014;513:409–413. - PMC - PubMed
    1. Baird D. The Late Epipaleolithic, Neolithic, and Chalcolithic of the Anatolian Plateau, 13,000–4000 BC. In: Potts D., editor. A Companion to the Archaeology of the Ancient Near East. Wiley-Blackwell; 2012. pp. 431–466.
    1. Skoglund P., Malmström H., Omrak A., Raghavan M., Valdiosera C., Günther T., Hall P., Tambets K., Parik J., Sjögren K.-G. Genomic diversity and admixture differs for Stone-Age Scandinavian foragers and farmers. Science. 2014;344:747–750. - PubMed

Publication types

LinkOut - more resources