. 2016 Aug 16;16(7):1903-14.
doi: 10.1016/j.celrep.2016.07.029. Epub 2016 Aug 4.

Increased 4E-BP1 Expression Protects against Diet-Induced Obesity and Insulin Resistance in Male Mice

Affiliations

Increased 4E-BP1 Expression Protects against Diet-Induced Obesity and Insulin Resistance in Male Mice

Shih-Yin Tsai et al. Cell Rep. .

Abstract

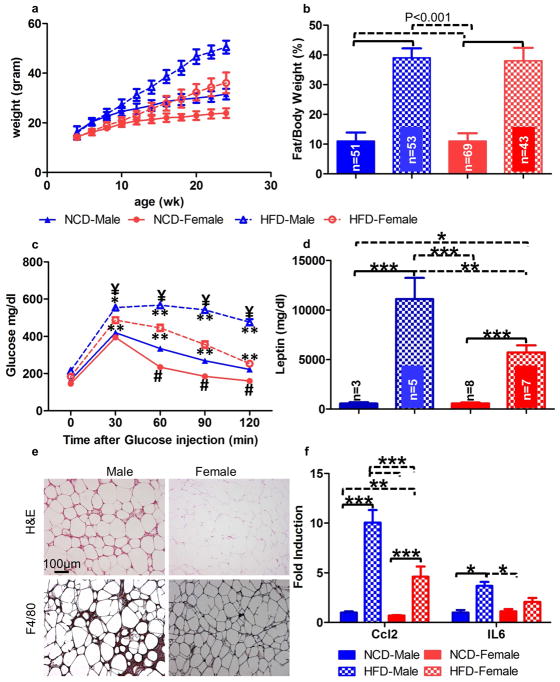
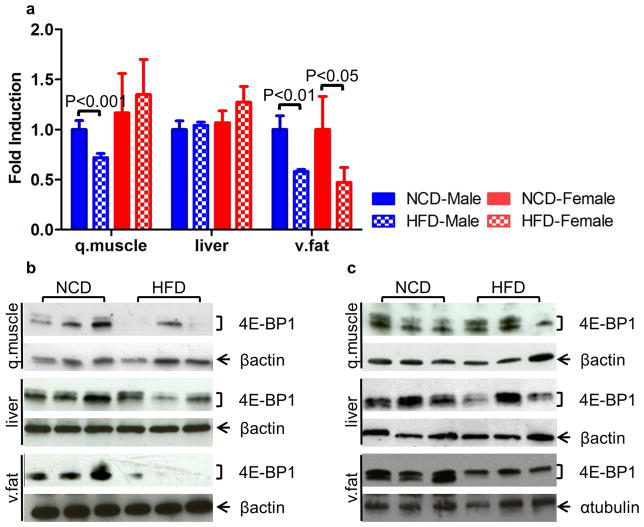
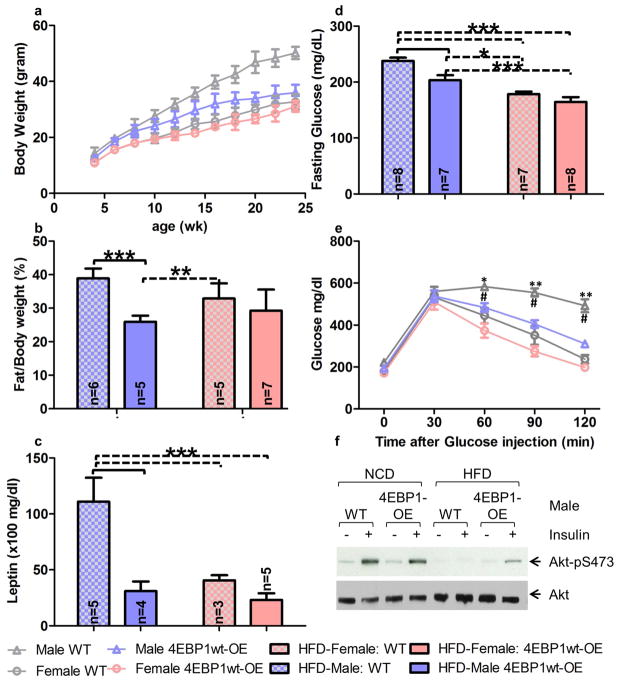
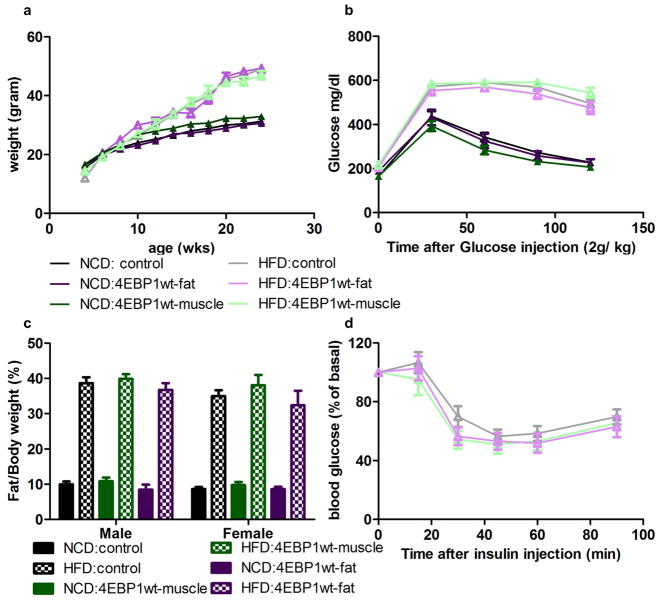
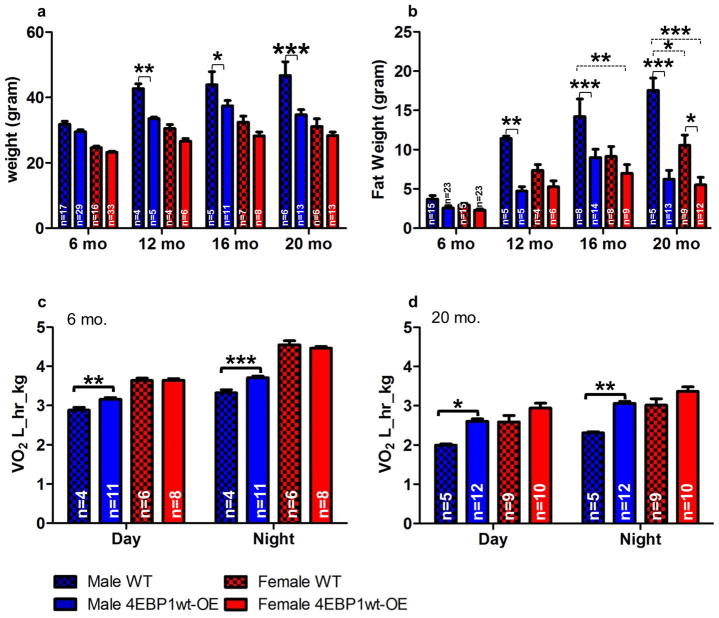
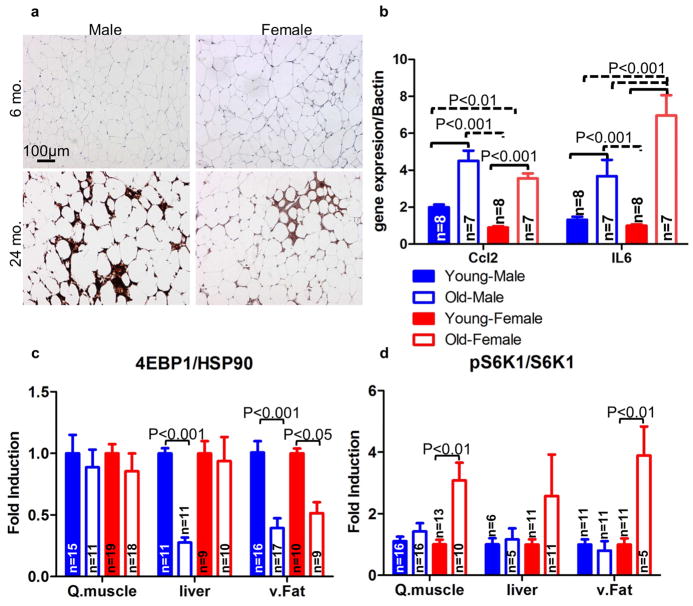
Obesity is a major risk factor driving the global type II diabetes pandemic. However, the molecular factors linking obesity to disease remain to be elucidated. Gender differences are apparent in humans and are also observed in murine models. Here, we link these differences to expression of eukaryotic translation initiation factor 4E binding protein 1 (4E-BP1), which, upon HFD feeding, becomes significantly reduced in the skeletal muscle and adipose tissue of male but not female mice. Strikingly, restoring 4E-BP1 expression in male mice protects them against HFD-induced obesity and insulin resistance. Male 4E-BP1 transgenic mice also exhibit reduced white adipose tissue accumulation accompanied by decreased circulating levels of leptin and triglycerides. Importantly, transgenic 4E-BP1 male mice are also protected from aging-induced obesity and metabolic decline on a normal diet. These results demonstrate that 4E-BP1 is a gender-specific suppressor of obesity that regulates insulin sensitivity and energy metabolism.


Figures

Figure 1
Figure 1. Gender dimorphism in diet-induced insulin resistance and glucose intolerance in C57BL/6J mouse strain
A. Body weight measurement in wild-type C57BL/6J male and female mice on a normal chow and HFD (n=20–53). P<0.001[NCD vs HFD: Male started at 10 wk. and Female started at wk.12]. P<0.001[male vs female: NCD started at wk.4]. P<0.001[male vs female: HFD started at wk.6]. B. Fat mass measurement normalized with body weight in 6-month-old wild-type C57BL/6J male and female mice on a normal chow and HFD. C. Glucose tolerance assay in 6-hr-fasting wild-type C57BL/6J male and female mice on a normal chow and HFD (n=36–44). *P<0.05;**P<0.001[NCD vs HFD: same gender]. #P<0.001[male vs female: NCD]. ¥P<0.001[male vs female: HFD]. D. Plasma leptin measurement in 6-month-old wild-type C57BL/6J male and female mice on a normal chow and HFD. P value of the cross comparison from the other groups was labeled *P<0.05;**P<0.01; ***P<0.001. E. Hematoxylin & Eosin (top) and F4/80 IHC (bottom) staining of the visceral fat from 6-month-old HFD-fed wildtype male and female mice (n= 4~7 for each group). F. Real-time PCR analysis of proinflammatory gene expression in visceral fat from 6-month-old normal-diet-fed or HFD-fed male or female mice (n=4). Fold induction was normalized to female normal-diet-fed samples. P value of the cross comparison from the other groups was labeled *P<0.05;**P<0.01; ***P<0.001. All graphs are plotted as means ± SEM of n, number of mice used in each analysis. Number of samples analyzed indicated in figure. P values were calculated by a two-way ANOVA [(B), (D), and (F)], and a two-way ANOVA for repeated measures [(A) and (C)] with Bonferroni post-tests to compare replicate means by row.
Figure 2
Figure 2. Differential 4E-BP1 expression in 6-month-old C57BL/6J mouse strain on a HFD
A. Real-time PCR analysis of 4E-BP1 mRNA expression in quadriceps muscle, liver and visceral fat from normal-diet-fed and HFD-fed male and female mice (n=4). Fold induction was normalized to male normal-diet-fed samples. Results are presented as means ± SEM. P values were calculated by a two-way ANOVA with Bonferroni post-tests to compare replicate means by row. B. Western blot of 4E-BP1 protein expression in quadriceps muscle, liver and visceral fat from normal-diet-fed or HFD-fed male mice. C. Western blot of 4E-BP1 protein expression in quadriceps muscle, liver and visceral fat from normal-diet-fed or HFD-fed female mice.
Figure 3
Figure 3. Male 4EBP1-OE transgenic mice protect from diet induced obesity and maintain insulin sensitivity
A. Body weight measurement in 4EBP1-OE transgenic and wild-type mice on a HFD (n=7–9). P<0.001[WT vs 4EBP1-OE: Male started at wk.10]. P<0.001[male vs female: WT started at wk. 8]. P<0.001[male vs female: 4EBP1-OE started at 8 wk.]. [male 4EBP1-OE vs female WT, P<0.01 at wk.8–14, P<0.001 at wk.16–18 and P<0.05 at wk.20]. P<0.001[male WT vs female 4EBP1-OE started at wk. 6]. B. Adiposity measurement in 6-month-old 4EBP1-OE transgenic and wild-type mice on a HFD. C. Plasma leptin measurement in 4EBP1-OE transgenic and wild-type mice on a HFD at 6 month-old of age. D. Plasma glucose measurement in 6-hr-fasting 4EBP1-OE transgenic and wild-type mice on a HFD at 6 month-old of age. E. Glucose tolerance assay in 6-hr-fasting 4EBP1-OE transgenic and wild-type mice on a HFD at 6 month-old of age (n=9). *P<0.05; **P<0.001 [WT vs 4EBP1wt-OE: male]. #P<0.001 [male vs female: WT]. F. Western blot of phosphorylation of AKT1 at Ser 473 and total AKT1 protein expression in visceral fat of 4EBP1-OE transgenic and wild-type male mice before (−) or after (+) insulin stimulation on a normal chow or HFD at 6 month-old of age. All graphs are plotted as means ± SEM of n, number of mice used in each analysis. Number of samples analyzed indicated in figure. P values were calculated by a two-way ANOVA [(B), (C), and (D)] and a two-way ANOVA for repeated measures [(A) and (E)] with Bonferroni post-tests to compare replicate means by row. For simplicity, Figure (B), (C), and (D), P value of the cross comparison from the other groups was labeled *P<0.05;**P<0.01; ***P<0.001.
Figure 4
Figure 4. Assessment of metabolic parameter in 4E-BP1 double transgenic male mice
A. Body weight measurement in Tg-4EBP1wt-fat and Tg-4EBp1wt-muscle male mice on a normal chow and HFD (n=8–16). P<0.001[NCD vs HFD: Male started at 10 wk.] B. Glucose tolerance assay in 6-hr-fasting Tg-4EBP1wt-fat and Tg-4EBp1wt-muscle male mice on a normal chow and HFD at 6 month-old of age (n=8–16). P<0.001[NCD vs HFD in all genetic group comparison: Male started at 30 min. time point] C. Fat mass measurement normalized with body weight in Tg-4EBP1wt-fat and Tg-4EBp1wt-muscle mice on a normal chow and HFD at 6 month-old of age (n=8–16). P<0.001[NCD vs HFD in all genetic and gender group comparison] D. Insulin challenge assay in 6-hr-fasting Tg-4EBP1wt-fat and Tg-4EBp1wt-muscle male mice on a HFD at 6 month-old of age (n=8–16). All graphs are plotted as means ± SEM of n, number of mice used in each analysis. Number of samples analyzed indicated in figure. P values were calculated by a two-way ANOVA [(C)] and a two-way ANOVA for repeated measures [(B) and (D)] with Bonferroni post-tests to compare replicate means by row.
Figure 5
Figure 5. Metabolic parameters of aging 4EBP1-OE transgenic and wild-type mice under a normal chow
a. Body weight measurement in 4EBP1-OE transgenic and wild-type mice on a normal chow. P<0.001[male vs female: WT]. P<0.001[male vs female: 4EBP1-OE]. [male 4EBP1-OE vs female WT, P<0.01 at 6 mo.]. P<0.001 [male WT vs female 4EBP1-OE]. b. Fat weight measurement in 4EBP1-OE transgenic and wild-type mice on a normal chow during aging. c. Oxygen consumption in 4EBP1-OE transgenic and wild-type mice on a normal chow at 6 month of age. P<0.001[male vs female: WT], P<0.001 [male WT vs female 4EBP1-OE], P<0.001[male 4EBP1-OE vs female], P<0.001 [male WT vs female 4EBP1-OE]. d. Oxygen consumption in 4EBP1-OE transgenic and wild-type mice on a normal chow at 20 month of age. P<0.01[male vs female: WT], P<0.001 [male WT vs female 4EBP1-OE]. All graphs are plotted as means ± SEM of n, number of mice used in each analysis. Number of samples analyzed indicated in figure. P values were calculated by a two-way ANOVA with Bonferroni post-tests to compare replicate means by row. *P<0.05;**P<0.01; ***P<0.001
Figure 6
Figure 6. Gender dimorphism in expression of 4E-BP1 and activity of S6K1 in aging C57BL/6J mouse strain
A. Macrophage infiltration in the visceral fat stained by F4/80 IHC from 6-month-old or 24-month-old wild-type male and female mice. (n=4 for 6-month old cohort and n=7 for 24-month old cohort). B. Real-time PCR analysis of proinflammatory gene expression in visceral fat from 6-month-old or 24-month-old wild-type male or female mice (n=8 for 6-month old cohort and n=7 for 24-month old cohort). Fold induction was normalized to 6-month-old female samples. C. Quantification of western blot of 4E-BP1expression normalized with housekeeping gene, HSP90, relative to 6-month-old samples. D. Quantification of western blot of phosphorylated S6K1 at Thr 389 normalized with total S6K1 expression, relative to 6-month-old samples. Young mouse cohort are from 6-month-of-old mice and old mouse cohort are from 24-month-old mice. All graphs are plotted as means ± SEM of n, number of mice used in each analysis. P values were calculated by a two-way ANOVA with Bonferroni post-tests to compare replicate means by row.

References

    1. Baar EL, Carbajal KA, Ong IM, Lamming DW. Sex- and tissue-specific changes in mTOR signaling with age in C57BL/6J mice. Aging Cell. 2016;15:155–166. - PMC - PubMed
    1. Bloor ID, Symonds ME. Sexual dimorphism in white and brown adipose tissue with obesity and inflammation. Horm Behav. 2014;66:95–103. - PubMed
    1. Bluher M, Kahn BB, Kahn CR. Extended longevity in mice lacking the insulin receptor in adipose tissue. Science. 2003;299:572–574. - PubMed
    1. Brown LM, Gent L, Davis K, Clegg DJ. Metabolic impact of sex hormones on obesity. Brain Res. 2010;1350:77–85. - PMC - PubMed
    1. Carnethon MR, De Chavez PJ, Biggs ML, Lewis CE, Pankow JS, Bertoni AG, Golden SH, Liu K, Mukamal KJ, Campbell-Jenkins B, et al. Association of weight status with mortality in adults with incident diabetes. JAMA. 2012;308:581–590. - PMC - PubMed

MeSH terms