. 2016 Oct;38(4):1039-46.
doi: 10.3892/ijmm.2016.2697. Epub 2016 Aug 3.

Mitochondrial DNA depletion causes decreased ROS production and resistance to apoptosis

Affiliations

Mitochondrial DNA depletion causes decreased ROS production and resistance to apoptosis

Hulin Chen et al. Int J Mol Med. 2016 Oct.

Abstract

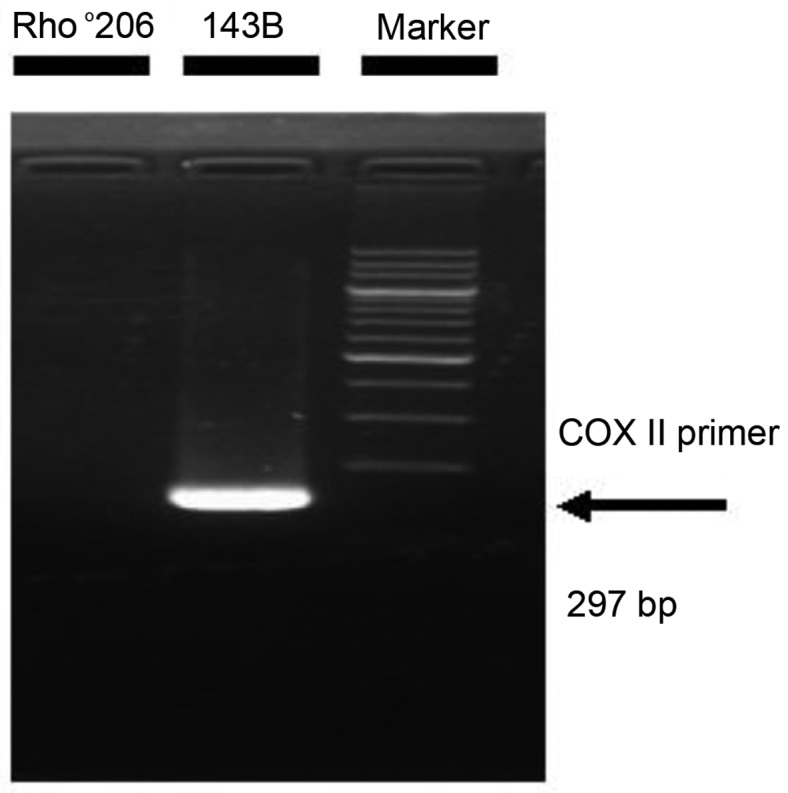
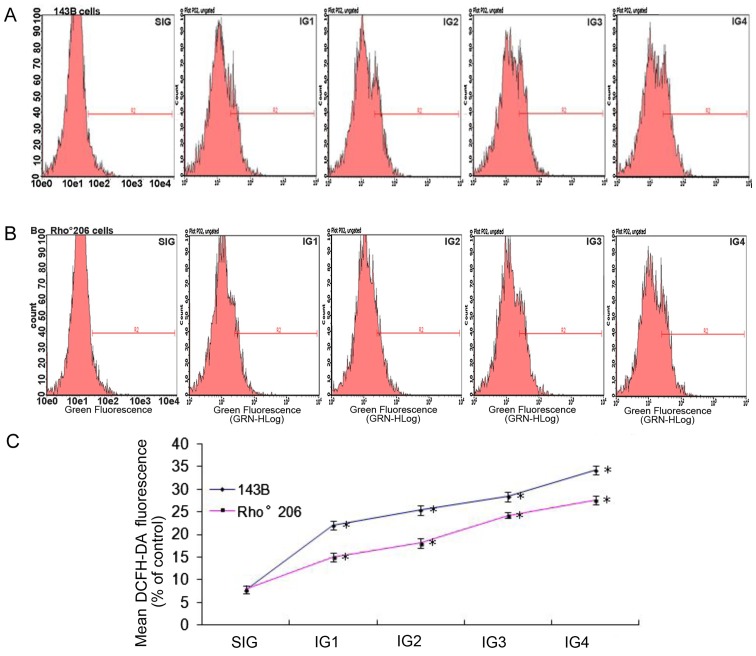
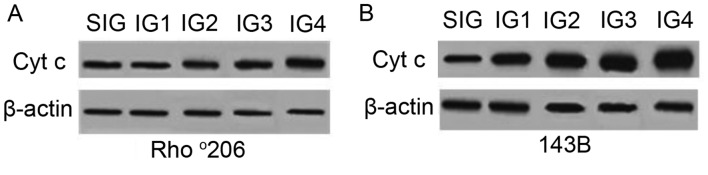
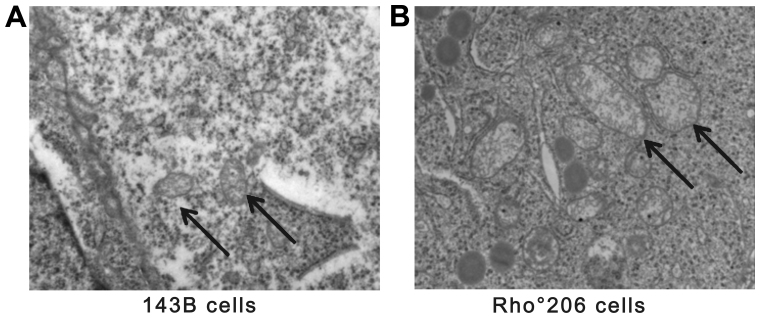
Mitochondrial DNA (mtDNA) depletion occurs frequently in many diseases including cancer. The present study was designed in order to examine the hypothesis that mtDNA‑depleted cells are resistant to apoptosis and to explore the possible mechanisms responsible for this effect. Parental human osteosarcoma 143B cells and mtDNA‑deficient (Rho˚ or ρ˚) 206 cells (derived from 143B cells) were exposed to different doses of solar-simulated ultraviolet (UV) radiation. The effects of solar irradiation on cell morphology were observed under both light and fluorescence microscopes. Furthermore, apoptosis, mitochondrial membrane potential (MMP) disruption and reactive oxygen species (ROS) production were detected and measured by flow cytometry. In both cell lines, apoptosis and ROS production were clearly increased, whereas MMP was slightly decreased. However, apoptosis and ROS production were reduced in the Rho˚206 cells compared with the 143B cells. We also performed western blot analysis and demonstrated the increased release of cytosolic Cyt c from mitochondria in the 143B cells compared with that in the Rho˚206 cells. Thus, we concluded that Rho˚206 cells exhibit more resistance to solar‑simulated UV radiation‑induced apoptosis at certain doses than 143B cells and this is possibly due to decreased ROS production.


Figures

Figure 1
Figure 1
Verification of mitochondrial DNA (mtDNA)-depletion in Rho°206 cells. The mtDNA-encoded gene COX II was amplified by PCR. A 297 bp band containing the COX II sequence was detected in the DNA isolated from 143B cells whereas it was lost in the DNA isolated from Rho°206 cells.
Figure 2
Figure 2
Ultraviolet (UV) irradiation induces various degrees of cell death in 143B and Rho°206 cells. (A) Effect of solar-simulated UV irradiation on the morphology of 143B cells observed under a fluorescence microscope (×40 magnification). (B) Morphological changes showed in Rho°206 cells following treatment with solar-simulated UV irradiation under a fluorescence microscope (×40). (C) MTT analysis of 143B and Rho°206 cells following solar-simulated UV irradiation. *P<0.05 vs. SIG control. Each bar represents the means ± SD from three experiments. Annexin V-PE and 7-AAD staining for apoptosis in (D) 143B and (E) Rho°206 cells following simulated solar irradiation. x-axis, Annexin V-PE; y-axis, DNA content by 7-AAD. The experiment was repeated three times and the image presented is typical of these three independent tests.
Figure 3
Figure 3
Effects of combined treatment with ultraviolet radiation (UVA and UVB) on the mitochondrial membrane potential (MMP). (A) Rho°206 and (B) 143B cells were seeded at a concentration of 1×10⁶ cells/ml, and then exposed different doses of UV irradiation (Table I). After three washes, the cells were incubated at 37°C for 30 min with 10 µM rhodamine 123 (Rh123) in PBS. The fluorescence was measured using flow cytometry (excitation wavelengths were both 488 nm, and emission wavelengths were both 525 nm). The test was repeated three times and the image presented is representative of these three independent tests. Each bar represents the means ± SD from three experiments. (A and B) There were signficant changes in MMP in both cell lines at different doses of UV radiation. (C) A comparison between 143B and Rho°206 cell lines shows that there was no significant difference in MMP between the SIG groups (P>0.05). However, there were significant differences between the cell lines at the same irradiation doses.
Figure 4
Figure 4
Exposure to ultraviolet (UV) radiation increases the production of reactive oxygen species (ROS). (A) 143B and (B) Rho°206 cells were seeded at a density of 1×10⁶ cells/ml, and then exposed to different doses of UV (Table I). After three washes, the cells were incubated at 37°C for 30 min with 10 µM DCFH-DA in PBS. The fluorescence was measured using flow cytometry (excitation wavelengths were both 488 nm, and emission wavelengths were both 525 nm). (C) A comparison between 143B and Rho°206 cell lines shows that there was no significant difference in ROS production between the SIG groups (P>0.05). However, there were significant differences between the cell lines at the same irradiation doses. *P<0.05 vs. SIG control. The test was repeated three times and the image presented is representative of these three independent tests. Each bar represents the means ± SD from three experiments.
Figure 5
Figure 5
Effects of ultraviolet (UV) irradiation on the levels of cytochrome c (Cyt c) in the two cell lines. (A) Rho°206 cells and (B) 143B were exposed to different doses of UV radiation (Table I). The cytosolic fractions of Cyt c. were measured using western blot analysis. The experiment was repeated three times and the image presented is representative of these three independent tests.
Figure 6
Figure 6
A transmission electron microscopic comparison of 143B and Rho°206 cells. (A) ×20,000 magnification of 143B cells showing elongated mitochondria with parallel ordered cristae and normal electron density (indicated by black arrows). (B) ×20,000 magnification of Rho°206 cells. Mitochondria have an irregular cristae pattern and a 'whorled appearance' and are enlarged with almost complete or partial loss of the internal cristae structural pattern. Cytoplasmic vacuoles are enlarged and appear more numerous in (B) compared with (A).

References

    1. Orrenius S, Gogvadze V, Zhivotovsky B. Mitochondrial oxidative stress: implications for cell death. Annu Rev Pharmacol Toxicol. 2007;47:143–183. doi: 10.1146/annurev.pharmtox.47.120505.105122. - DOI - PubMed
    1. King MP, Attardi G. Human cells lacking mtDNA: repopulation with exogenous mitochondria by complementation. Science. 1989;246:500–503. doi: 10.1126/science.2814477. - DOI - PubMed
    1. Chandel NS, Schumacker PT. Cells depleted of mitochondrial DNA (ϱ°) yield insight into physiological mechanisms. FEBS Lett. 1999;454:173–176. doi: 10.1016/S0014-5793(99)00783-8. - DOI - PubMed
    1. Higuchi M, Aggarwal BB, Yeh ET. Activation of CPP32-like protease in tumor necrosis factor-induced apoptosis is dependent on mitochondrial function. J Clin Invest. 1997;99:1751–1758. doi: 10.1172/JCI119339. - DOI - PMC - PubMed
    1. Amuthan G, Biswas G, Zhang SY, Klein-Szanto A, Vijayasarathy C, Avadhani NG. Mitochondria-to-nucleus stress signaling induces phenotypic changes, tumor progression and cell invasion. EMBO J. 2001;20:1910–1920. doi: 10.1093/emboj/20.8.1910. - DOI - PMC - PubMed

MeSH terms