. 2016 Aug 11;166(4):1041-1054.
doi: 10.1016/j.cell.2016.07.007. Epub 2016 Aug 4.

Phosphoproteome Integration Reveals Patient-Specific Networks in Prostate Cancer

Affiliations

Phosphoproteome Integration Reveals Patient-Specific Networks in Prostate Cancer

Justin M Drake et al. Cell. .

Abstract

We used clinical tissue from lethal metastatic castration-resistant prostate cancer (CRPC) patients obtained at rapid autopsy to evaluate diverse genomic, transcriptomic, and phosphoproteomic datasets for pathway analysis. Using Tied Diffusion through Interacting Events (TieDIE), we integrated differentially expressed master transcriptional regulators, functionally mutated genes, and differentially activated kinases in CRPC tissues to synthesize a robust signaling network consisting of druggable kinase pathways. Using MSigDB hallmark gene sets, six major signaling pathways with phosphorylation of several key residues were significantly enriched in CRPC tumors after incorporation of phosphoproteomic data. Individual autopsy profiles developed using these hallmarks revealed clinically relevant pathway information potentially suitable for patient stratification and targeted therapies in late stage prostate cancer. Here, we describe phosphorylation-based cancer hallmarks using integrated personalized signatures (pCHIPS) that shed light on the diversity of activated signaling pathways in metastatic CRPC while providing an integrative, pathway-based reference for drug prioritization in individual patients.


Figures

Figure 1
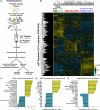
Figure 1. Characterization of the phosphoproteome in metastatic CRPC tissues
(A) General workflow of the phosphopeptide enrichment and quantitative mass spectrometry protocol followed by data and pathway analyses. Analyses described in the text. (B) Unsupervised hierarchical clustering heatmap of phosphoserine and phosphothreonine peptides identified from prostate cancer cell lines and tissues. 3,911 unique phosphopeptides (rows) were significantly identified from over 36 samples (columns). Unsupervised hierarchical clustering was performed using the Cluster program with the Pearson correlation and pairwise complete linkage analysis. (C-E) Gene set enrichment analysis (GSEA) was performed to identify canonical pathways (C) and transcription factor targets (D) with activity either higher (right yellow bars) or lower (left blue bars) in metastatic CRPC compared to primary tissue. (E) Kinase/substrate enrichment analysis (KSEA) identified several unique kinases that were not directly sequenced by the mass spectrometer in the phosphoproteomic data; NES = normalized enrichment score, Yellow = hyperphosphorylation, Blue = hypophosphorylation in the heatmap (B). See also Data S1a-S1f.
Figure 2
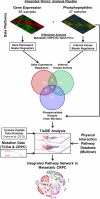
Figure 2. Pipeline for omic dataset integration
Flow diagram depicting the integration pipeline. 27 gene expression and 16 phosphoproteomic CRPC patient datasets were integrated with mutational data and combined using TieDIE to generate the resulting integrated network. The overlay of input gene expression, kinase master regulators, and phosphorylated kinases are shown as a Venn diagram. See also Figures S1-S2, Data S1g-S1j.
Figure 3
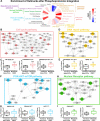
Figure 3. Pathway analysis of metastatic CRPC
Enriched cancer hallmarks generated by dataset integration using TieDIE after inclusion of the phosphoproteomic and gene expression data relative to gene expression data alone (A). Several cancer hallmarks were enriched after inclusion of the phosphoproteomic data including the cell cycle pathway (B, red nodes), DNA repair pathway (D, yellow nodes), AKT/mTOR/MAPK pathway (F, blue nodes), and the nuclear receptor pathway (H, green nodes). Detailed analysis of each of these pathways revealed several common and unique players with high connectivity. Assessment of a select number of kinases and phosphoproteins from each network confirmed their elevated phosphorylation state (C, E, G, I) including some with direct phosphorylation on their enzymatic active residue (C, E). This supports the activation state of the networks observed. Black arrow represents phosphoresidues that result in enzymatic activity of the given protein. These defined subnetworks only contain genes that fall within both the curated hallmark gene sets and the previously generated scaffold network, with colored nodes corresponding to genes that are members of a hallmark and exclusive to the integrated network solution containing the phosphoproteomic data; grey genes are other scaffold members in the surrounding region. T-test was performed to calculate significance. *=p<0.05, **=p<0.01, ***=p<0.001, ****=p<0.0001. See also Figure S3.
Figure 4
Figure 4. Development of a patient-specific network using VIPER
(A) Flow diagram depicting the integration of gene expression and phosphoproteomic datasets for VIPER analysis. (B) Heatmap of the gene expression and kinase master regulators and phosphorylated kinases for all 6 patients. This data was used as the input for patient-specific network analysis. See also Figure S4.
Figure 5
Figure 5. Integrated pathway network of patient RA40
(A) Phosphorylation-based cancer hallmarks using integrated personalized signatures (pCHIPS) analysis for patient RA40 revealed strong enrichment of cell cycle and PI3K-AKT-mTOR pathway networks. The pCHIPS wheel summarizes enrichment between genes in each patient-specific network and the corresponding pCHIPS category: labels indicate categories with significant enrichment after multi-hypothesis correction (FDR < 0.1). Black dots indicate SNV and copy-number genomic events in this patient. Patient-specific network nodes and edges related to cell cycle pathway (B, C), nuclear receptor pathway (D), PI3K-AKT-mTOR pathway (E), and stemness pathways (F). Edges belonging to both the patient-specific network model and the cell cycle related scaffold network are shown as thick yellow edges, while corresponding genes are shaded in dark grey. Yellow arrows indicate that the upstream kinase directly phosphorylates the downstream substrate. “Circleplot” quadrants for each gene summarize genomic, transcriptomic and phosphoproteomic activity relevant to metastatic CRPC phenotype (upper right: amplification; lower right: deletion; lower left: mutation; upper left: transcriptional regulatory activity; center: kinase regulatory activity). Node “ears” peripherally attached to circleplots represent relative phosphorylation of specific, functionally annotated peptides sites on each protein. Genes and edges that are not represented in the patient-specific network but are in the scaffold network are shown in light grey. See also Figure S5, Data S1k, and Data S2.
Figure 6
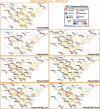
Figure 6. Comparison of the stemness pathway hallmarks across all 7 patient samples
Patient-specific networks were developed from the stemness pathway hallmarks and revealed distinct regions of the network were differentially activated across the CRPC patient samples. This suggests that while the stemness pathway hallmarks were enriched in all the patients evaluated, a patient-specific evaluation is needed to determine the precise targets for therapy. Genes and edges that are not represented in the patient-specific network but are in the scaffold network are shown in light grey.
Figure 7
Figure 7. Summary of kinase target potential in patient-specific networks
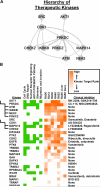
(A) Network diagram of hierarchy between kinase targets derived from KSEA interactions and potential “coverage” of phosphopeptides activated in CRPC. The thickness of each edge represents the degree of overlap in the set of protein targets that each kinase is predicted to phosphorylate. Directed arrows indicate predicted phosphorylation from a (source) kinase, at a residue on the corresponding target kinase. (B) Therapeutic potential and summary of kinase targets. Far left: the hierarchy of therapeutic kinase targets shown in part (A) is briefly summarized. Left: Green boxes indicate kinases (rows) that are members of each of the six major hallmark subnetworks (columns) shown in Figure 3. Right: Orange boxes indicate the predicted importance of kinase targets based on the combined evidence from VIPER-inferred kinase activity, phosphorylation status of functionally annotated peptides, and connectivity, for each patient specific network (columns). Currently available clinical inhibitors for each are listed on the right. See also Figures S6-S7, Data S1l-S1m.

References

    1. Alvarez MJ, Giorgi F, Califano A. Using viper, a package for Virtual Inference of Protein-activity by Enriched Regulon analysis. 2015.
    1. Aytes A, Alvaro A, Antonina M, Celine L, Alvarez MJ, Mireia C-M, Tian Z, Eastham JA, Anuradha G, Pienta KJ, et al. Cross-Species Regulatory Network Analysis Identifies a Synergistic Interaction between FOXM1 and CENPF that Drives Prostate Cancer Malignancy. Cancer Cell. 2014;25:638–651. - PMC - PubMed
    1. Beltran H, Rickman DS, Park K, Chae SS, Sboner A, MacDonald TY, Wang Y, Sheikh KL, Terry S, Tagawa ST, et al. Molecular characterization of neuroendocrine prostate cancer and identification of new drug targets. Cancer Discov. 2011;1:487–495. - PMC - PubMed
    1. de Bono JS, Logothetis CJ, Molina A, Fizazi K, North S, Chu L, Chi KN, Jones RJ, Goodman OB, Jr, Saad F, et al. Abiraterone and increased survival in metastatic prostate cancer. N. Engl. J. Med. 2011;364:1995–2005. - PMC - PubMed
    1. Cancer Genome Atlas Network Comprehensive molecular characterization of human colon and rectal cancer. Nature. 2012a;487:330–337. - PMC - PubMed

Publication types