An official website of the United States government
The .gov means it’s official.
Federal government websites often end in .gov or .mil. Before
sharing sensitive information, make sure you’re on a federal
government site.
The site is secure.
The https:// ensures that you are connecting to the
official website and that any information you provide is encrypted
and transmitted securely.
1 Department of Medicine, Duke University Medical Center, Durham, NC 27710, USA.
2 Department of Biochemistry and Institute for Research in Immunology and Cancer, University of Montreal, Montreal, QC H3C 3J7, Canada.
3 Department of Medicine, Duke University Medical Center, Durham, NC 27710, USA; Department of Biochemistry, Duke University Medical Center, Durham, NC 27710, USA.
4 Life Sciences Institute, University of Michigan, Ann Arbor, MI 48109, USA.
5 Department of Pharmacology, University of Michigan, Ann Arbor, MI 48109, USA.
6 Department of Pharmacology, University of Michigan, Ann Arbor, MI 48109, USA; Department of Pharmacology, University of California, San Diego, La Jolla, CA 92093, USA.
7 Department of Biochemistry and Institute for Research in Immunology and Cancer, University of Montreal, Montreal, QC H3C 3J7, Canada. Electronic address: michel.bouvier@umontreal.ca.
8 Department of Medicine, Duke University Medical Center, Durham, NC 27710, USA; Department of Biochemistry, Duke University Medical Center, Durham, NC 27710, USA; Howard Hughes Medical Institute, Duke University Medical Center, Durham, NC 27710, USA. Electronic address: lefko001@receptor-biol.duke.edu.
Classically, G protein-coupled receptor (GPCR) stimulation promotes G protein signaling at the plasma membrane, followed by rapid β-arrestin-mediated desensitization and receptor internalization into endosomes. However, it has been demonstrated that some GPCRs activate G proteins from within internalized cellular compartments, resulting in sustained signaling. We have used a variety of biochemical, biophysical, and cell-based methods to demonstrate the existence, functionality, and architecture of internalized receptor complexes composed of a single GPCR, β-arrestin, and G protein. These super-complexes or "megaplexes" more readily form at receptors that interact strongly with β-arrestins via a C-terminal tail containing clusters of serine/threonine phosphorylation sites. Single-particle electron microscopy analysis of negative-stained purified megaplexes reveals that a single receptor simultaneously binds through its core region with G protein and through its phosphorylated C-terminal tail with β-arrestin. The formation of such megaplexes provides a potential physical basis for the newly appreciated sustained G protein signaling from internalized GPCRs.
Figure 1. Sustained Gs Signaling from Internalized…
Figure 1. Sustained Gs Signaling from Internalized Compartments by β 2 AR, β 2 V …
(A) Real-time…
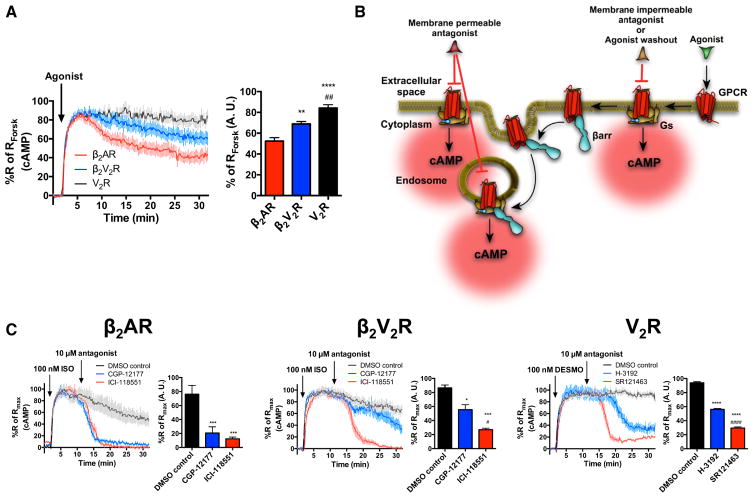
Figure 1. Sustained Gs Signaling from Internalized Compartments by β2AR, β2V2R, and V2R
(A) Real-time cAMP measurements, using ICUE2-expressing HEK293 cells, in response to agonist stimulation of β2AR (red), β2V2R (blue), and V2R (black). For β2AR and β2V2R, 1 μM ISO was used to stimulate cells. For V2R, 100 nM AVP was used to stimulate cells. Surface expression of all GPCRs was matched. Data represent the mean ± SE of N = 3 experiments and n ≥ 90 cells. Area under the curve (AUC) was used to calculate the total cAMP response for each GPCR, and one-way ANOVA was performed to determine statistical differences relative to β2AR (**p < 0.01; ****p < 0.0001) and β2V2R (##, p < 0.01) responses. (B) Schematic representation of the experimental design used to demonstrate sustained Gs activation and signaling from internalized GPCRs. (C) Real-time cAMP measurements utilized to demonstrate intracellular Gs signaling by GPCRs. Agonist-stimulated cAMP responses (100 nM ISO for β2AR and β2V2R or 100 nM of desmopressin [DESMO] for V2R) was antagonized at 10 min by the addition of 10 μM of cell-membrane-impermeable antagonist (CGP-12217 for β2AR and β2V2R, or H-3192 for V2R; shown in blue). The impact of cell-membrane-impermeable antagonists was measured relative to total antagonism caused by cell-membrane-permeable antagonists (ICI-118551 for β2AR and β2V2R or SR121463 for V2R). Data represent the mean ± SE of N = 3 experiments and n ≥ 87 cells. AUC was used to calculate the total cAMP response for each GPCR after the respective treatments. One-way ANOVA was performed to determine statistical differences among the antagonists compared to DMSO (*p < 0.05; ***p < 0.001; ****p < 0.0001) or compared to cell-membrane-impermeable antagonists (#, p < 0.05; ####, p < 0.0001). See also Figure S1.
Figure 2. Sustained Gs Activation from Internalized…
Figure 2. Sustained Gs Activation from Internalized Compartments by β 2 AR, β 2 V …
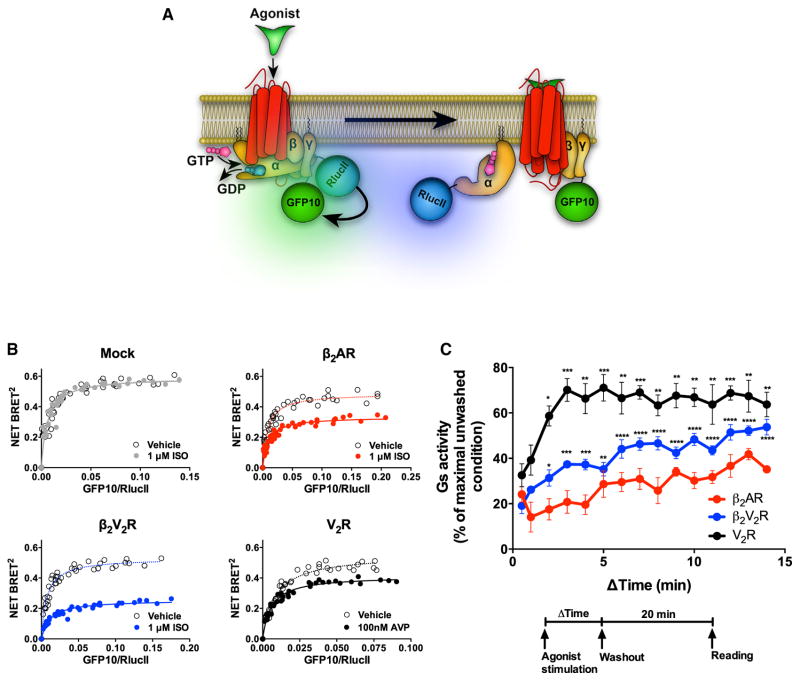
Figure 2. Sustained Gs Activation from Internalized Compartments by β2AR, β2V2R, and V2R Assessed by BRET
(A) Schematic representation of the experimental design used to monitor agonist-promoted Gs activation, which leads to the separation of Gαs and Gβγ subunits, measured by BRET between RlucII-117-Gαs and GFP10-Gγ1. (B) BRET titration curves obtained using a constant amount of RlucII-Gαs and with increasing amounts of GFP10-Gγ1. BRET was measured 35 min following the addition of agonist or vehicle. Data are pooled from N = 4 experiments. (C) Relationship between the duration of agonist stimulation time and Gs activation response 20 min after agonist washout. Gs activity was determined by assessing the reduction in BRET signal between RlucII-117-Gαs and GFP10-Gγ1. Surface expression of all GPCRs was matched. Data are shown as a percent of BRET decrease observed in the unwashed condition (i.e., in the continuous presence of agonist) and represents the mean ± SE of N = 4–5 experiments. One-way ANOVA was performed to assess significant differences in Gs response by increasing agonist stimulation time versus pulse stimulation (0.5 min) (*p < 0.05; **p < 0.01; ***p < 0.001; ****p < 0.0001). See also Figure S1.
Figure 3. Cellular Localization of SNAP-β 2 …
Figure 3. Cellular Localization of SNAP-β 2 V 2 R Pre-labeled with SNAP-Surface 649 Fluorescent…
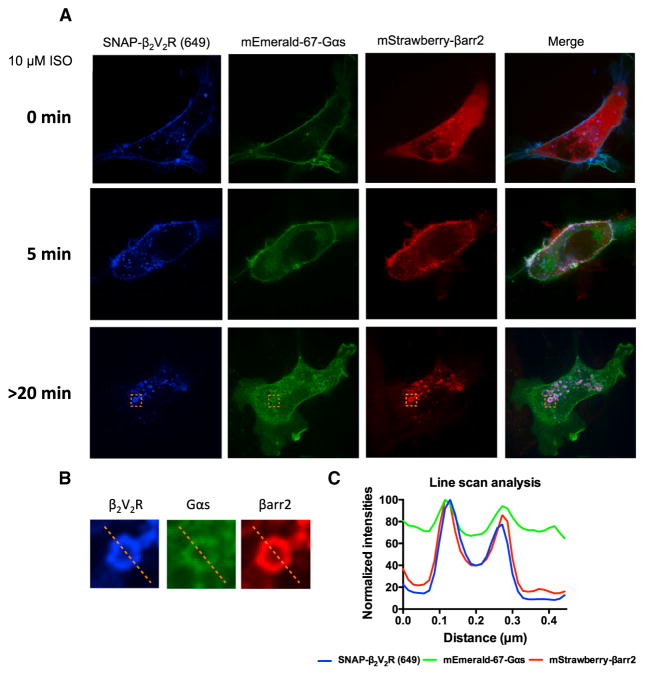
Figure 3. Cellular Localization of SNAP-β2V2R Pre-labeled with SNAP-Surface 649 Fluorescent Substrate, mStrawberry-βarr2, and mEmerald-67-Gαs Visualized by Confocal Microscopy
(A) Cellular localization of SNAP-β2V2R (649), mStrawberry-βarr2, and mEmerald-67-Gαs prior to agonist addition (0 min) or 5 min and >20 min after 10 μM ISO treatment (100× objective, N = 4 experiments, n = 49 cells). (B) Representative endosome (orange dotted box) demonstrating co-localization of SNAP-β2V2R (649), mStrawberry-βarr2, and mEmerald-67-Gαs at >20 min post-ISO addition. (C) Line-scan analysis of representative endosomal fluorophore intensities. See also Figures S1, S2, and S3.
Figure 4. Interaction between βarr1/2 and Either…
Figure 4. Interaction between βarr1/2 and Either Gαs or Gγ2 following Agonist Stimulation of β …
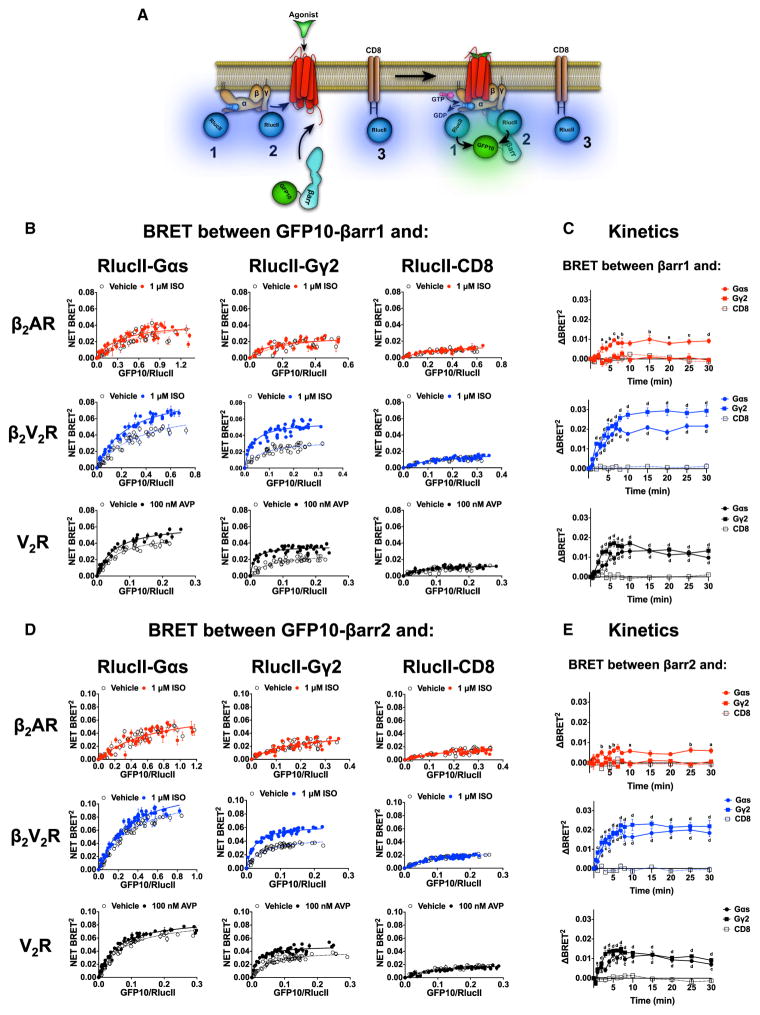
Figure 4. Interaction between βarr1/2 and Either Gαs or Gγ2 following Agonist Stimulation of β2AR, β2V2R, or V2R
(A) Schematic representation of the experimental design used to monitor agonist-promoted BRET between RlucII-67-Gαs (1), RlucII-Gγ2 (2), or RlucII-CD8 (3) and GFP10-βarr1/2. (B and D) BRET titration curves using a constant amount of RlucII-67-Gαs, RlucII-Gγ2, or RlucII-CD8 and increasing amounts of GFP10-βarr1 (B) or GFP10-βarr2 (D) monitored 20 min after agonist stimulation. Data are expressed as net BRET absolute values and represent the mean ± SE and are pooled from N = 3–5 experiments. Surface expression of all GPCRs was matched. (C and E) Kinetics of agonist-promoted BRET between GFP10-βarr1 (C) or GFP10-βarr2 (E) and RlucII-Gαs, RlucII-Gγ2, or RlucII-CD8 obtained for all three GPCRs. Each kinetic point represents the mean ± SE of ΔBRET between agonist-stimulated and vehicle-treated conditions (N = 3–10 experiments). Two-way ANOVA was performed to determine significant differences between CD8 condition and Gαs or Gγ2 for each time point (a p < 0.05; b p < 0.01; c p < 0.001; d p < 0.0001). See also Figures S1 and S5.
Figure 5. Functionality and Capability of β …
Figure 5. Functionality and Capability of β 2 V 2 R-βarr1/2 Fusions to Activate Gs…
(A)…
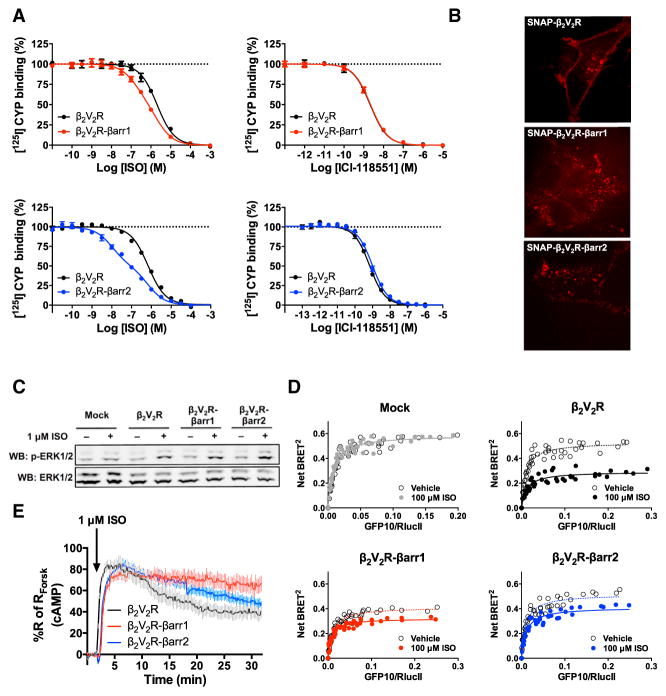
Figure 5. Functionality and Capability of β2V2R-βarr1/2 Fusions to Activate Gs in HEK293 Cells
(A) Functional assessment of β2V2R-βarr1/2 fusions using radioligand competition binding experiments. Both agonist (ISO) and antagonist (ICI-118551) successfully competed off [125I]-CYP at β2V2R, β2V2R-βarr1 and β2V2R-βarr2. Data represent the mean ± SE of N = 3–4 experiments. (B) Cellular localization of SNAP-β2V2R and SNAP-β2V2R-βarr1/2 fusions pre-labeled with SNAP-Surface 549 fluorescent substrate (549) using confocal microscopy (100× objective, N = 3 experiments, and n ≥ 16 cells). (C) Characterization of 1 μM ISO-stimulated ERK1/2 phosphorylation response at 10 min post-stimulation in mock, β2V2R, β2V2R-βarr1, and β2V2R-βarr2-transfected cells (N = 6 experiments). (D) ISO-stimulated Gs activation in mock (gray), β2V2R (black), β2V2R-βarr1 (red), and β2V2R-βarr2 (blue) transfected cells determined by BRET titration curves 30 min after stimulation (N = 4 experiments). (E) Real-time cAMP measurement, utilizing HEK293-ICUE2 cells, in response to ISO-stimulation of β2V2R (black), β2V2R-βarr1 (red), and β2V2R-βarr2 (blue). Data represent the mean ± SE of N = 3 experiments and n ≥ 93 cells. Surface expression of GPCRs was matched in all experiments. See also Figures S1 and S4.
Figure 6. In Vitro Formation and Functional…
Figure 6. In Vitro Formation and Functional Characterization of the Megaplex
(A) Coomassie-stained gels of…
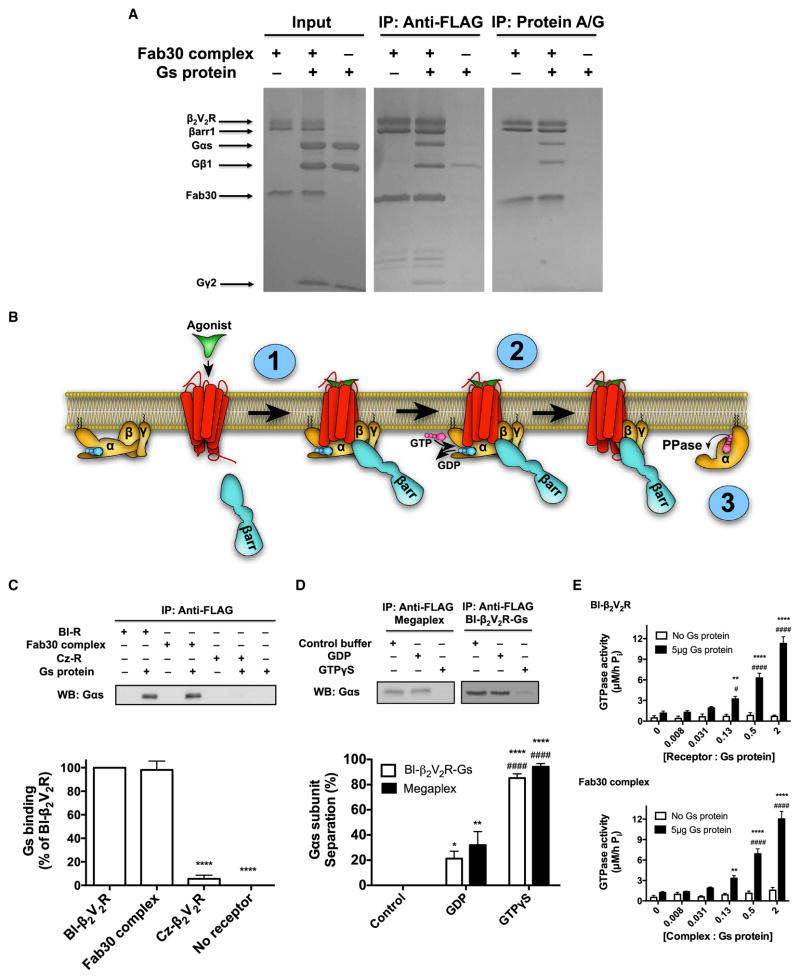
Figure 6. In Vitro Formation and Functional Characterization of the Megaplex
(A) Coomassie-stained gels of representative coIP experiments of the megaplex by either M1 anti-FLAG beads (to pull-down FLAG-β2V2R; left) or protein A/G agarose beads (to pull-down Fab30; right) (N = 4 experiments). (B) Schematic presentation of the biochemical steps in G protein activation in the megaplex: (1) heterotrimeric G protein is recruited to the GPCR-βarr “tail” conformation to form the megaplex in an agonist-dependent manner; (2) activated receptor in the megaplex stimulates GDP-GTP exchange in the heterotrimeric G protein, causing activation and separation of the Gαs subunit; and (3) activated Gαs subunit has intrinsic GTPase activity causing hydrolysis of GTP to GDP and inorganic phosphate (Pi). (C) M1 anti-FLAG coIP experiment of BI-occupied β2V2R, Fab30 complex, or Cz-occupied β2V2R both with and without heterotrimeric Gs present. Gs binding was determined and quantified by western blot using an anti-Gαs antibody. Data represent the mean ± SE of N = 4 experiments. One-way ANOVA was performed with pairwise comparison to BI-β2V2R (****p < 0.0001). (D) M1 anti-FLAG coIP experiment with either BI-occupied β2V2R-Gs complex or megaplex in presence of control buffer, 20 μM GDP, or 20 μM GTPγS. Gαs subunit separation was determined and quantified by western blot by using an anti-Gαs antibody. Data represent the mean ± SE of N = 4 experiments. Two-way ANOVA was performed to assess significant differences between control buffer (*p < 0.05; **p < 0.01; ****p < 0.0001) and GDP (####, p < 0.0001). There were no statistical differences between the BI-occupied β2V2R-Gs complex and the megaplex. (E) Characterizing the ability of BI-occupied β2V2R (top) or Fab30 complex (bottom) to modulate GDP-GTP exchange and Gs activity via GTPase activity. Data represent the mean ± SE of N = 5–6 experiments. Two-way ANOVA was performed to test the effect of Gs presence at each receptor/complex concentrations (**p < 0.01; ****p < 0.0001), and one-way ANOVA tests the effect on Gs modulation by different receptor/complex concentrations (#, p < 0.05; ####, p < 0.0001). See also Figure S5.
Figure 7. Single-Particle EM Analysis of the…
Figure 7. Single-Particle EM Analysis of the (T4L) β 2 V 2 R-Gs-Nb35-βarr1-Fab30 Megaplex
(A) Representative EM image of…
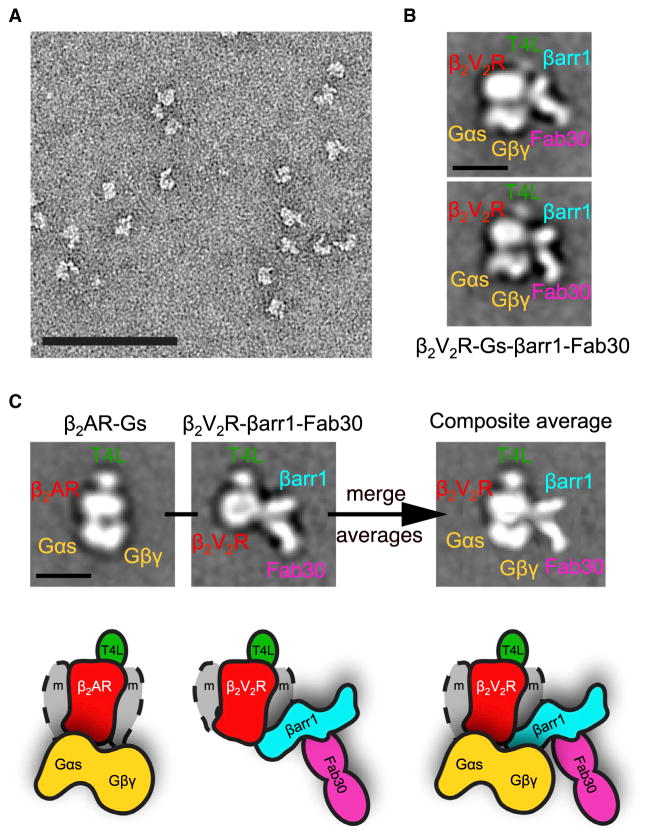
Figure 7. Single-Particle EM Analysis of the (T4L) β2V2R-Gs-Nb35-βarr1-Fab30 Megaplex
(A) Representative EM image of negative-stained megaplex. (B) Representative class averages of the megaplex (135 total particle projections). (C) Class averages of the previously published (T4L) β2AR-Gs-Nb35 complex and the (T4L)β2V2R-βarr1-Fab30 complex in the “tail” conformation (images reprinted and modified from Shukla et al., 2014; Westfield et al., 2011). Superimposition of these averages results in a density map identical to the one representing the megaplex. The scale bars in (A–C) correspond to 100, 10, and 10 nm, respectively. See also Figures S6 and S7.
Audet N, Charfi I, Mnie-Filali O, Amraei M, Chabot-Doré AJ, Millecamps M, Stone LS, Pineyro G. Differential association of receptor-Gβγ complexes with β-arrestin2 determines recycling bias and potential for tolerance of δ opioid receptor agonists. J Neurosci. 2012;32:4827–4840.
-
PMC
-
PubMed