. 2018 Feb;15(2):158-170.
doi: 10.1038/cmi.2016.42. Epub 2016 Aug 8.

CD5 expression promotes IL-10 production through activation of the MAPK/Erk pathway and upregulation of TRPC1 channels in B lymphocytes

Affiliations

CD5 expression promotes IL-10 production through activation of the MAPK/Erk pathway and upregulation of TRPC1 channels in B lymphocytes

Soizic Garaud et al. Cell Mol Immunol. 2018 Feb.

Abstract

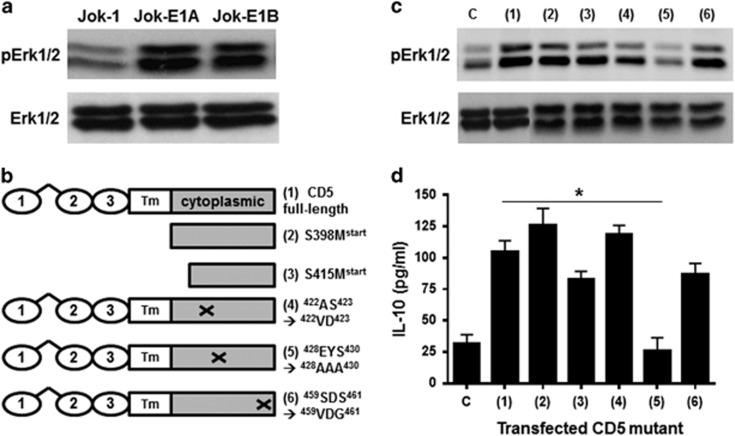
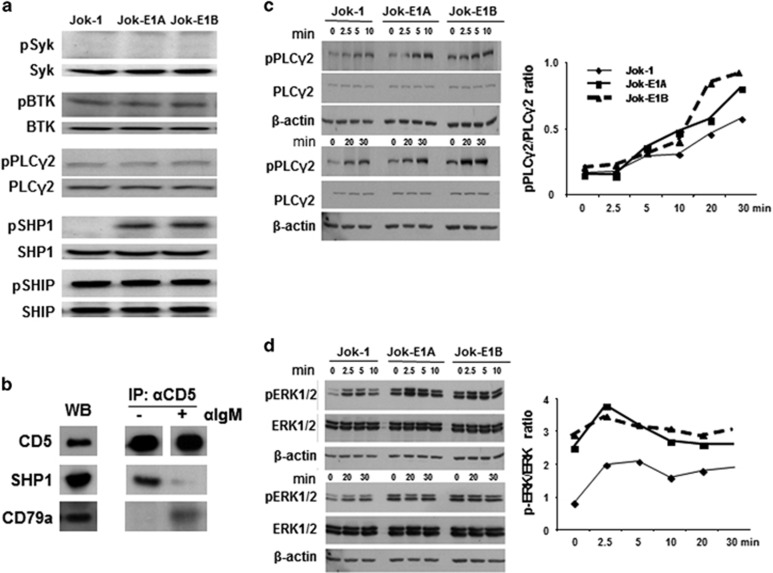
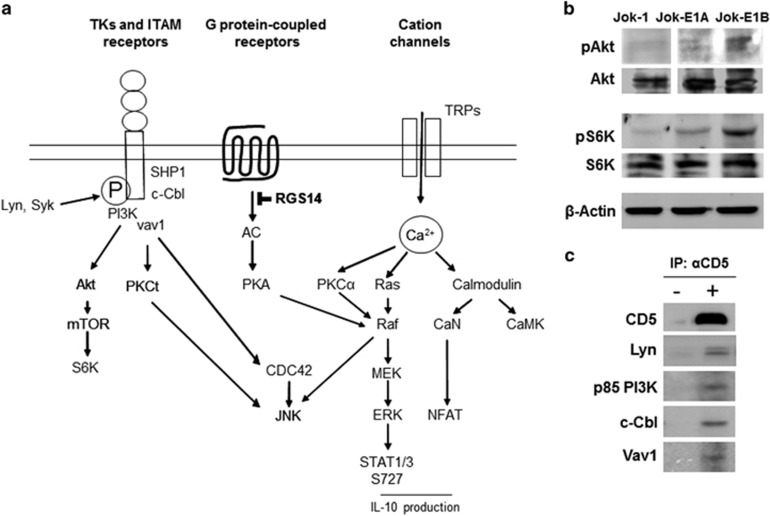
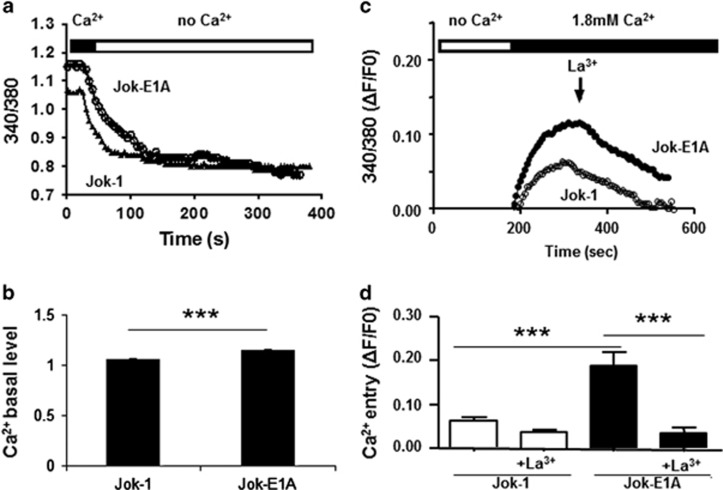
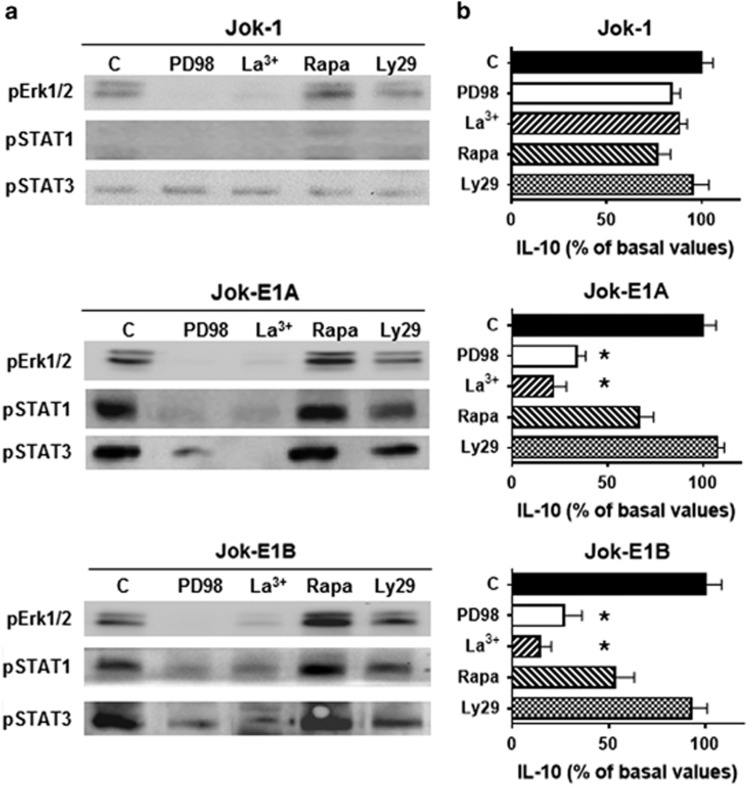
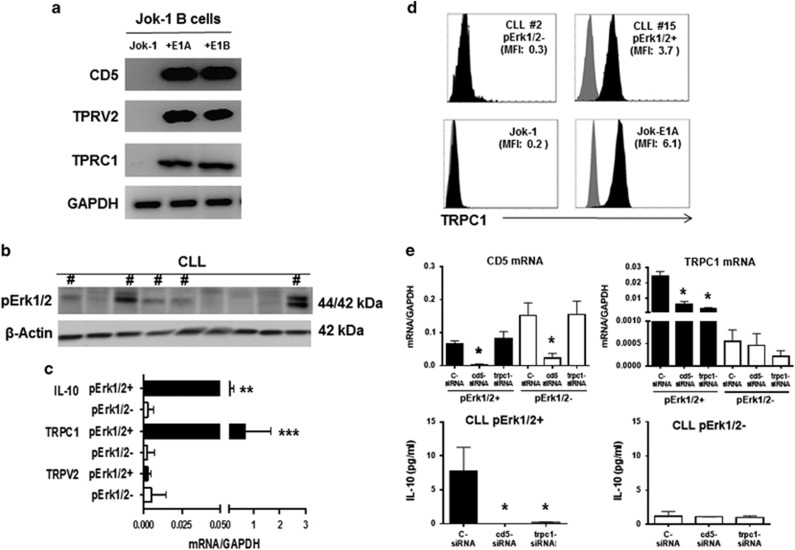
CD5 is constitutively expressed on T cells and a subset of mature normal and leukemic B cells in patients with chronic lymphocytic leukemia (CLL). Important functional properties are associated with CD5 expression in B cells, including signal transducer and activator of transcription 3 activation, IL-10 production and the promotion of B-lymphocyte survival and transformation. However, the pathway(s) by which CD5 influences the biology of B cells and its dependence on B-cell receptor (BCR) co-signaling remain unknown. In this study, we show that CD5 expression activates a number of important signaling pathways, including Erk1/2, leading to IL-10 production through a novel pathway independent of BCR engagement. This pathway is dependent on extracellular calcium (Ca2+) entry facilitated by upregulation of the transient receptor potential channel 1 (TRPC1) protein. We also show that Erk1/2 activation in a subgroup of CLL patients is associated with TRPC1 overexpression. In this subgroup of CLL patients, small inhibitory RNA (siRNA) for CD5 reduces TRPC1 expression. Furthermore, siRNAs for CD5 or for TRPC1 inhibit IL-10 production. These findings provide new insights into the role of CD5 in B-cell biology in health and disease and could pave the way for new treatment strategies for patients with B-CLL.


Conflict of interest statement

The authors declare no conflict of interest.

Figures

Figure 1
Figure 1
Constitutive Erk1/2 activation and IL-10 production in CD5-expressing B cells is dependent on the phosphorylation of Y429 in the CD5 molecule. (a) The upper panel depicts WB analysis of phosphorylated Erk1/2 (pErk1/2) in untransfected Jok-1 cells and Jok-1 cells transfected with membrane (E1A-CD5) or cytoplasmic (E1B-CD5) CD5. The lower panel shows the total levels of Erk1/2. (b) Cartoons representing full-length CD5 and the mutants generated in this study to identify sites in CD5 involved in Erk1/2 activation. CD5 has three extracellular domains (1–3), a transmembrane (Tm) region and a cytoplasmic domain. Truncated CD5 molecules (S398Mstart and S415Mstart) are named according to their start codons. (c) WB of constitutive Erk1/2 phosphorylation in untransfected Jok-1 cells (labeled c) and cells transfected with native CD5 (1) or with the mutants generated as shown in the cartoons. (d) ELISA results for IL-10 levels produced by the corresponding cells in c. The cells were cultured for 48 h. The data in c and d represent three independent experiments. Statistical analyses were performed by calculating the Mann–Whitney U-test for IL-10 production. * indicates P<0.05 for significant differences in IL-10 production between Jok-1 cells transfected with 428AAA430 compared with the full-length CD5 molecule. Erk1/2, extracellular signal-regulated kinases 1/2; ELISA, enzyme-linked immunosorbent assay; pErk1/2; phosphorylated Erk1/2; WB, western blotting.
Figure 2
Figure 2
Constitutive Erk1/2 phosphorylation in CD5-expressing B cells is BCR-independent. (a) WB analysis of Syk, BTK, PLCγ2, SHP1 and SHIP phosphorylation in Jok-1, Jok-E1A and Jok-E1B cells. (b) Anti-CD5 immunoprecipitation (IP: αCD5) followed by WB of Jok-E1A cells to assess the association between CD5 and the BCR complex in resting and F(ab’)2 anti-human IgM (α-IgM)-stimulated Jok-E1A cells. The left panel shows CD5, CD79a and SHP1 in Jok-E1A cell lysate (WB), tested as controls. The panel on the right depicts the association between CD5 and CD79a after α-IgM stimulation following IP with anti-CD5 mAb (c) WB to reveal the kinetics of PLCγ2 phosphorylation in unstimulated Jok-1, Jok-E1A and Jok-E1B cells or cells stimulated with anti-IgM. The upper three panels depict the kinetics of PLCγ2 activation from 0 to 10 min after BCR engagement with the anti-IgM. The blots indicate pPLCγ2; the middle band is total PLCγ2 protein (PLCγ2), and the lower band is β-actin protein. The bottom three panels depict the levels of pPLCγ2 at time points 0, 20 and 30 min after BCR engagement with anti-IgM. (d) Analysis of the kinetics of pErk1/2 following BCR engagement arranged as in c. The two graph panels to the right of the western blots represent semi-quantification data for the levels of pPLCγ2 as in c and pErk1/2 in d for the signaling molecules, represented as the ratio of band intensity for the phosphorylated proteins to the band intensity of the total protein. BCR, B-cell receptor; BTK, Bruton’s tyrosine kinase; Erk1/2, extracellular signal-regulated kinases 1/2; IP, immunoprecipitation; pPLCγ2, phosphorylated PLCγ2; SHIP, SH2-containing inositol phosphatase; SHP1; SH2 domain-containing protein tyrosine phosphatase-1; WB, western blotting.
Figure 3
Figure 3
Key signaling pathways affected by CD5 expression. (a) A cartoon representing the major kinases and signaling pathways whose activities are affected by CD5 expression in Jok-1 B cells. Only the major kinases and signaling pathways are shown based on the kinome array analysis and WB in the current study and data from the literature. (b) WB showing phosphorylation (top) and total protein levels (bottom) of Akt and S6K in Jok-1, Jok-E1A and Jok-E1B cells. (c) Immunoprecipitation with anti-CD5 mAb in Jok-E1A cells reveals that CD5 associates with Lyn, the p85 regulatory unit of PI3K, c-Cbl and Vav1. Representative of three independent experiments. ITAM, immune receptor tyrosine-based activation motifs; TK, tyrosine kinase; WB, western blotting.
Figure 4
Figure 4
CD5 expression modulates the Ca2+ pathway in B cells. (a) CD5 expression in Jok-E1A cells increases the basal levels of intracellular Ca2+ (iCa2+) compared with Jok-1 cells. (b) Histograms representing basal levels of iCa2+ in Jok-1 and Jok-E1A cells. The increase in basal iCa2+ in Jok-E1A cells is sensitive to extracellular Ca2+ depletion (no Ca2+), as can be noted in a and confirmed in c. Re-addition of extracellular Ca2+ to resting Jok-1 and Jok-E1A cells as shown in c reveals a high extracellular and constitutive Ca2+ influx in Jok-E1A cells. This influx can be reversed in the presence of lanthanum (La3+); ratios are normalized to basal values (F0), indicated as (ΔF/F0). The mean and s.e.m. of the ΔF/F0 values in c are from six independent experiments presented in histograms in d. *** indicates P<0.001 values for the difference between the two cell lines, as determined using Student’s t-test.
Figure 5
Figure 5
CD5 promotes the phosphorylation of Erk1/2 and STAT1/STAT3 S727 and IL-10 production, which are dependent on extracellular Ca2+ entry. (a) Analysis of constitutive Erk1/2 phosphorylation, STAT1 S727 phosphorylation, STAT3 S727 phosphorylation and (b) IL-10 production in Jok-1, Jok-E1A and Jok-E1B cells after 48 h of culture in the presence of PD98059 (at 50 μM for WB and at 100 μM for IL-10 production), lanthanum (La3+), rapamycin (Rapa) or Ly294002 (Ly29). PD98059 inhibits MEK1 and 2; La3+ blocks extracellular Ca2+ entry; rapamycin inhibits PI3-K/mTOR; and Ly294002 inhibits PI3K/Akt. Cells cultured without inhibitors are used as controls and marked ‘c’. IL-10 levels produced by cells cultured either alone or with the indicated inhibitors were determined using ELISA, and IL-10 levels are expressed as the percentage of basal values; % reduction is presented as the mean and s.e.m. for three independent experiments. The basal value of IL-10 was 32±6.9 pg/ml in Jok-1 cells and 105±8.7 pg/ml for CD5-transfected cells. * indicates P<0.05 for IL-10 production levels in the presence of a given inhibitor compared with cultured cells without inhibitors as determined by the Mann–Whitney U-test. ELISA, enzyme-linked immunosorbent assay. WB, western blotting.
Figure 6
Figure 6
TRPC1 regulates extracellular Ca2+ entry by CD5 in Jok-1 B cells and B cells from Erk1/2+ B-CLL patients. (a) Transcripts of CD5, TRPV2, TRPC1 and GAPDH in Jok-1, Jok-E1A and Jok-E1B B cells as determined using RT-PCR. (b) B-CLL patients were divided into two groups based on the phosphorylation status of the Erk1/2 protein as assessed using WB. # indicates B cells from CLL patients positive for constitutively phosphorylated Erk1/2. (c) Levels of IL-10 (n=26 patients), TRPC1 (n=26) and TRPV2 (n=12) transcripts relative to GAPDH mRNA as determined using real-time PCR in B cells from pErk1/2+ and pErk1/2 B-CLL patients. ** indicates P<0.01 and *** indicates P<0.001 for the relative levels of IL-10 and TRPC1 transcripts between pErk1/2+ and pErk1/2 B-CLL patients, respectively, as determined using Student’s t-test. (d) Representative FACS plot of extracellular TRPC1 protein expression (black histograms) in CLL#2 (pErk1/2), CLL#15 (pErk1/2+), Jok-1, and Jok-E1A cells. MFI, indicated for each cell; isotype controls are presented as gray histograms. (e) Histograms depicting levels of TRPC1, CD5 and IL-10 transcripts in B cells from pErk1/2+ (black histograms) and pErk1/2 (white histograms) B-CLL patients following transfection with c-siRNA, CD5-siRNA and TRPC1-siRNA. The top two histograms depict relative levels of CD5 (left) and TRPC1 (right) transcripts relative to GAPDH mRNA. The lower two histograms represent relative levels of IL-10 transcripts relative to GAPDH in pErk1/2+ (left) and pErk1/2 patients (right). B cells from three pErk1/2+ and three pErk1/2 B-CLL patients were studied in these experiments. * indicates P<0.05 for the levels of CD5, TRPC1 and IL-10 transcripts observed when using siRNA targeting CD5 or TRPC1 compared with c-siRNA. Statistical analyses were carried out using Student’s t-test. CLL, chronic lymphocytic leukemia; c-siRNA, control siRNA; MFI; mean fluorescence intensity; RT-PCR, PCR with reverse transcription; WB, western blotting.

References

    1. Berland R, Wortis HH. Origins and functions of B-1 cells with notes on the role of CD5. Annu Rev Immunol 2002; 20: 253–300. - PubMed
    1. Hardy RR, Hayakawa K, K. CD5B cells, a fetal B cell lineage. Adv Immunol 1994; 55: 297–339. - PubMed
    1. Hayakawa K, Formica AM, Colombo MJ, Ichikawa D, Shinton SA, Brill-Dashoff J et al. B cells generated by B-1 development can progress to chronic lymphocytic leukemia. Ann NY Acad Sci 2015; 1362: 250–255. - PubMed
    1. Gary-Gouy H, Harriague J, Bismuth G, Platzer C, Schmitt C, Dalloul AH. Human CD5 promotes B-cell survival through stimulation of autocrine IL-10 production. Blood 2002; 100: 4537–4543. - PubMed
    1. Burdin N, Rousset F, Banchereau J. B-cell-derived IL-10: production and function. Methods 1997; 11: 98–111. - PubMed

Publication types

LinkOut - more resources