Proteomic characterization of peroxisome proliferator-activated receptor-γ (PPARγ) overexpressing or silenced colorectal cancer cells unveils a novel protein network associated with an aggressive phenotype
- PMID: 27499265
- PMCID: PMC5423198
- DOI: 10.1016/j.molonc.2016.07.006
Proteomic characterization of peroxisome proliferator-activated receptor-γ (PPARγ) overexpressing or silenced colorectal cancer cells unveils a novel protein network associated with an aggressive phenotype
Abstract
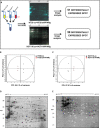
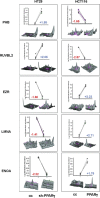
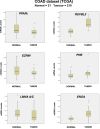
Peroxisome proliferator-activated receptor-γ (PPARγ) is a transcription factor of the nuclear hormone receptor superfamily implicated in a wide range of processes, including tumorigenesis. Its role in colorectal cancer (CRC) is still debated; most reports support that PPARγ reduced expression is associated with poor prognosis. We employed 2-Dimensional Differential InGel Electrophoresis (2-D DIGE) followed by Liquid Chromatography (LC)-tandem Mass Spectrometry (MS/MS) to identify differentially expressed proteins and the molecular pathways underlying PPARγ expression in CRC progression. We identified several differentially expressed proteins in HT29 and HCT116 CRC cells and derived clones either silenced or overexpressing PPARγ, respectively. In Ingenuity Pathway Analysis (IPA) they showed reciprocal relation with PPARγ and a strong relationship with networks linked to cell death, growth and survival. Interestingly, five of the identified proteins, ezrin (EZR), isoform C of prelamin-A/C (LMNA), alpha-enolase (ENOA), prohibitin (PHB) and RuvB-like 2 (RUVBL2) were shared by the two cell models with opposite expression levels, suggesting a possible regulation by PPARγ. mRNA and western blot analysis were undertaken to obtain a technical validation and confirm the expression trend observed by 2-D DIGE data. We associated EZR upregulation with increased cell surface localization in PPARγ-overexpressing cells by flow cytometry and immunofluorescence staining. We also correlated EZR and PPARγ expression in our series of CRC specimens and the expression profiling of all five proteins levels in the publicly available colon cancer genomic data from Oncomine and Cancer Genome Atlas (TCGA) colon adenocarcinoma (COAD) datasets. In summary, we identified a panel of proteins correlated with PPARγ expression that could be associated with CRC unveiling new pathways to be investigated for the selection of novel potential prognostic/predictive biomarkers and/or therapeutic targets.
Keywords: 2-D DIGE; Colorectal cancer; Ingenuity pathway analysis; Mass spectrometry; Peroxisome proliferator-activated receptor gamma; Proteomics.
Copyright © 2016 Federation of European Biochemical Societies. Published by Elsevier B.V. All rights reserved.
Figures


Similar articles
-
Peroxisome proliferator-activated receptor γ-mediated induction of microRNA-145 opposes tumor phenotype in colorectal cancer.Biochim Biophys Acta. 2014 Jun;1843(6):1225-36. doi: 10.1016/j.bbamcr.2014.03.003. Epub 2014 Mar 11. Biochim Biophys Acta. 2014. PMID: 24631504
-
Interplay between SOX9, β-catenin and PPARγ activation in colorectal cancer.Biochim Biophys Acta. 2013 Aug;1833(8):1853-65. doi: 10.1016/j.bbamcr.2013.04.004. Epub 2013 Apr 11. Biochim Biophys Acta. 2013. PMID: 23583560
-
Identification of differentially-expressed proteins between early submucosal non-invasive and invasive colorectal cancer using 2D-DIGE and mass spectrometry.Int J Immunopathol Pharmacol. 2011 Oct-Dec;24(4):849-59. doi: 10.1177/039463201102400404. Int J Immunopathol Pharmacol. 2011. PMID: 22230392
-
Emerging role of the β-catenin-PPARγ axis in the pathogenesis of colorectal cancer.World J Gastroenterol. 2014 Jun 21;20(23):7137-51. doi: 10.3748/wjg.v20.i23.7137. World J Gastroenterol. 2014. PMID: 24966585 Free PMC article. Review.
-
Proteomics for discovery of candidate colorectal cancer biomarkers.World J Gastroenterol. 2014 Apr 14;20(14):3804-24. doi: 10.3748/wjg.v20.i14.3804. World J Gastroenterol. 2014. PMID: 24744574 Free PMC article. Review.
Cited by
-
A New Prognostic Risk Model Based on PPAR Pathway-Related Genes in Kidney Renal Clear Cell Carcinoma.PPAR Res. 2020 Sep 22;2020:6937475. doi: 10.1155/2020/6937475. eCollection 2020. PPAR Res. 2020. PMID: 33029112 Free PMC article.
-
Aberrant Expression of Peroxisome Proliferator-Activated Receptors in Colorectal Cancer and Their Association with Cancer Progression and Prognosis.Gastrointest Tumors. 2020 Apr;7(1-2):11-20. doi: 10.1159/000503995. Epub 2019 Nov 1. Gastrointest Tumors. 2020. PMID: 32399461 Free PMC article.
-
Promoter methylation, transcription, and retrotransposition of LINE-1 in colorectal adenomas and adenocarcinomas.Cancer Cell Int. 2020 Sep 1;20:426. doi: 10.1186/s12935-020-01511-5. eCollection 2020. Cancer Cell Int. 2020. PMID: 32905102 Free PMC article.
-
The Role of Pontin and Reptin in Cellular Physiology and Cancer Etiology.Front Mol Biosci. 2017 Aug 24;4:58. doi: 10.3389/fmolb.2017.00058. eCollection 2017. Front Mol Biosci. 2017. PMID: 28884116 Free PMC article. Review.
-
Long non-coding RNA TINCR as potential biomarker and therapeutic target for cancer.Life Sci. 2020 Sep 15;257:118035. doi: 10.1016/j.lfs.2020.118035. Epub 2020 Jul 2. Life Sci. 2020. PMID: 32622950 Free PMC article. Review.
References
-
- Ahmad, M. , Tuteja, R. , 2013. Plasmodium falciparum RuvB2 translocates in 5'-3' direction, relocalizes during schizont stage and its enzymatic activities are up regulated by RuvB3 of the same complex. Biochim. Biophys. Acta 1834, 2795–2811. - PubMed
-
- Andersson, G. , Wennersten, C. , Gaber, A. , Boman, K. , Nodin, B. , Uhlen, M. , Segersten, U. , Malmstrom, P.U. , Jirstrom, K. , 2014. Reduced expression of ezrin in urothelial bladder cancer signifies more advanced tumours and an impaired survival: validatory study of two independent patient cohorts. BMC Urol. 14, 36 - PMC - PubMed
-
- Belt, E.J. , Fijneman, R.J. , van den Berg, E.G. , Bril, H. , Delis-van Diemen, P.M. , Tijssen, M. , van Essen, H.F. , de Lange-de Klerk, E.S. , Belien, J.A. , Stockmann, H.B. , 2011. Loss of lamin A/C expression in stage II and III colon cancer is associated with disease recurrence. Eur. J. Cancer 47, 1837–1845. - PubMed
MeSH terms
Substances
LinkOut - more resources
Full Text Sources
Other Literature Sources
Medical
Miscellaneous

