. 2016 Aug 8:6:30852.
doi: 10.1038/srep30852.

Targeted alternative splicing of TAF4: a new strategy for cell reprogramming

Affiliations

Targeted alternative splicing of TAF4: a new strategy for cell reprogramming

Jekaterina Kazantseva et al. Sci Rep. .

Abstract

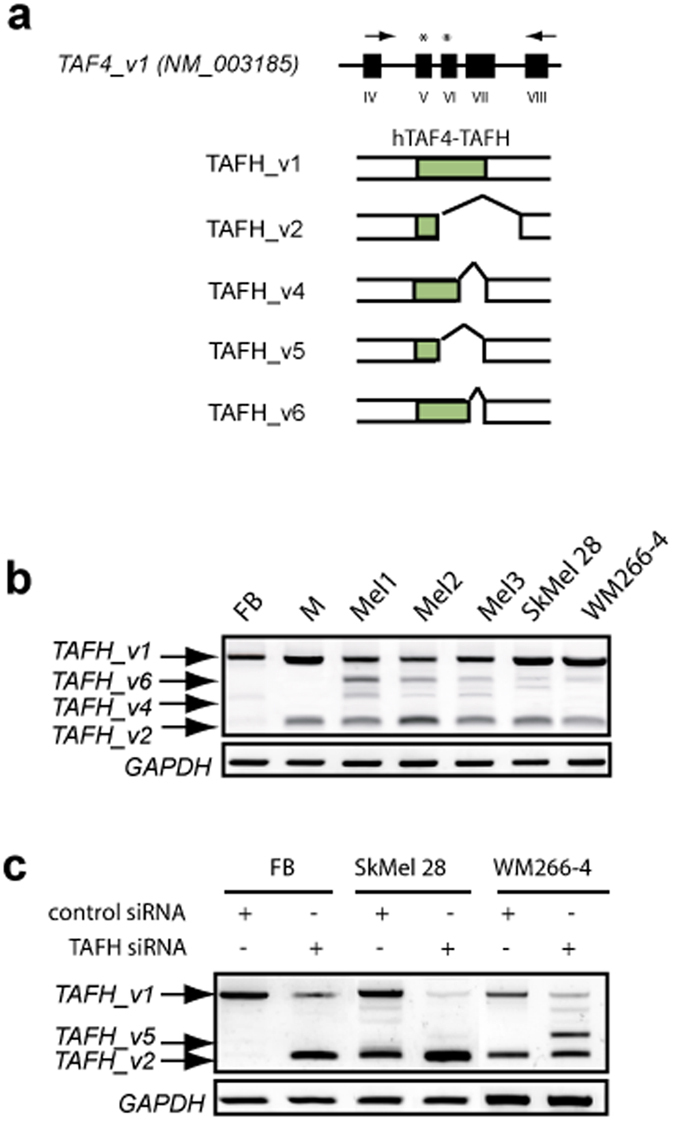
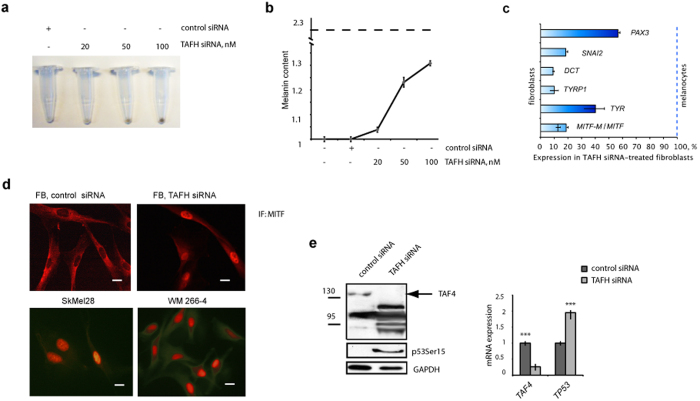
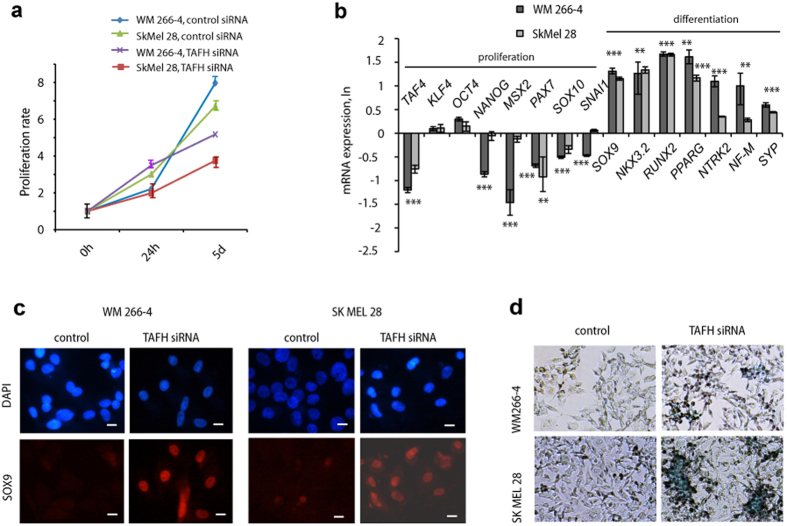
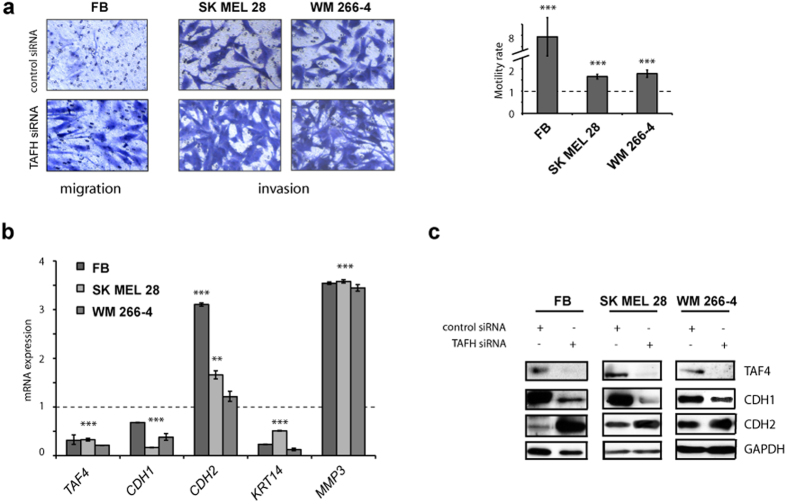
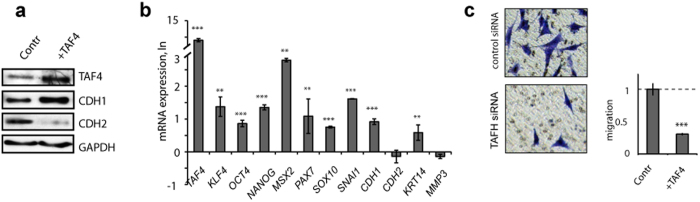
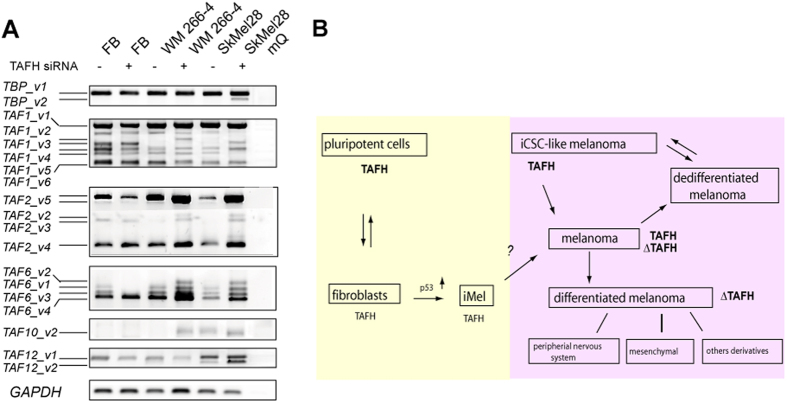
Reprogramming of somatic cells has become a versatile tool for biomedical research and for regenerative medicine. In the current study, we show that manipulating alternative splicing (AS) is a highly potent strategy to produce cells for therapeutic applications. We demonstrate that silencing of hTAF4-TAFH activity of TAF4 converts human facial dermal fibroblasts to melanocyte-like (iMel) cells. iMel cells produce melanin and express microphthalmia-associated transcription factor (MITF) and its target genes at levels comparable to normal melanocytes. Reprogramming of melanoma cells by manipulation with hTAF4-TAFH activity upon TAFH RNAi enforces cell differentiation towards chondrogenic pathway, whereas ectoptic expression of TAF4 results in enhanced multipotency and neural crest-like features in melanoma cells. In both cell states, iMels and cancer cells, hTAF4-TAFH activity controls migration by supporting E- to N-cadherin switches. From our data, we conclude that targeted splicing of hTAF4-TAFH coordinates AS of other TFIID subunits, underscoring the role of TAF4 in synchronised changes of Pol II complex composition essential for efficient cellular reprogramming. Taken together, targeted AS of TAF4 provides a unique strategy for generation of iMels and recapitulating stages of melanoma progression.


Figures

Figure 1
Figure 1. Expression of TAF4 ASVs in human dermal fibroblasts, melanocytes, primary melanoma and immortalised melanoma cells.
(a) Schematic representation of a fragment of TAF4 gene relevant to the current study. Black blocks with numbers indicated below show exons. Arrows indicate the location of TAFH-specific RT-PCR primers and asterisks correspond to the respective TAFH siRNAs. TAF4 isoforms (TAFH_v1, 2, 4, 5, 6) with splicing-affected hTAF4-TAFH domains (in green) are depicted below the gene structure. TAF4 isoforms are referred according to the previously published data. (b) RT-PCR analysis of primary dermal fibroblasts (FB), melanocytes (M), primary melanomas (Mel1-3), and melanoma SkMel28 and WM266-4 cells using TAFH-specific primers. Canonical (TAFH_v1) and major alternative splice variants (TAFH_v2, _v4 and _v6) are indicated. (c) RT-PCR analysis of TAFH (TAF4ex5 and TAF4ex6) siRNA-treated fibroblasts, SkMel28 and WM266-4 melanoma cells showed effective disruption of exons encoding hTAF4-TAFH domain. GAPDH mRNA expression is used as a loading control.
Figure 2
Figure 2. hTAF4-TAFH activity controls conversion of facial dermal fibroblasts to melanocyte-like cells.
(a) Gradual rise in TAFH siRNA concentration from 20 to 100 nM changed the colour of pelleted fibroblasts to dark brown, indicating to the melanin production in these cells upon treatment. (b) Melanin content assay. Fibroblasts were transfected with different amounts of TAFH siRNAs. The relative production of melanin was calculated by measuring cell absorption spectra values at 405 nm in TAFH and control siRNA-treated fibroblasts and normalised to the amount of total protein. For reference control, melanin synthesis was induced by 0.1 mM IBMX (3-isobutyl-1-methylxanthine) in SkMel28 melanoma cells and compared to the value in control siRNA-treated fibroblasts (dashed line). (c) RT-qPCR analysis showed increased expression of melanocyte-specific genes in TAFH siRNA-transfected fibroblasts relatively to the control siRNA-treated cells at 24 h after treatment. Data shown are relatively to the levels of gene expression in terminally differentiated melanocytes, where 0% is the gene expression in primary fibroblasts, and 100% shows the levels of gene expression in primary melanocytes. Data were received from three independent experiments, with p at least < 0.01. (d) Immunofluorescence staining analysis of TAFH or control siRNA-treated fibroblasts at 48 h post-treatment reveals induced expression of MITF in the nuclear compartment of the cells. For positive control, nuclear localisation of MITF expression was verified in SkMel28 and WM266-4 melanoma cells. Scale bar, 40 μm. (e) TAFH siRNA-treatment induced up-regulation of p53 in fibroblasts: phosphorylated p53Ser15 (left) and TP53 mRNAs (right). mRNA data are normalised to GAPDH levels and shown as mean ± SD of three independent experiments with p value < 0.001 (***).
Figure 3
Figure 3. hTAF4-TAFH activity regulates differentiation of melanoma cells.
(a) Data of WST-1 assay of TAFH and control siRNA-treated WM266-4 and SkMel28 cells subjected to 0 h, 24 h and 5 days of proliferation. In WST-1 proliferation assay, the amount of formazan that occurs during the enzymatic cleavage of the tetrazolium salt WST-1 by cellular mitochondrial dehydrogenases present in viable cells, were measured and normalised to the values in day one of proliferation. The data represented as mean ± SD of three independent experiments. (b) RT-qPCR analysis showed that upon TAFH RNAi, the expression of pluripotency-associated (KLF4, OCT4, NANOG) and neural crest (MSX2, PAX7, SOX10, SNAI1) mRNAs were down-regulated or maintained, while the expression of chondrogenic (SOX9, NKX3.2, RUNX2), adipogenic (PPARG) and neuronal (NTRK2, MF-M, SYP) mRNAs were up-regulated in WM266-4 and SkMel28 cells. For differentiation studies, TAFH siRNA-treated for 24 h cells were stimulated to differentiate and analysed at 48 h post-treatment. All data are normalised to GAPDH expression and relatively to the expression in control siRNA-treated cells and represented in LN scale. Mean ± SD values from three independent experiments with statistical significance of ***p < 0.001 and **p < 0.01 are shown. Similar statistical findings are indicated with *** in the middle of neighbouring bars. (c) Immunofluorescence staining of chondrocyte-specific SOX9 (red) in TAFH or control siRNA-treated WM266-4 and SkMel28 melanoma cells stimulated to chondrogenesis is shown at 7 day of differentiation. Nuclei are stained blue with DAPI (4′, 6-diamidino-2-phenylindole). Results are shown at 20× magnification. (d) Alcian blue staining of TAFH or control siRNA-treated WM266-4 and SkMel28 melanoma cells that were stimulated to chondrogenic differentiation for 14 days. Images were taken at 10× magnification.
Figure 4
Figure 4. hTAF4-TAFH activity controls expression of E- and N-cadherins and cell motility of dermal fibroblasts and melanoma cells.
(a) Cell migration and invasion assays showed that TAFH RNAi accelerated the motility of fibroblasts and SkMel28 and WM266-4 melanoma cells. Control and TAFH siRNA-treated cells were grown for 72 h following serum-starvation for 16 h before induction of migration. Migrated towards 10% FBS as a chemoattractant cells were stained with 0.1% crystal violet and photographed (10× magnification). The number of migrated cells was determined by counting from five independent microscopic fields and represented as mean ± SD with ***p < 0.001. (b) Relative expression of indicated genes (TAF4, CDH1, CDH2, KRT14 and MMP3) in dermal fibroblasts and melanoma cells after treatments with TAFH siRNAs as analysed by RT-qPCR and compared to control siRNA treatments. Dashed line shows basal levels of gene expression in control siRNA-treated cells. At least three independent experiments were performed and represented as mean ± SD with **p < 0.01 and ***p < 0.001. (c) Western blot analysis of total protein extracts showed changes in the expression of CDH1 (E-cadherin) and CDH2 (N-cadherin) upon TAFH RNAi as compared with control siRNA-treated cells. Equal loading was confirmed by GAPDH expression.
Figure 5
Figure 5. Effects of enforced expression of TAF4 on invasion and multipotency of melanoma cells.
(a) Western blot analysis of whole cell extracts confirmed the high levels of expression of TAF4 and E-cadherin (CDH1), and low expression of N-cadherin (CDH2) in SkMel28 cells transfected with TAF4 recombinant expression vector at 72 h post-transfection. Equal loading was confirmed by GAPDH expression analysis. (b) RT-qPCR analysis of pluripotency, NC (neural crest) and migration-associated genes upon enforced expression of TAF4 in SkMel28 cells showed that high levels of TAF4 expression support multipotency and inhibit invasion. Data are normalised to GAPDH expression relatively to control plasmid-treated cells and represented in LN scale. At least three independent experiments were performed for each analysis and represented as mean±SD with ***p < 0.001, and **p < 0.01. (c) Cell invasion assays showed that high levels of TAF4 suppress the invasion potential of SkMel28 cells. The number of invaded cells was determined by counting from five independent microscopic fields, normalised to cell numbers that were transfected with control vector (Contr) and represented as mean±SD with ***p<0.001 determined by Student t-test.
Figure 6
Figure 6. hTAF4-TAFH governs AS events of different TFIID subunits and global differentiation and migratory potential of NC-derived cells.
(A) RT-PCR analysis of TBP, TAF1, TAF2, TAF6, TAF10 and TAF12 in response to TAFH RNAi in primary fibroblasts and cultured melanoma WM 266-4 and SkMel28 cells was performed by using transcript-specific primers. Respective ASVs that were sequence verified are denoted on the left and characterised in more detail in Figure S2. (B) High levels of proteins with intact hTAF4-TAFH (TAFH) are inherent to the stem and stem-like cells with low capacity to migrate, while abolished hTAF4-TAFH activity (∆TAFH protein isoforms) is characteristic to highly motile cells committed to differentiate. High levels of expression are shown in bold. Yellow colour indicates to the expression of TAF4 proteins in normal NC-derived cells (facial fibroblasts and melanocytes), whereas purple area relates to melanoma cells. Data of TAFH overexpression in fibroblasts are taken from. Scheme is adapted from. iMel–induced melanocytes; iCSC-like cells—induced cancer stem cell-like cells.

References

    1. Aaronson Y. & Meshorer E. Stem cells: Regulation by alternative splicing. Nature 498, 176–177 (2013). - PubMed
    1. Liu H., He L. & Tang L. Alternative splicing regulation and cell lineage differentiation. Curr Stem Cell Res Ther 7, 400–406 (2012). - PubMed
    1. Chen Y., Zhang L. & Jones K. A. SKIP counteracts p53-mediated apoptosis via selective regulation of p21Cip1 mRNA splicing. Genes Dev 25, 701–716 (2011). - PMC - PubMed
    1. Wilhelm E., Pellay F.-X., Benecke A. & Bell B. TAF6delta controls apoptosis and gene expression in the absence of p53. PLoS One 3, e2721 (2008). - PMC - PubMed
    1. David C. J. & Manley J. L. Alternative pre-mRNA splicing regulation in cancer: pathways and programs unhinged. Genes Dev 24, 2343–2364 (2010). - PMC - PubMed

Publication types

MeSH terms

Substances