. 2016 Sep 1;99(3):647-665.
doi: 10.1016/j.ajhg.2016.07.014. Epub 2016 Aug 4.

The Power of Human Protective Modifiers: PLS3 and CORO1C Unravel Impaired Endocytosis in Spinal Muscular Atrophy and Rescue SMA Phenotype

Affiliations

The Power of Human Protective Modifiers: PLS3 and CORO1C Unravel Impaired Endocytosis in Spinal Muscular Atrophy and Rescue SMA Phenotype

Seyyedmohsen Hosseinibarkooie et al. Am J Hum Genet. .

Abstract

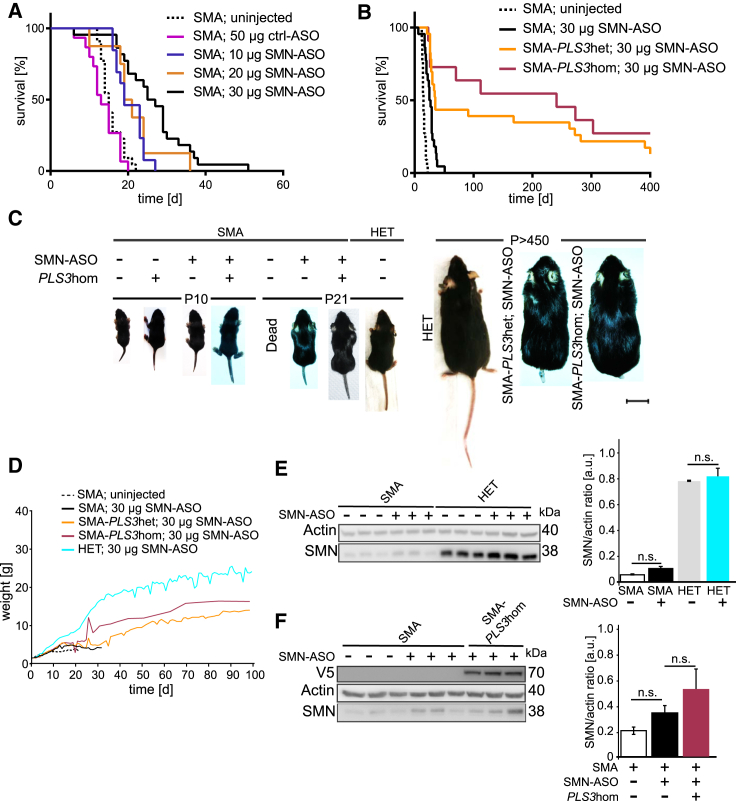
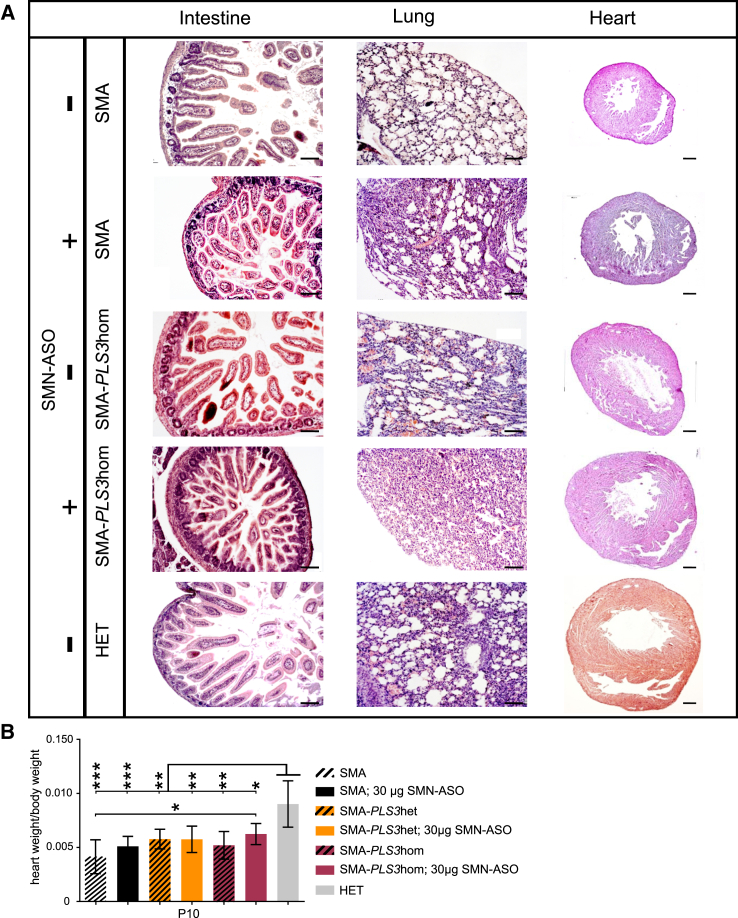
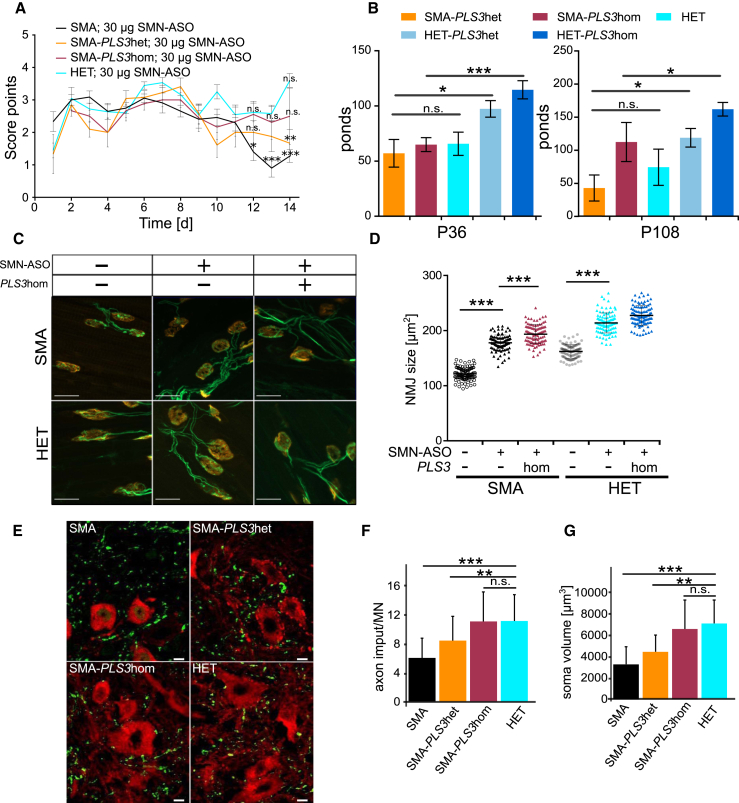
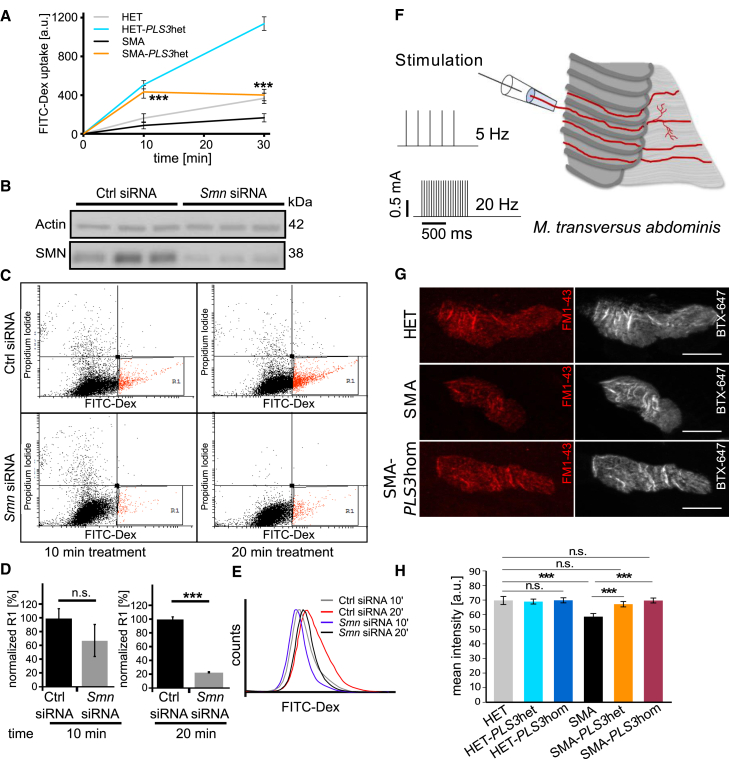
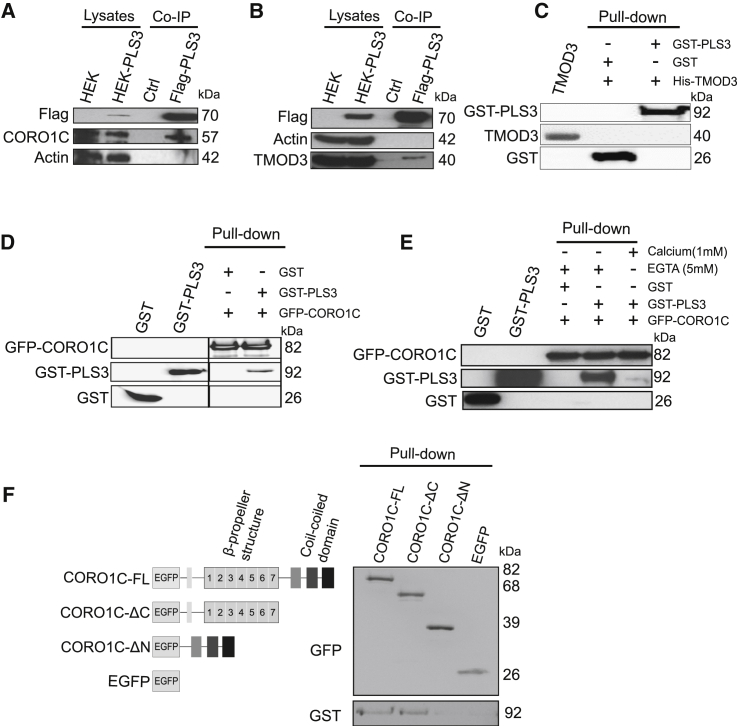
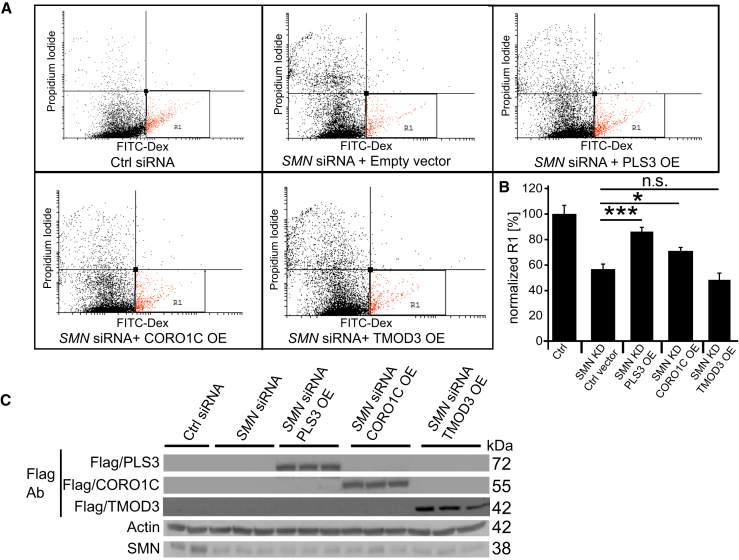
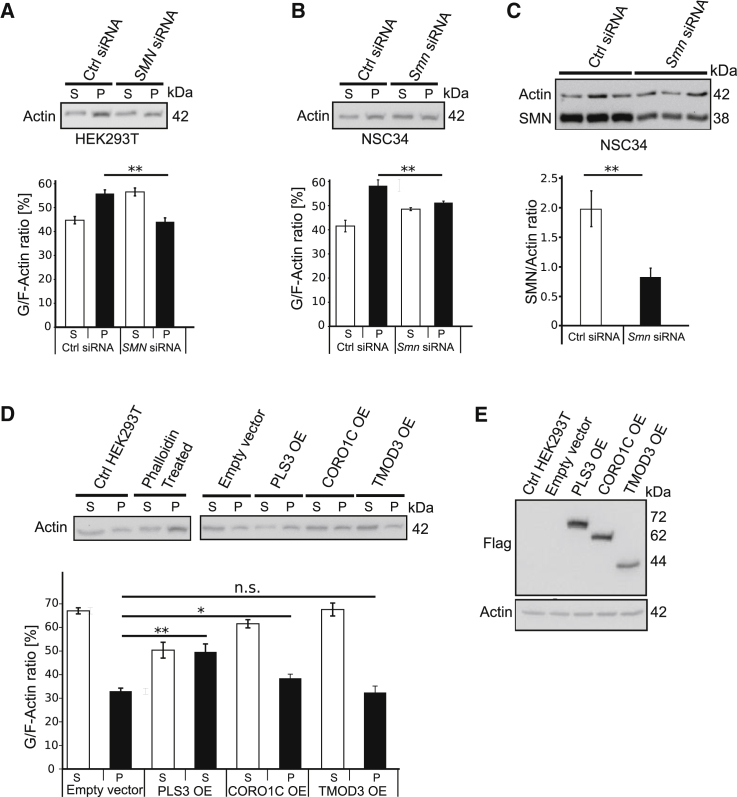
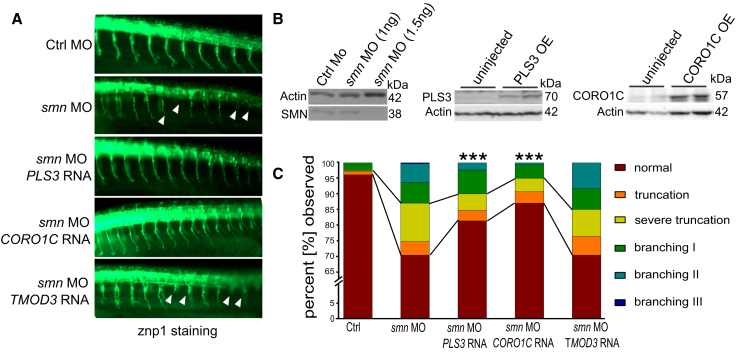
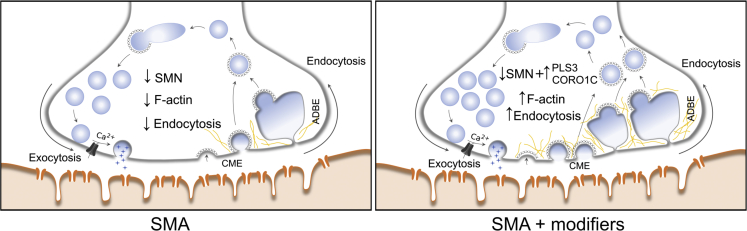
Homozygous loss of SMN1 causes spinal muscular atrophy (SMA), the most common and devastating childhood genetic motor-neuron disease. The copy gene SMN2 produces only ∼10% functional SMN protein, insufficient to counteract development of SMA. In contrast, the human genetic modifier plastin 3 (PLS3), an actin-binding and -bundling protein, fully protects against SMA in SMN1-deleted individuals carrying 3-4 SMN2 copies. Here, we demonstrate that the combinatorial effect of suboptimal SMN antisense oligonucleotide treatment and PLS3 overexpression-a situation resembling the human condition in asymptomatic SMN1-deleted individuals-rescues survival (from 14 to >250 days) and motoric abilities in a severe SMA mouse model. Because PLS3 knockout in yeast impairs endocytosis, we hypothesized that disturbed endocytosis might be a key cellular mechanism underlying impaired neurotransmission and neuromuscular junction maintenance in SMA. Indeed, SMN deficit dramatically reduced endocytosis, which was restored to normal levels by PLS3 overexpression. Upon low-frequency electro-stimulation, endocytotic FM1-43 (SynaptoGreen) uptake in the presynaptic terminal of neuromuscular junctions was restored to control levels in SMA-PLS3 mice. Moreover, proteomics and biochemical analysis revealed CORO1C, another F-actin binding protein, whose direct binding to PLS3 is dependent on calcium. Similar to PLS3 overexpression, CORO1C overexpression restored fluid-phase endocytosis in SMN-knockdown cells by elevating F-actin amounts and rescued the axonal truncation and branching phenotype in Smn-depleted zebrafish. Our findings emphasize the power of genetic modifiers to unravel the cellular pathomechanisms underlying SMA and the power of combinatorial therapy based on splice correction of SMN2 and endocytosis improvement to efficiently treat SMA.


Figures

Figure 1
Figure 1
PLS3 Rescues Survival in an Intermediate SMA Mouse Model (A) Kaplan-Meier curves show the survival rate of SMA mice injected at P2 and P3 with different SMN-ASO doses. Uninjected: 16 ± 2.85 days, n = 22. 50 μg ctrl-ASO: 14 ± 3.89 days, n = 15. 10 μg SMN-ASO: 21 ± 3.95 days, n = 11. 20 μg SMN-ASO. 21 ± 7.37 days, n = 8. 30 μg SMN-ASO: 26 ± 9.48 days, n = 22. (B) Kaplan-Meier curves show the survival rate of PLS3-overexpressing or –non-overexpressing SMA mice treated with 30 μg of SMN-ASO at P2 and P3. PLS3 overexpression drastically increased the survival to 169 ± 176.11 days (n = 23) for SMA-PLS3het and to 219 ± 176.78 days (n = 11) for SMA-PLS3hom in comparison to SMA mice without PLS3 overexpression. A log-rank (Mantel-Cox) test was used. (C) PLS3 overexpression improved phenotypical development in the intermediate SMA mouse model, similar to results for HET mice. The scale bar represents 2 cm. (D) Weight progression of SMA mice in comparison to HET mice (n ≥ 10). (E) Immunoblot analysis of spinal-cord lysates from uninjected and SMN-ASO-treated SMA and HET mice. Note SMN-ASO only very slightly increased the SMN amount (n = 3). (F) Immunoblot of spinal-cord lysates shows that PLS3 overexpression does not induce SMN elevation (n = 3). n.s., non-significant by a two-tailed Student’s t test. Error bars represent SEM.
Figure 2
Figure 2
Low-Dose SMN-ASO Together with PLS3 Overexpression Improves Multi-Organ Dysfunction in the SMA Mouse Model (A) Representative pictures of histological sections from intestine, lung, and heart (P10). Injection of SMN-ASO and PLS3 overexpression improved intestine, lung, and heart phenotypes in SMA mice. An increased number of intact intestinal villi as well as a better organization of the secretory cells, less emphysema with ruptured alveolar septa, enlarged alveolar spaces in the lung, and an increased heart size can be observed. The scale bar represents 100 μm. (B) An accumulative effect on the heart size was observed in SMN-ASO-injected SMA mice. The size further increased when PLS3 was overexpressed (n ≥ 3 per genotype). p < 0.05; two-tailed Student’s t test. Error bars represent SEM.
Figure 3
Figure 3
Tube Test, Grip-Strength Test, NMJ Size, and Proprioceptive-Input Measurements Confirm Improvement in the Intermediate SMA Mouse Model upon PLS3 Overexpression (A) Tube test of neonatal SMN-ASO-injected mice (P1–P14). SMA-PLS3het and SMA-PLS3hom mice, but not SMA mice, show an improvement in performance (P12–P14) (n ≥ 10). (B) Grip strength test at P36 and P108 was fully restored in SMA-PLS3hom mice in comparison to HET and HET-PLS3het mice (n ≥ 5). (C) Representative pictures of NMJ stained with SV2 and NF (green) for the neuronal part and bungarotoxin (red) for the postsynaptic part. The scale bar represents 20 μm. (D) Quantification shows that injection of SMN-ASO significantly increased the NMJ size in comparison to that of NMJs of untreated SMA mice at P10. Upon PLS3 overexpression, an accumulated effect of SMN-ASO and PLS3 overexpression was observed at the NMJ level (n = 5 per genotype, 100 NMJs measured per animal). (E) Representative pictures of MN soma (CHAT, red) and proprioceptive input (VGLUT1, green) derived from SMN-ASO-injected mice (P21). The scale bar represents 10 μm. (F and G) Quantification shows that SMN-ASO injection and PLS3 overexpression significantly improved the number of proprioceptive inputs on the MN soma (n ≥ 70). n.s., non-significant; p < 0.05; ∗∗p < 0.01; ∗∗∗p < 0.001, two-tailed Student’s t test. Error bars represent SEM.
Figure 4
Figure 4
PLS3 Overexpression Rescues Impaired Endocytosis in SMN-Depleted NSC34 Cells and at Presynaptic Sites of NMJs in SMA Mice (A) Quantification of FITC-Dex uptake in MEFs was performed via fluorescence-intensity analysis (n = 3 per genotype and time point, 100 cells measured per cell line). The amount of uptake in SMA versus SMA-PLS3het mice was significantly different at 10 and 30 min. (B) Immunoblot analysis shows efficient Smn siRNA-mediated knockdown in NSC34 cells. (C) Representative dot plots showing FITC-Dex uptake in SMN-depleted NSC34 cells at 10 and 20 min (n = 3, 104 cells measured per FACS experiment). (D and E) Quantification of R1 population and histogram plots show a significant reduction in uptake upon SMN downregulation. (F) Experimental setup for stimulation of the N. intercostalis innervating the TVA muscle. (G) Representative pictures of NMJs from HET, SMA, and SMA-PLS3hom muscles. Staining of postsynaptic receptors (BTX-Alexa647, gray) helped to define the area in which FM1-43 uptake (red) at the presynaptic terminals was analyzed (n = 3 per genotype, ∼100 NMJs measured per genotype). The scale bar represents 10 μm. (H) Quantification of the FM1-43 mean intensity at the presynaptic terminals at P10 in TVA muscles without ASO injection under low-frequency stimulation (5 Hz, 1 s). n.s., non-significant; ∗∗∗p < 0.001, two-tailed Student’s t test. Error bars represent SEM.
Figure 5
Figure 5
PLS3 Interacts with CORO1C and TMOD3 in HEK293T Cells, but only CORO1C Directly Interacts with PLS3 (A and B) Immunoblots of co-IP experiments show the interaction of PLS3 with CORO1C (A) and TMOD3 (B). (C) Pull-down experiments with His-TMOD3 and GST-PLS3. Immunoblots probed with GST and TMOD3 antibodies show that PLS3 does not interact directly with TMOD3. (D) Pull-down experiments with EGFP-CORO1C and GST-PLS3 show direct interaction of PLS3 with CORO1C. (E) PLS3-CORO1C interaction is disrupted in the presence of 1 mM Ca+2. (F) Pull-down assay of purified protein domains of CORO1C with GST-PLS3 shows that the interaction of PLS3 and CORO1C is mediated through the N-terminal part of CORO1C.
Figure 6
Figure 6
Overexpression of PLS3 and CORO1C but Not of TMOD3 Improve Endocytosis in SMN-Deficient Cells (A and B) Quantification of the R1-gated population shows that PLS3 and CORO1C significantly increase endocytosis in SMN-deficient HEK293T cells after 20 min treatment. (C) Immunoblots show siRNA-mediated knockdown of SMN and overexpression of PLS3, CORO1C, and TMOD3 in HEK293T cells (n = 5, 104 cells measured per FACS experiment). n.s., non-significant; p < 0.05; ∗∗∗p < 0.001, two-tailed Student’s t test. Error bars represent SEM.
Figure 7
Figure 7
SMN Knockdown Decreases F-actin Amount, which Is Increased by PLS3 and CORO1C but Not TMOD3 (A) Representative immunoblots of in vivo G/F-actin ratio assay in SMN-knockdown HEK293T cells. Blot quantification indicates a reduction (12%) in F-actin amount upon SMN knockdown in HEK293T cells. (B) Knockdown of SMN in murine MN-like NSC34 cells also decreases the amount of F-actin (7%) in comparison to that in control siRNA-treated cells. (C) Immunoblot analysis shows a significant reduction in SMN amount upon Smn siRNA-mediated knockdown in NSC34 cells. (D) An in vivo G/F-actin assay shows that overexpression of PLS3 and CORO1C but not TMOD3 significantly increased the amount of F-actin in comparison to control vector. (E) Immunoblot analysis shows the overexpression (OE) of PLS3, CORO1C, and TMOD3 in HEK293T cells (n = 5). n.s., non-significant; p < 0.05; ∗∗p < 0.01; two-tailed Student’s t test. Error bars represent SEM.
Figure 8
Figure 8
CORO1C Rescues the Motor-Neuron Phenotype in SMN-Depleted Fish (A) Lateral view at 10–12 somites directly posterior to the yolk sac of 34 hpf zebrafish embryos injected with control-MO, smn-MO, smn-MO + PLS3 mRNA, smn-MO + TMOD3 mRNA, and smn-MO + CORO1C mRNA. MN axons in Smn-depleted fish evidence truncation and branching phenotypes when these fish are compared to control-MO fish. (B) Immunoblots show, from left to right, the dose-dependent effect of smn-MO knockdown, overexpression of PLS3, and overexpression of CORO1C. (C) Quantitative analysis of MN axons shows that PLS3 and CORO1C significantly improved the axonal truncation and branching phenotypes in Smn-depleted fish (branching types I, II, and III correspond to mild, intermediate, and severe axonal branching, respectively. Evaluated axons: n ≥ 300). ∗∗∗p < 0.001, Fisher’s exact test.
Figure 9
Figure 9
A Model Presenting the Compensatory Role of PLS3 and CORO1C in the Process of Endocytosis in SMA CME and ADBE stand for clathrin-mediated endocytosis and activity-dependent bulk endocytosis, respectively.

Similar articles

Cited by

References

    1. Pellizzoni L., Kataoka N., Charroux B., Dreyfuss G. A novel function for SMN, the spinal muscular atrophy disease gene product, in pre-mRNA splicing. Cell. 1998;95:615–624. - PubMed
    1. Liu Q., Fischer U., Wang F., Dreyfuss G. The spinal muscular atrophy disease gene product, SMN, and its associated protein SIP1 are in a complex with spliceosomal snRNP proteins. Cell. 1997;90:1013–1021. - PubMed
    1. Schrank B., Götz R., Gunnersen J.M., Ure J.M., Toyka K.V., Smith A.G., Sendtner M. Inactivation of the survival motor neuron gene, a candidate gene for human spinal muscular atrophy, leads to massive cell death in early mouse embryos. Proc. Natl. Acad. Sci. USA. 1997;94:9920–9925. - PMC - PubMed
    1. Lorson C.L., Hahnen E., Androphy E.J., Wirth B. A single nucleotide in the SMN gene regulates splicing and is responsible for spinal muscular atrophy. Proc. Natl. Acad. Sci. USA. 1999;96:6307–6311. - PMC - PubMed
    1. Lefebvre S., Bürglen L., Reboullet S., Clermont O., Burlet P., Viollet L., Benichou B., Cruaud C., Millasseau P., Zeviani M. Identification and characterization of a spinal muscular atrophy-determining gene. Cell. 1995;80:155–165. - PubMed

Publication types

MeSH terms