. 2016 Jul 23:22:847-85.
eCollection 2016.

The cellular and compartmental profile of mouse retinal glycolysis, tricarboxylic acid cycle, oxidative phosphorylation, and ~P transferring kinases

Affiliations

The cellular and compartmental profile of mouse retinal glycolysis, tricarboxylic acid cycle, oxidative phosphorylation, and ~P transferring kinases

Elda M Rueda et al. Mol Vis. .

Abstract

Purpose: The homeostatic regulation of cellular ATP is achieved by the coordinated activity of ATP utilization, synthesis, and buffering. Glucose is the major substrate for ATP synthesis through glycolysis and oxidative phosphorylation (OXPHOS), whereas intermediary metabolism through the tricarboxylic acid (TCA) cycle utilizes non-glucose-derived monocarboxylates, amino acids, and alpha ketoacids to support mitochondrial ATP and GTP synthesis. Cellular ATP is buffered by specialized equilibrium-driven high-energy phosphate (~P) transferring kinases. Our goals were twofold: 1) to characterize the gene expression, protein expression, and activity of key synthesizing and regulating enzymes of energy metabolism in the whole mouse retina, retinal compartments, and/or cells and 2) to provide an integrative analysis of the results related to function.

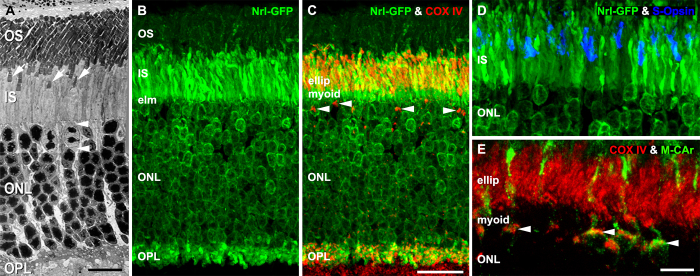
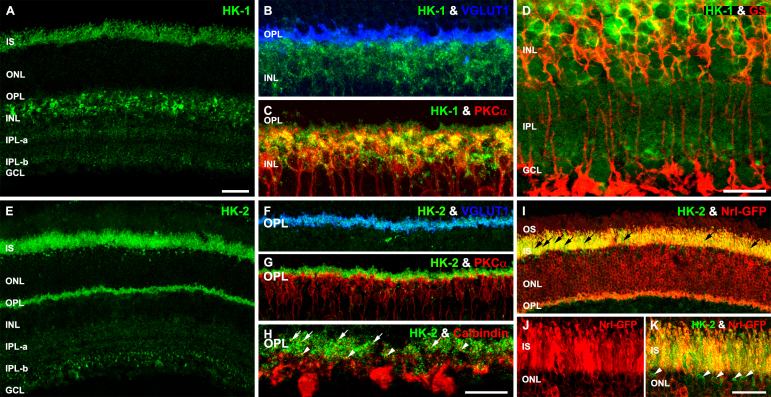
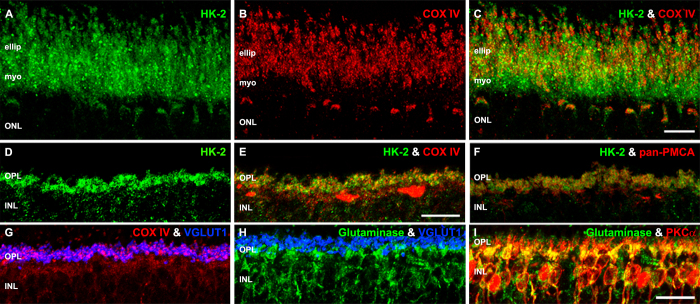
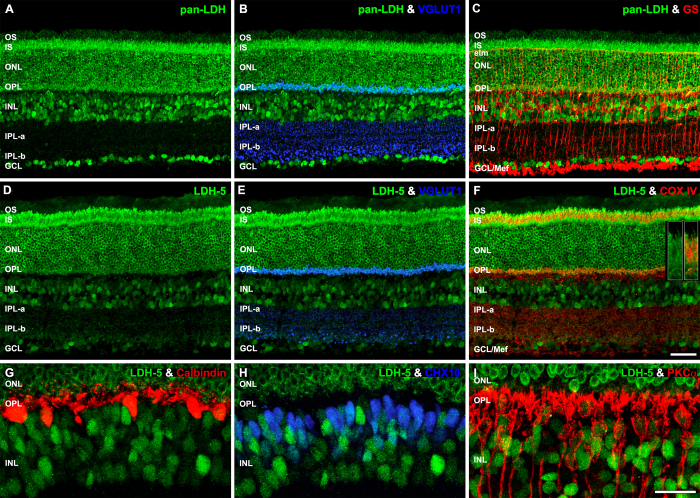
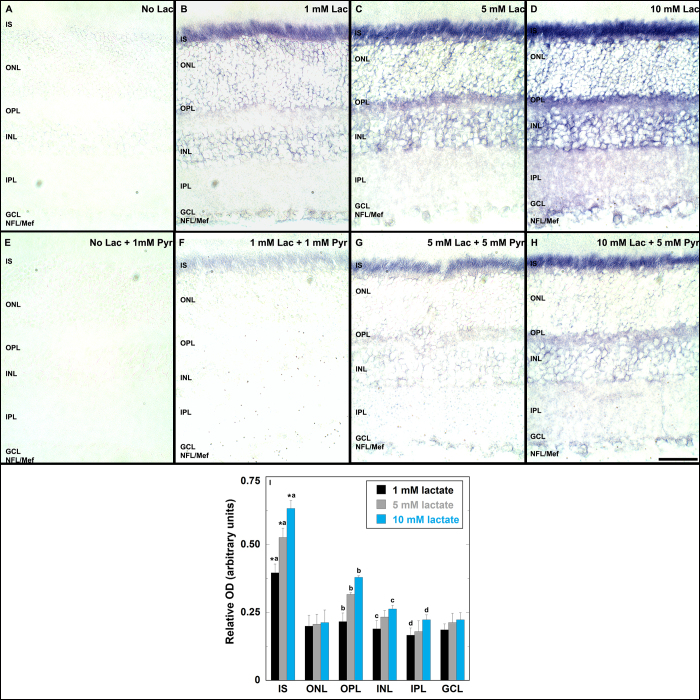
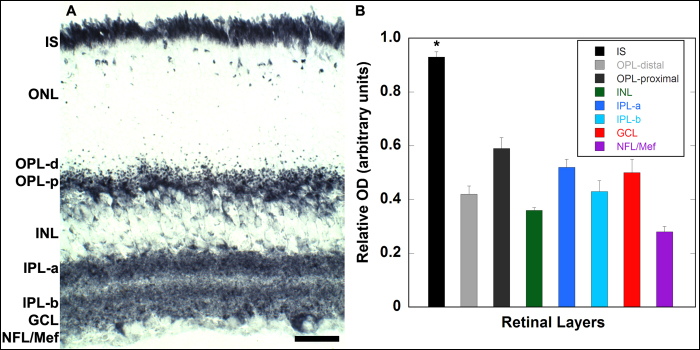
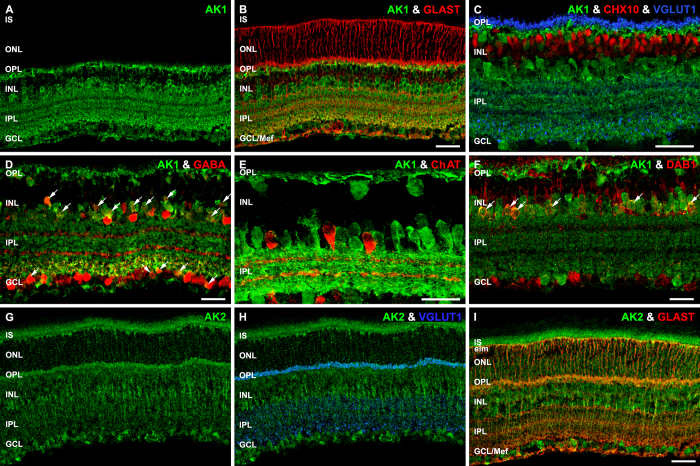
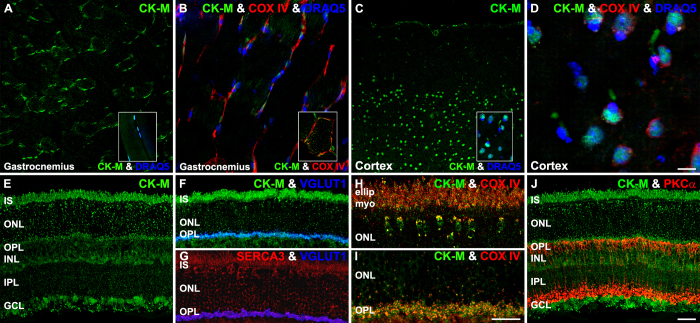
Methods: mRNA expression data of energy-related genes were extracted from our whole retinal Affymetrix microarray data. Fixed-frozen retinas from adult C57BL/6N mice were used for immunohistochemistry, laser scanning confocal microscopy, and enzymatic histochemistry. The immunoreactivity levels of well-characterized antibodies, for all major retinal cells and their compartments, were obtained using our established semiquantitative confocal and imaging techniques. Quantitative cytochrome oxidase (COX) and lactate dehydrogenase (LDH) activity was determined histochemically.

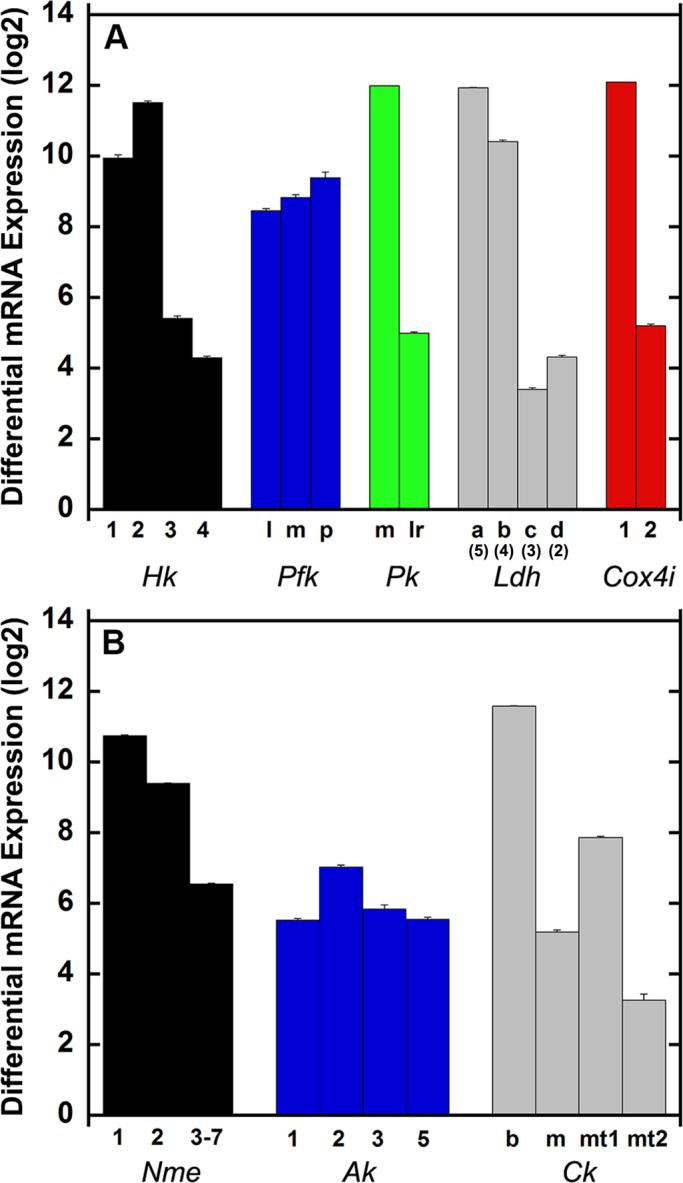
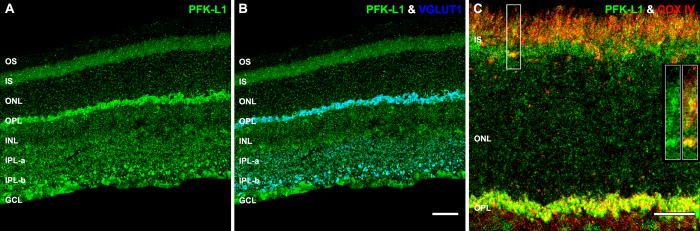
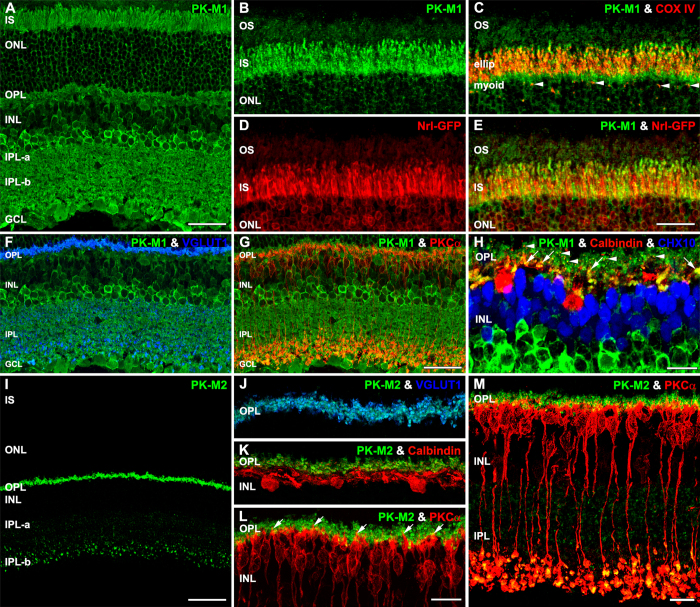
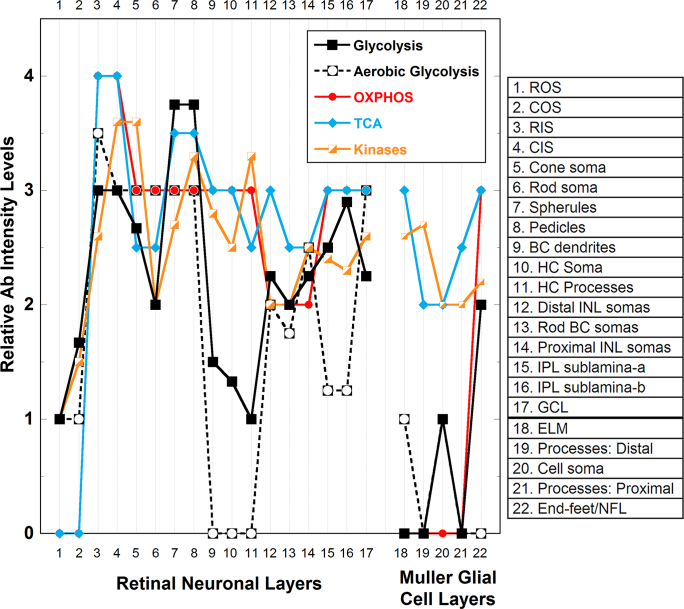
Results: The Affymetrix data revealed varied gene expression patterns of the ATP synthesizing and regulating enzymes found in the muscle, liver, and brain. Confocal studies showed differential cellular and compartmental distribution of isozymes involved in glucose, glutamate, glutamine, lactate, and creatine metabolism. The pattern and intensity of the antibodies and of the COX and LDH activity showed the high capacity of photoreceptors for aerobic glycolysis and OXPHOS. Competition assays with pyruvate revealed that LDH-5 was localized in the photoreceptor inner segments. The combined results indicate that glycolysis is regulated by the compartmental expression of hexokinase 2, pyruvate kinase M1, and pyruvate kinase M2 in photoreceptors, whereas the inner retinal neurons exhibit a lower capacity for glycolysis and aerobic glycolysis. Expression of nucleoside diphosphate kinase, mitochondria-associated adenylate kinase, and several mitochondria-associated creatine kinase isozymes was highest in the outer retina, whereas expression of cytosolic adenylate kinase and brain creatine kinase was higher in the cones, horizontal cells, and amacrine cells indicating the diversity of ATP-buffering strategies among retinal neurons. Based on the antibody intensities and the COX and LDH activity, Müller glial cells (MGCs) had the lowest capacity for glycolysis, aerobic glycolysis, and OXPHOS. However, they showed high expression of glutamate dehydrogenase, alpha-ketoglutarate dehydrogenase, succinate thiokinase, GABA transaminase, and ~P transferring kinases. This suggests that MGCs utilize TCA cycle anaplerosis and cataplerosis to generate GTP and ~P transferring kinases to produce ATP that supports MGC energy requirements.

Conclusions: Our comprehensive and integrated results reveal that the adult mouse retina expresses numerous isoforms of ATP synthesizing, regulating, and buffering genes; expresses differential cellular and compartmental levels of glycolytic, OXPHOS, TCA cycle, and ~P transferring kinase proteins; and exhibits differential layer-by-layer LDH and COX activity. New insights into cell-specific and compartmental ATP and GTP production, as well as utilization and buffering strategies and their relationship with known retinal and cellular functions, are discussed. Developing therapeutic strategies for neuroprotection and treating retinal deficits and degeneration in a cell-specific manner will require such knowledge. This work provides a platform for future research directed at identifying the molecular targets and proteins that regulate these processes.


Figures

Figure 1
Figure 1
Differential mean ± SEM mRNA expression of metabolism-related genes in mature mouse retina. A doubling of the amount of mRNA is considered a twofold change. A: Hk1 and Hk2 showed greater than twofold higher expression when compared to Hk3 and glucokinase (Gk). Isoforms l, m and p of Pfk showed similar levels of expression. Pkm showed greater than twofold higher expression compared to isoforms Pklr. To enhance readability, the protein isoform number appears under the gene name of each Ldh isoform. Ldh isoforms a (LDH-5, skeletal muscle) and b (LDH-1, heart) showed greater than twofold higher expression compared to the isoforms c (LDH-3) and d (LDH-4). Cox4i isoform 1 is expressed greater than twofold higher than Cox4i2. B: Several Nme isoforms are expressed in the retina, with Nme1 and Nme2 showing the highest relative expression. Genes of isoforms 1–3 and 5 of Ak showed similar expression. Ckb showed greater than twofold higher expression compared to Ckm, and CK-mt1 showed greater than twofold higher expression compared to Ck-mt2.
Figure 2
Figure 2
The relative location of the rod and cone outer segments, and myoid and ellipsoid regions of inner segments in the adult mouse retina are presented: electron and confocal microscopy images. Note that the cone OSs are located in the same layer as the rod inner segments (RISs). A: Low-magnification electron micrograph of a longitudinal section of the entire photoreceptor layer. Note the presence of cone OSs in the rod IS layer (white arrows) and the perinuclear mitochondria of the cones (white arrowheads). B: All compartments of the rods in the neural retina leucine zipper–green fluorescent protein (Nrl-GFP) transgenic mouse are fluorescent for GFP. C: Cytochrome oxidase subunit IV (COX IV) immunoreactivity (IR) colocalizes in the mitochondria-rich rod IS ellipsoid region and the OPL of Nrl-GFP transgenic mice (yellow-orange pixels). White arrowheads identify the cone perinuclear mitochondria. D: High-magnification image of Nrl-GFP transgenic mouse retina shows cone S-opsin-IR in the rod IS layer. E: High magnification of a retina double-labeled with COX IV and cone arrestin (M-CAr) shows cones (green pixels) in the rod IS ellipsoid region. White arrowheads identify the colabeled cone perinuclear mitochondria. A, scale bar = 10 μm. B and C, scale bar = 40 μm. D and E, scale bar = 20 μm. ELM = external limiting membrane, ellip = ellipsoid, ISs = inner segments, myo = myoid, ONL = outer nuclear layer, OPL = outer plexiform layer, OSs = outer segments.
Figure 3
Figure 3
Confocal images reveal that two different isozymes of hexokinase, HK-1 and HK-2, have distinct compartmental and laminar distribution in the adult mouse retina. A: The anti-HK-1 antibody selectively and strongly labels the INL. B: High magnification of the OPL from retinas double-labeled for HK-1 and vesicular glutamate transporter 1 (VGLUT1) show no colocalization. C: A high-magnification image of the OPL from retinas double-labeled for HK-1 and protein kinase C alpha (PKCα) shows strong colocalization. D: Retinas double-labeled for HK-1 and glutamine synthetase (GS) show weak colocalization in the MGC somas. E: The anti-HK-2 antibody differentially labels the outer and inner retina. The anti-HK-2 antibody intensely labels the ISs and the OPL. F: A high-magnification image of the OPL double-labeled for HK-2 and VGLUT1 shows colocalization. G: HK-2 and PKCα do not colocalize. H: HK-2 and calbindin colocalize in horizontal cell axonal processes with rod terminals (white arrows) and in dendritic processes with cone terminals (white arrowheads). I: The outer retina of the neural retina leucine zipper–green fluorescent protein (Nrl-GFP) transgenic mice (pseudocolored in red) labeled for HK-2 shows colocalization in the rod IS and spherules (yellow-orange pixels) and HK-2 expression in the cone OSs and ISs (green pixels: black arrows) and pedicles (green pixels). J: High-magnification image of the OS-IS from Nrl-GFP transgenic mice (pseudocolored in red). K: High-magnification image of Nrl-GFP retina colabeled for HK-2 shows colocalization in the rod ISs and spherules (yellow-orange pixels) and localization of HK-2 in the cone OSs and ISs (green pixels) and somas in the ONL (green pixels: white arrowheads). GCL = ganglion cell layer, INL = inner nuclear layer, IPL = inner plexiform layer, IPL-a = IPL sublamina-a, IPL-b = sublamina-b, ISs = inner segments, ONL = outer nuclear layer, OPL = outer plexiform layer, OSs = outer segments. A, D, E, and I, scale bar = 40 µm. B–C and F–H, scale bar = 20 µm. J and K, the scale bar = 10 μm.
Figure 4
Figure 4
Confocal images reveal that photoreceptors intensely express HK-2 in the IS and the ONL compartments with mitochondria. AC: High magnification images of the IS ellipsoid and myoid regions and the distal ONL immunolabeled for (A) HK-2, (B) COX IV, and (C) HK-2 and COX IV. Colocalization in the ellipsoids of the rods and cones and in the cone perinuclear mitochondria (white arrowheads) is visible (yellow-orange pixels). DF: High-magnification images of the OPL immunolabeled for (D) HK-2, (E) HK-2 and COX IV, and (F) HK-2 and pan-plasma membrane Ca2+ ATPase (pan-PMCA). Colocalization is visible in the rod spherules (yellow-orange pixels) and the larger cone pedicles (green pixels: white arrows). High-magnification images of the OPL immunolabeled for (G) COX IV and VGLUT1, (H) GLS and VGLUT1, (I) and GLS and PKCα. Colocalization of GLS and PKCα is visible in the dendrites and somas of the rod bipolar cells (yellow-orange pixels). COX IV = cytochrome c oxidase subunit IV, ellip = ellipsoid, INL = inner nuclear layer, ISs = inner segments, myo = myoid, ONL = outer nuclear layer , OPL = outer plexiform layer, GLS = glutaminase, PKCα = protein kinase C α , VGLUT1 = vesicular glutamate transporter 1. A–C, scale bar = 10 µm. D–G, scale bar = 20 µm. H and I, scale bar = 40 µm.
Figure 5
Figure 5
Confocal images reveal that PFK-L1 is expressed in all retinal cells and synapses. A: Retina immunolabeled for phosphofructokinase isoform L1 (PFK-L1). B: Retinas double-labeled for PFK-L1 and VGLUT1 show colocalization in the OPL and the IPL (aquamarine pixels). C: Retinas double-labeled for PFK-L1 and COX IV show intense colocalization in the IS and the OPL regions. High-magnification insets of highlighted cone shows single- and double-labeled colocalization in the OS, IS, and ONL of the perinuclear mitochondrion. COX IV = cytochrome c oxidase subunit IV, ISs = inner segments, IPL = inner plexiform layer, IPL-a = IPL sublamina-a, IPL-b = sublamina-b, ONL = outer nuclear layer, OPL = outer plexiform layer, OSs = outer segments, VGLUT1 = vesicular glutamate transporter 1. A and B, scale bar = 40 µm. C, scale bar = 20 µm.
Figure 6
Figure 6
Confocal images show that two functionally distinct isozymes of pyruvate kinase M (PK-M1 and PK-M2) are differentially expressed throughout the adult retina. A: PK-M1 is expressed in all retinal neurons and synapses. B: High-magnification image of the outer retina immunolabeled for PK-M1. C: PK-M1 and COX IV colocalize (yellow-orange pixels) in the rod and cone IS and in cone perinuclear mitochondria (white arrowheads). D: High-magnification image of the outer retina from neural retina leucine zipper–green fluorescent protein (Nrl-GFP) transgenic mice (pseudocolored in red). E: PK-M1 is expressed in the rods (yellow-orange pixels: colabeled with Nrl-GFP) and cones (green only pixels). F: PK-M1 and VGLUT1 colocalized in the OPL and the IPL (aquamarine pixels). G: PK-M1 weakly colocalized in PKCα-IR rod bipolar cell dendrites and somas but colocalized in the rod bipolar cell axon terminals in the IPL-b (yellow-orange pixels). H: Retina triple-labeled for PK-M1, calbindin, and CHX10. PK-M1 and calbindin colocalize in horizontal cell axons in the rods (white arrowheads) and in dendrites in the cones (white arrows) but minimally in the somas. CHX10-IR bipolar cells weakly express PK-M1. I: PK-M2 is expressed in the OPL and the IPL. J: High-magnification image shows colocalization of PK-M2 and VGLUT1 throughout the OPL. K: High-magnification image only shows weak colocalization of PK-M2 and calbindin in horizontal cell processes. L: High-magnification image shows colocalization of PK-M2 and PKCα in the rod bipolar cell dendrites (yellow pixels: white arrows). L: High magnification of the OPL of a retina double-labeled for PK-M2 and VGLUT1. M: PK-M2 colocalized in the PKCα-IR rod bipolar cell dendrites and axon terminals (yellow-orange pixels) but not in the somas. COX IV = cytochrome c oxidase subunit IV, IPL = inner plexiform layer, IPL-a = IPL sublamina-a, IPL-b = sublamina-b, ISs = inner segments, ONL = outer nuclear layer, OPL = outer plexiform layer, OSs = outer segments, PKCα-IR = protein kinase C α immunoreactivity, VGLUT1 = vesicular glutamate transporter 1. A, F–G, and I, scale bars = 40 µm. B–E, H, and J–M, scale bars = 20 µm.
Figure 7
Figure 7
Confocal images show that pan-LDH and LDH isozyme 5 (LDH-5: liver and muscle type) are expressed in almost all retinal cells and synapses. A: Retina immunolabeled for pan-LDH. B: Retinas double-labeled for pan-LDH and VGLUT1 show colocalization in the OPL and the IPL (aquamarine pixels). C: Retinas double-labeled for pan-LDH and glutamine synthetase (GS) show weak colocalization in the MGC somas and ELM. D: Retina immunolabeled for LDH-5. E: Retinas double-labeled for LDH-5 and VGLUT1 show colocalization in the OPL and the IPL (aquamarine pixels). F: Retinas double-labeled for LDH-5 and COX IV show collocation in the ISs, OPL, and IPL. Inset: Single and double-labeled cone ISs from a high-magnification image revealing colocalization in the ISs. G: High-magnification image of a retina double-labeled for LDH-5 and calbindin shows no colocalization. H: High-magnification image of a retina double-labeled for LDH-5 and CHX10 reveals differential colocalization. I: High-magnification image of a retina double-labeled for LDH-5 and PKCα shows colocalization in the somas but not in the dendrites. COX IV = cytochrome c oxidase subunit IV, ELM = external limiting membrane, IPL = inner plexiform layer, IPL-a = IPL sublamina-a, IPL-b = IPL sublamina-b, ISs = inner segments, LDH = lactate dehydrogenase, MGC = Müller glial cell, ONL = outer nuclear layer, OPL = outer plexiform layer, OSs = outer segments, PKCα-IR = protein kinase C α immunoreactivity, VGLUT1 = vesicular glutamate transporter 1. A–F, scale bar = 40 µm. G–I, scale bar = 20 µm.
Figure 8
Figure 8
LDH histochemistry of the light-adapted mouse retina. Different concentrations of sodium DL-lactate showed selective activity of lactate dehydrogenase (LDH) in the ISs. A: Retinas incubated in the absence of the sodium DL-lactate. No LDH reactivity is observed. B: Retinas incubated with 1 mM sodium DL-lactate show LDH activity in the IS. C: Retinas incubated in 5 mM sodium DL-lactate show high LDH activity in the ISs and low LDH activity in the OPL. D: Retinas incubated in 10 mM sodium DL-lactate show intense LDH activity in the IS and strong LDH activity in the OPL, INL, and GCL. E: Retinas incubated in the absence of sodium DL-lactate and 1 mM sodium pyruvate. F and G: Retinas incubated with equimolar concentrations of sodium DL-lactate and sodium pyruvate show selective LDH activity in the ISs. H: Retinas incubated with 10 mM sodium DL-lactate and 5 mM sodium pyruvate show reduced activity of LDH in most retinal layers except the ISs. I: LDH activity in different retinal layers presented as mean ± SEM of relative optical density. The LDH activity in ISs was significantly greater at each concentration of lactate relative to the other retinal layers as indicated by asterisks (p<0.05). Bars for each retinal layer that share the same letter (a, b, c, or d) exhibit significant concentration-dependent increases in LDH activity with increasing concentration of lactate (p<0.05). GCL = ganglion cell layer, INL = inner nuclear layer, IPL = inner plexiform layer, ISs = inner segments, NFL = nerve fiber layer, ONL = outer nuclear layer, OPL = outer plexiform layer. Scale bar = 20 μm.
Figure 9
Figure 9
COX activity in the light-adapted mouse retina is compartmentalized. A: The y-axis shows the retinal layers. There was no detectable cytochrome oxidase (COX) activity in the photoreceptor OSs. COX activity was strongest in the photoreceptor ISs, OPL, and outermost region of the INL. Moderate reactivity is localized in the proximal INL. The IPL-a is more reactive compared to the IPL-b. The GCL shows strong COX reactivity localized to the mitochondria near the somas and is more reactive in some retinal ganglion cells than others. The NFL/MGC end-feet was less reactive compared to the rest of the reactive layers. B: COX activity in different retinal layers presented as mean ± SEM of relative optical density. The COX activity in ISs is significantly greater than that in all other retinal layers as indicated by asterisk (p<0.05). GCL = ganglion cell layer, INL = inner nuclear layer, IPL-a = IPL sublamina-a, IPL-b = IPL sublamina-b, ISs = inner segments, MGC = Müller glial cell, NFL = nerve fiber layer, ONL = outer nuclear layer, OPL = outer plexiform layer, OSs = outer segments. A, scale bar = 20 μM.
Figure 10
Figure 10
Confocal images reveal a unique metabolic signature of Müller cell mitochondria. A: Retinas immunolabeled for glutamate dehydrogenase 1 (GDH1) reveal intense expression in rod and cone ISs and synaptic terminals, and a strong to intense in the ELM, IPL, GCL, and MGC end-feet. The expression in the ONL is punctate and strong to intense. B: Strong to intense colocalization of GDH1-IR and glial high-affinity glutamate-aspartate transporter (GLAST-IR) is seen throughout the MGCs. C: Retinas immunolabeled for GABA-transaminase (GABA-T) reveal an intense expression in rod and cone ISs and synaptic terminals, and a strong to intense in the ELM, IPL, GCL, and MGC end-feet. The expression in the ONL is punctate and strong to intense. D: Strong to intense colocalization of GABA-T-IR and GLAST-IR is seen throughout the MGCs. E: Retinas immunolabeled for the lipoamide subunit of the 2-oxoglutarate (α-ketoglutarate) dehydrogenase complex (OGDH) reveal intense expression in the rod and cone IS and synaptic terminals and a strong to intense in the ELM, IPL, GCL, and MGC end-feet. The expression in the ONL is punctate and strong to intense. F: OGDH-IR and GLAST colocalization is strong in the ELM and end-feet, and moderate distal and proximal processes, OPL, and somas. G: Retinas immunolabeled for succinate thiokinase (STK) reveal intense expression in the rod and cone ISs and synaptic terminals and strong to intense expression in the ELM, IPL, GCL, and MGC end-feet. The expression in the ONL is moderate and more like that of COX IV-IR (Figure 4, Figure 5, and Figure 7). H: STKH-IR and GLAST colocalization is strong in the ELM, proximal processes, and end-feet and moderate in the distal processes, OPL, and somas. COX IV-IR = cytochrome oxidase IV immunoreactivity, ELM = external limiting membrane, GCL = ganglion cell layer, INL = inner nuclear layer, IPL = inner plexiform layer, ISs = inner segments, MGC = Müller glial cell, NFL = nerve fiber layer, ONL = outer nuclear layer. A–H, scale bars = 40 µm.
Figure 11
Figure 11
Confocal images show that NDPK is widely expressed throughout the retina. A: Retina immunolabeled for nucleoside diphosphate kinase isoform A (NDPK). B: Retinas double-labeled for NDPK and the glial high-affinity glutamate-aspartate transporter (GLAST) show colocalization in all MGC regions: the ELM, distal and proximal processes, soma, and end-feet (yellow-orange pixels). C: A higher-magnification image shows colocalization of NDPK and GS in the distal and proximal MGC processes (yellow-orange pixels). D: A high-magnification image of a retina double-labeled for NDPK and VGLUT1 reveals greater colocalization in the OPL than in the IPL (aquamarine pixels). COX IV-IR = cytochrome oxidase IV immunoreactivity, ELM = external limiting membrane, GCL = ganglion cell layer, GS = glutamine synthetase, INL = inner nuclear layer, IPL = inner plexiform layer, IPL-a = IPL sublamina-a, IPL-b = IPL sublamina-b, ISs = inner segments, MGC = Müller glial cell, ONL = outer nuclear layer, OPL = outer plexiform layer, VGLUT1 = vesicular glutamate transporter 1. A and B, scale bar = 40 µm. C and D, scale bar = 20 µm.
Figure 12
Figure 12
Confocal images show that two functionally distinct isozymes of adenylate kinase (AK1 and AK2) are differentially expressed throughout the retina. A: AK1 is selectively expressed in the inner retina. B: Retinas double-labeled for AK1 and GLAST show no colocalization. C: A high-magnification image of the retina reveals that AK1 does not colocalize with either CHX10 or VGLUT1. DF: High magnification images of the inner retina double-labeled for AK1 and three antibodies for different types of amacrine cells. D: AK1 and GABA colocalize in weakly GABAergic-IR cells in the INL and the GCL (white arrows). E: AK1 and ChAT do not colocalize in cholinergic amacrine cells or the two cholinergic strata in the IPL. F: AK1 and disabled 1 (DAB1) colocalize in distal amacrine cells (white arrows). G: Retina immunolabeled for AK2. H: Retinas double-labeled for AK2 and VGLUT1 show colocalization in the OPL and the IPL (aquamarine pixels). I: Retinas double-labeled for AK2 and GLAST show extensive colocalization (yellow-orange pixels). ChAT = choline acetyltransferase, GCL = ganglion cell layer, GLAST = glutamate-aspartate transporter, INL = inner nuclear layer, IPL = inner plexiform layer, ISs = inner segments, ONL = outer nuclear layer, OPL = outer plexiform layer, VGLUT1 = vesicular glutamate transporter 1. A, B, D, and F–I, scale bar = 40 µm. C, scale bar = 20 µm. E, scale bar = 20 µm.
Figure 13
Figure 13
Confocal images reveal that the brain-type CK-B is differentially expressed throughout the retina. A: Retinas immunolabeled for creatine kinase isozyme (CK-B) show that the cone ISs (white arrows) and cytoplasm of the cone somas in the distal ONL (white arrowheads) are intensely labeled. B and C: Retinas of neural retina leucine zipper-green fluorescent protein (Nrl-GFP) transgenic mice pseudocolored in red (B) that were (C) double-labeled for CK-B show that rods minimally express CK-B, while the CK-B-IR cone ISs are visible (white arrows). Insert: Higher-magnification image of CK-B-IR. D: Retinas double-labeled for CK-B and VGLUT1 reveal colocalization in the OPL (aquamarine pixels). The high-magnification inset shows colocalization in the presynaptic terminal of a cone pedicle. E and F: High-magnification images of the OPL (E) single-labeled for calbindin, which selectively labels horizontal cells and their processes, and (F) double-labeled for CK-B and calbindin, which colocalized in the horizontal cell dendrites of cone pedicles (white arrows: yellow-orange pixels) and horizontal cell axon terminals in the rod spherules (inside white stroked circles: pairs of yellow-orange pixels). G and H: Retinas double-labeled for CK-B and PKCα and/or triple-labeled with VGLUT1 reveal colocalization of CK-B in rod spherules located in the distal OPL (yellow-orange pixels). I and J: Retinas double-labeled for CK-B either (I) GLAST or (J) GS show colocalization in the ELM, in close apposition to cone axons in the ONL and MGC end-feet. ELM = external limiting membrane, GCL = ganglion cell layer, GLAST = glutamate-aspartate transporter, GS = glutamine synthetase, INL = inner nuclear layer, IPL = inner plexiform layer, ISs = inner segments, MGC = Müller glial cell, ONL = outer nuclear layer, OPL = outer plexiform layer, PKCα = protein kinase C α, VGLUT1 = vesicular glutamate transporter 1. A, B, D, and I, scale bar = 40 µm. C, scale bar = 30 µm. E–H and J, scale bar = 20 µm.
Figure 14
Figure 14
Confocal images show selective expression of the ubiquitous mi-CK in mouse retina. A: Retinas immunolabeled for mitochondrial creatine kinase (mi-CK) show that the ISs, distal ONL, OPL, GCL, and NFL/MGC end-feet are labeled. B: Retinas double-label with mi-CK and GS show moderate mi-CK-IR in the MGC end-feet. C: Retinas double-labeled with mi-CK and COX IV show that the cone ISs and the perinuclear mitochondria of cone somas in the distal ONL are intensely labeled while rod inner segments (RISs) and spherules show weak to moderate mi-CK-IR. COX IV = cytochrome c oxidase subunit IV, GCL = ganglion cell layer, GS = glutamine synthetase, IPL = inner plexiform layer, ISs = inner segments, MGC = Müller glial cell, NFL = nerve fiber layer, ONL = outer nuclear layer, OPL = outer plexiform layer. A and B, scale bar = 40 µm. C, scale bar = 20 µm.
Figure 15
Figure 15
Confocal images illustrate that the creatine kinase isozyme found in muscle and the brain (CK-M) is distributed in cellular regions of the retina where endoplasmic reticulum proteins are located. A: A transverse section of mouse gastrocnemius immunolabeled for CK-M. The inset shows a longitudinal section of the gastrocnemius immunolabeled for CK-M and stained with the nuclear dye DRAQ5. B: A longitudinal section of gastrocnemius triple-labeled for CK-M, COX IV, and DRAQ5. The inset shows a high-magnification image of a transverse section of the gastrocnemius double-labeled for CK-M and COX IV. C: A sagittal section of the mouse frontal cortex immunolabeled for CK-M. The inset shows a high magnification image of cortical cells labeled for CK-M and stained with DRAQ5. D: A higher magnification image of frontal cortex triple-labeled for CK-M, COX IV, and DRAQ5. E: Retina immunolabeled for CK-M. F: Outer retina double-labeled for CK-M and VGLUT1. G: Outer retina double-labeled for SERCA3 and VGLUT1. H and I: High-magnification images of the outer retina double-labeled for CK-M and COX IV. J: Retina double-labeled for CK-M and PKCα. COX IV = cytochrome c oxidase subunit IV, GCL = ganglion cell layer, INL = inner nuclear layer, IPL = inner plexiform layer, ISs = inner segments, ONL = outer nuclear layer, OPL = outer plexiform layer, PKCα = protein kinase C α, VGLUT1 = vesicular glutamate transporter 1. A–C, E–G and J, scale bar = 40 µm. D, scale bar = 10 µm. H and I, scale bar = 20 µm.
Figure 16
Figure 16
Integrated summary of relative Ab intensity levels obtained from the immunoreactivity of bioenergetic regulating and buffering enzymes in the neuronal and glial compartments of the adult light-adapted C57BL/6N mouse retina. The numbers on the x-axis (from 1 to 22) indicate the specific retinal compartments (see key). The values on the y-axis represent the integrated mean relative intensity values of immunoreactivity levels for enzymes that regulate glycolysis (HK-1, HK-2, PFK-L1, PK-M1, and PK-M2), aerobic glycolysis (pan-LDH and LDH-5), the tricarboxylic acid (TCA) cycle (OGDH and STK), oxidative phosphorylation (OXPHOS; cytochrome c oxidase subunit IV, COX IV), and the ~P transferring kinases (NDPK, AK1, AK2, CK-B, CK-M, and mi-CK) obtained from Appendix 1. Overall, the findings reveal highly compartmentalized and graded expression levels of the different enzymes in the outer compared to the inner retina as well as in the Müller glial cells (MGCs) compared to the neurons. Glycolytic enzymes (solid black squares and line) are higher in the outer retina than in the inner retina, except in the rod and cone outer segments (ROSs; COSs). Specifically, the highest levels (i.e., ≥3 on intensity scale) are in the rod and cone inner segments (RISs; CISs), rod spherules, and cone pedicles where most of the retinal mitochondria are located [7,9]. Enzyme levels are slightly lower (i.e., 2.5–3.0) in the cone somas, the inner plexiform layer (IPL), the IPL sublamina-a, and sublamina-b (IPL-a; IPL-b) and still lower (i.e., 2.0–2.5) in the rod somas, inner nuclear layer (INL) somas, ganglion cell layer (GCL), and MGC end-feet/nerve fiber layer (NFL), and lowest (i.e., 1.0–1.75) in the ROS and COS, bipolar cell (BC) dendrites, horizontal cell (HC) somas and processes, and MGC somas. No glycolytic enzyme immunoreactivity was detected in the MGC external limiting membrane (ELM) or processes. Similar to glycolysis, aerobic glycolysis is higher in the outer retina than in the inner retina, except again for the ROSs and COSs. Compared to the RIS, aerobic glycolysis is just slightly lower in the CISs, rod and cone somas, and spherules and pedicles, as seen with the lactate dehydrogenase (LDH) activity (Figure 8). The BC dendrites, HC somas, and HC process have no apparent aerobic glycolytic capacity. Except amacrine cells in the proximal INL and the GCL, aerobic glycolysis is low (i.e., 1.0–2.0) in the inner retina. Aerobic glycolysis is absent to low (i.e., ≤1.0) throughout the MGCs. OXPHOS capacity is present and relatively high in all outer and inner retinal compartments, except in the ROS and COS (no COX IV or COX activity detected) and the INL somas (i.e., ≤2.0). As the IS showed high expression of GDH1 (Figure 10) and the inner retinal neurons had the highest GLS expression levels (Figure 4), the high OXPHOS capacity in these compartments may be supported by non-glucose derivatives. Except the MGC end-feet/NFL, OXPHOS capacity was not detected in any MGC compartments, consistent with the COX activity (Figure 9) and [9]. In the outer retina, the TCA cycle expression profile essentially mirrors that of OXPHOS. In the inner retina, except in the INL somas, the TCA cycle expression is moderately high (i.e., 2.5 to 3.0) and mirrors that of OXPHOS. The TCA cycle expression profile in MGCs is characterized by moderate to high expression (i.e., 2.5 to 3.0) in the ELM, proximal processes, and end-feet/NFL and lower expression (i.e., 2.0) in the distal process and somas. This is in marked contrast to their expression of enzymes related to glycolysis, aerobic glycolysis, and OXPHOS. MGCs also have a capacity for glutamate and GABA catabolism, as well as GTP production (Figure 10). Together, this suggests that MGCs support their bioenergetics demands using non-glucose derivatives to generate GTP. The ~P transferring kinases were differentially distributed among all compartments of the inner and outer retinal neurons. The ~P transferring kinases were more highly expressed in all cone compartments (CIS, somas, and pedicles, i.e., 3.5) compared to similar rod compartments (i.e., 2.0–2.5). The ~P transferring kinases were also moderately to highly expressed in the BC dendrites, HC somas, and HC processes, compartments that had low glycolytic and/or aerobic glycolytic capacity. In the MGCs, the ~P transferring kinases were moderately expressed in the ELM and distal processes and had lower expression (i.e., ≥2.0) the somas, proximal processes, and end-feet/NFL. As the MGCs lack OXPHOS capacity, except in the end-feet/NFL, the ~P transferring kinases likely convert the GTP produced in the TCA cycle to ATP, as well as buffer the ATP concentration.

Similar articles

Cited by

References

    1. Craig FN, Beecher HK. The effect of low oxygen tension on tissue metabolism (Retina). J Gen Physiol. 1943;26:467–72. - PMC - PubMed
    1. Noell WK. Electrophysiologic study of the retina during metabolic impairment. Am J Ophthalmol. 1952;35:126–33. - PubMed
    1. Winkler BS. Glycolytic and oxidative metabolism in relation to retinal function. J Gen Physiol. 1981;77:667–92. - PMC - PubMed
    1. Lau JC, Linsenmeier RA. Oxygen consumption and distribution in the Long-Evans rat retina. Exp Eye Res. 2012;102:50–8. - PMC - PubMed
    1. Yu DY, Cringle SJ. Oxygen distribution in the mouse retina. Invest Ophthalmol Vis Sci. 2006;47:1109–12. - PubMed

Publication types

MeSH terms

LinkOut - more resources