. 2016 Jul 22:7:1128.
doi: 10.3389/fmicb.2016.01128. eCollection 2016.

Hospital Effluents Are One of Several Sources of Metal, Antibiotic Resistance Genes, and Bacterial Markers Disseminated in Sub-Saharan Urban Rivers

Affiliations

Hospital Effluents Are One of Several Sources of Metal, Antibiotic Resistance Genes, and Bacterial Markers Disseminated in Sub-Saharan Urban Rivers

Amandine Laffite et al. Front Microbiol. .

Abstract

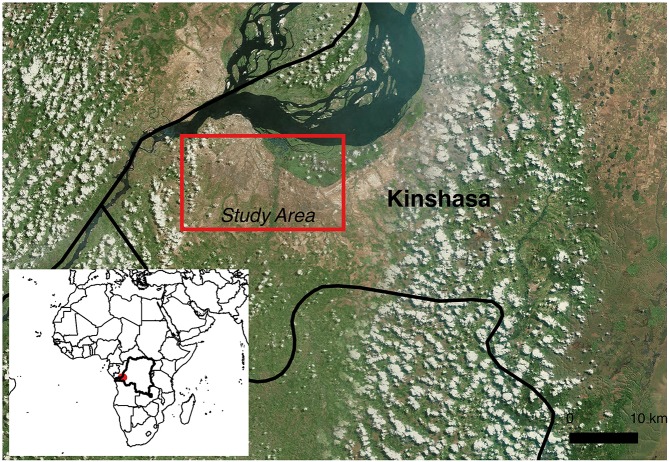
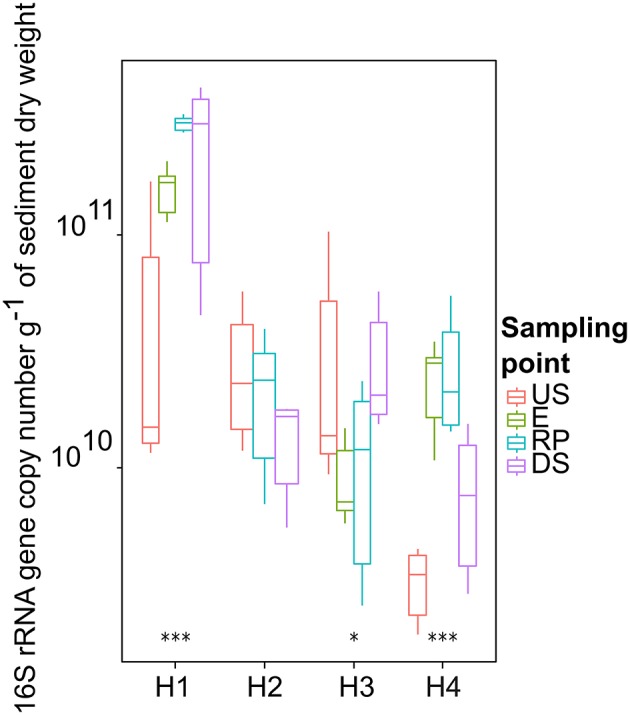
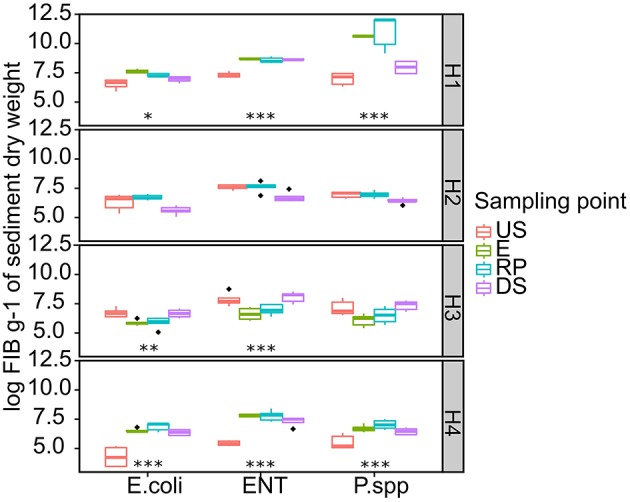
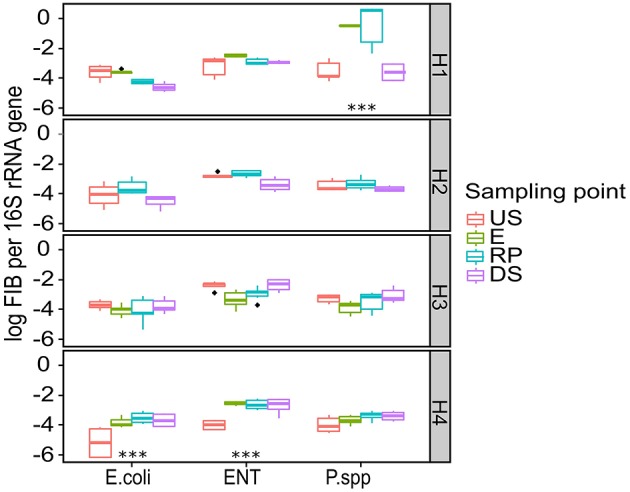
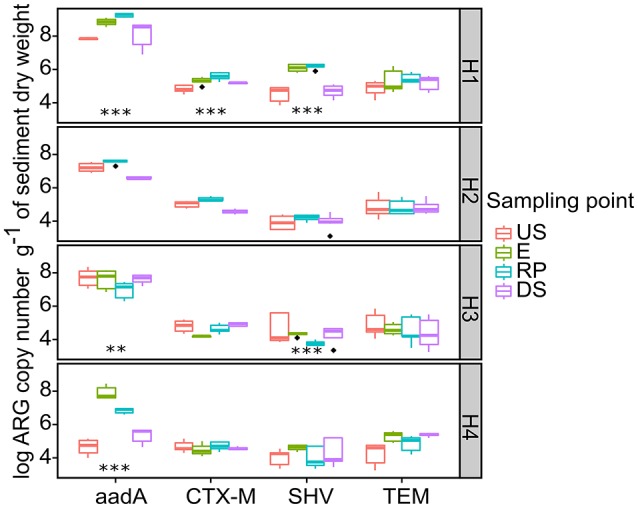
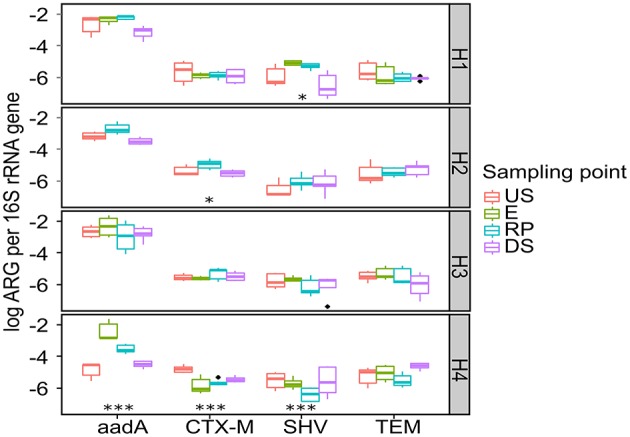
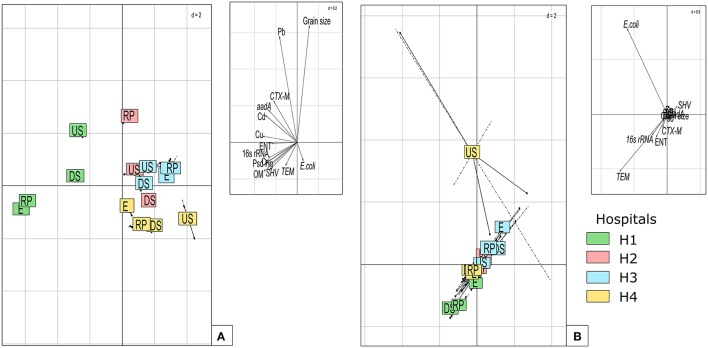
Data concerning the occurrence of emerging biological contaminants such as antibiotic resistance genes (ARGs) and fecal indicator bacteria (FIB) in aquatic environments in Sub-Saharan African countries is limited. On the other hand, antibiotic resistance remains a worldwide problem which may pose serious potential risks to human and animal health. Consequently, there is a growing number of reports concerning the prevalence and dissemination of these contaminants into various environmental compartments. Sediments provide the opportunity to reconstruct the pollution history and evaluate impacts so this study investigates the abundance and distribution of toxic metals, FIB, and ARGs released from hospital effluent wastewaters and their presence in river sediments receiving systems. ARGs (bla TEM, bla CTX-M, bla SHV, and aadA), total bacterial load, and selected bacterial species FIB [Escherichia coli, Enterococcus (ENT)] and species (Psd) were quantified by targeting species specific genes using quantitative PCR (qPCR) in total DNA extracted from the sediments recovered from 4 hospital outlet pipes (HOP) and their river receiving systems in the City of Kinshasa in the Democratic Republic of the Congo. The results highlight the great concentration of toxic metals in HOP, reaching the values (in mg kg(-1)) of 47.9 (Cr), 213.6 (Cu), 1434.4 (Zn), 2.6 (Cd), 281.5 (Pb), and 13.6 (Hg). The results also highlight the highest (P < 0.05) values of 16S rRNA, FIB, and ARGs copy numbers in all sampling sites including upstream (control site), discharge point, and downstream of receiving rivers, indicating that the hospital effluent water is not an exclusive source of the biological contaminants entering the urban rivers. Significant correlation were observed between (i) all analyzed ARGs and total bacterial load (16S rRNA) 0.51 to 0.72 (p < 0.001, n = 65); (ii) ARGs (except bla TEM) and FIB and Psd 0.57 < r < 0.82 (p < 0.001, n = 65); and (iii) ARGs (except bla TEM) and toxic metals (Cd, Cr, Cu, and Zn) 0.44 to 0.72, (p < 0.001, n = 65). These findings demonstrate that several sources including hospital and urban wastewaters contribute to the spread of toxic metals and biological emerging contaminants in aquatic ecosystems.

Keywords: Sub-Saharan Africa; antibiotic resistance genes; fecal indicator bacteria; hospital and urban wastewater; sediment receiving system; toxic metals; tropical conditions; water pollution.


Figures

Figure 1
Figure 1
Localization of the sampling site in the province of Kinshasa, Republic Democratic of Congo (Adapted from Google Maps).
Figure 2
Figure 2
Raw 16S rRNA copy number detected in hospital receiving systems (16S rRNA gene copy number / g of DS) at each sampling point. Significant stars represent significant variation between US and RP point, ***-p < 0.01; and * 0.1> p >0.05. For the pairs not marked the statistical difference between US and RP was statistically insignificant. The line in each box marks the media and boxes: 25th and 75th percentiles; whiskers: 5th and 95th percentiles and outliers ± 1.5*IQ. US, upstream; E, hospital outlet effluent; RP, reject point; DS, downstream.
Figure 3
Figure 3
Raw FIB copy number detected in hospital receiving systems at each sampling point. Significant stars represent significant variation between US and RP point, ***-p < 0.01, ** 0.01> p >0.01 and * 0.1> p >0.05. For the pairs not marked the statistical difference between US and RP was statistically insignificant. The line in each box marks the media and boxes: 25th and 75th percentiles; whiskers: 5th and 95th percentiles and outliers ± 1.5*IQR. US, upstream; E, hospital outlet effluent; RP, reject point; DS, downstream; ENT, Enterococcus; Psd, Pseudomonas species.
Figure 4
Figure 4
Normalized FIB copy number detected in hospital receiving systems at each sampling point. Significant stars represent significant variation between US and RP point, ***-p < 0.01. For the pairs not marked the statistical difference between US and RP was statistically insignificant. The line in each box marks the media and boxes: 25th and 75th percentiles; whiskers: 5th and 95th percentiles and outliers ± 1.5*IQR. US, upstream; E, hospital outlet effluent; RP, reject point; DS, downstream; ENT, Enterococcus; Psd, Pseudomonas species.
Figure 5
Figure 5
Raw ARGs copy number detected in hospital receiving systems at each sampling point. Significant stars represent significant variation between US and RP point, ***-p < 0.01; and ** 0.01> p >0.01. For the pairs not marked the statistical difference between US and RP was statistically insignificant. The line in each box marks the media and boxes: 25th and 75th percentiles; whiskers: 5th and 95th percentiles and outliers ± 1.5*IQR. US, upstream; E, hospital outlet effluent; RP, reject point; DS, downstream.
Figure 6
Figure 6
Normalized ARGs copy number detected in hospital receiving systems at each sampling point. Significant stars represent significant variation between US and RP point, ***-p < 0.01; and * 0.1> p >0.05. For the pairs not marked the statistical difference between US and RP was statistically insignificant. The line in each box marks the media and boxes: 25th and 75th percentiles; whiskers: 5th and 95th percentiles and outliers ± 1.5*IQR. US, upstream; E, hospital outlet effluent; RP, reject point; DS, downstream.
Figure 7
Figure 7
Grouping of each sampling point according to ARGs, FIB, toxic metals, grain size, and OM. (A) plot using between group analyses to discriminate each points in various hospital receiving system. (B) same samples plotted after decomposing differences in each sampling point by within group analysis. Right upper panels show correlation with variables (PCA variable scores).

References

    1. Allen H. K. H., Donato J. J., Wang H. H. H., Cloud Hansen K. A. K., Davies J. J., Handelsman J. J. (2010). Call of the wild: antibiotic resistance genes in natural environments. Nat. Rev. Microbiol. 8, 251–259. 10.1038/nrmicro2312 - DOI - PubMed
    1. Alm E. W., Zimbler D., Callahan E., Plomaritis E. (2014). Patterns and persistence of antibiotic resistance in faecal indicator bacteria from freshwater recreational beaches. J. Appl. Microbiol. 117, 273–285. 10.1111/jam.12512 - DOI - PubMed
    1. Aminov R. I. R. (2011). Horizontal gene exchange in environmental microbiota. Front. Microbiol. 2:158. 10.3389/fmicb.2011.00158 - DOI - PMC - PubMed
    1. Atibu E. K., Devarajan N., Thevenon F., Mwanamoki P. M., Tshibanda J. B., Mpiana P. T., et al. (2013). Concentration of metals in surface water and sediment of Luilu and Musonoie Rivers, Kolwezi-Katanga, Democratic Republic of Congo. Appl. Geochem. 39, 26–32. 10.1016/j.apgeochem.2013.09.021 - DOI
    1. Baker-Austin C., Wright M. S., Stepanauskas R., McArthur J. V. (2006). Co-selection of antibiotic and metal resistance. Trends Microbiol. 14, 176–182. 10.1016/j.tim.2006.02.006 - DOI - PubMed