. 2015 Jun 9;2(3):106-19.
doi: 10.1002/reg2.34. eCollection 2015 Jun.

Epidermal closure regulates histolysis during mammalian (Mus) digit regeneration

Affiliations

Epidermal closure regulates histolysis during mammalian (Mus) digit regeneration

Jennifer Simkin et al. Regeneration (Oxf). .

Abstract

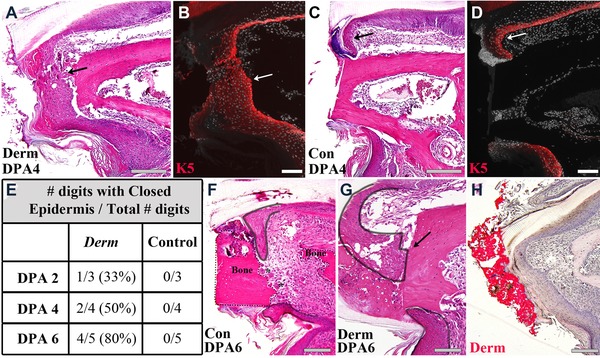
Mammalian digit regeneration progresses through consistent stages: histolysis, inflammation, epidermal closure, blastema formation, and finally redifferentiation. What we do not yet know is how each stage can affect others. Questions of stage timing, tissue interactions, and microenvironmental states are becoming increasingly important as we look toward solutions for whole limb regeneration. This study focuses on the timing of epidermal closure which, in mammals, is delayed compared to more regenerative animals like the axolotl. We use a standard wound closure device, Dermabond (2-octyl cyanoacrylate), to induce earlier epidermal closure, and we evaluate the effect of fast epidermal closure on histolysis, blastema formation, and redifferentiation. We find that fast epidermal closure is reliant upon a hypoxic microenvironment. Additionally, early epidermal closure eliminates the histolysis stage and results in a regenerate that more closely replicates the amputated structure. We show that tools like Dermabond and oxygen are able to independently influence the various stages of regeneration enabling us to uncouple histolysis, wound closure, and other regenerative events. With this study, we start to understand how each stage of mammalian digit regeneration is controlled.

Keywords: Blastema; digit; hypoxia; mouse; regeneration.


Figures

Figure 1
Figure 1
Dermabond treatment promotes epidermal closure following P3 amputation. (A) H&E staining of a Dermabond‐treated digit and (B) keratin 5 expression of a serial section shows the epidermis is closed at DPA 4 and directly touches the distal edge of the bone stump (arrow). (C) H&E staining of a control digit and (D) keratin 5 expression of a serial section shows the epidermis is still open at DPA 4 and a fold forms at the distal edge of the epidermis (arrow). Representative samples are shown. Scale bars: 200 μm in (A), (C), and 100 μm in (B), (D). (E) Timing of complete epidermal wound closure occurs between DPA 2 and DPA 6 in Dermabond‐treated digits and after DPA 6 in all control digits tested. N = 12, control and Dermabond‐treated. (F) Epidermal closure in control digits at DPA 6 transects the bone stump (bone outlined with dotted black line). (G) Epidermal closure in Dermabond‐treated digits at DPA 6 occurs across the distal edge of the bone stump (epidermis outlined in solid black). (H) Oil Red O staining of a Dermabond‐treated digit at DPA 6 identifies the cyanoacrylate (red) and shows that epidermal closure occurs directly under the Dermabond covering. Scale bars 100 μm.
Figure 2
Figure 2
Mallory trichrome stained samples of Dermabond‐treated digits (A, B, D) and control digits (A′, B′, D′) at DPA 3, 6, and 13 show distinct histological differences during the first 13 days of regeneration. (A) Dermabond‐treated digits show the epidermis has started to close prematurely at DPA 3 (black arrow). (A′) Control digits at the same time point have open epidermis and blood filled osteocyte lacunae (white arrowhead). (B) By DPA 6 Dermabond‐treated digits show a collection of cells at the distal tip of the bone stump, and osteoclast resorption pits are noticeably absent. (B′) DPA 6 control digit shows osteoclast resorption pits (asterisks) and the beginning of epidermal wound closure on the ventral side of the digit (black arrow). (C) Immunofluorescent staining for the osteoclast‐specific enzyme cathepsin K (CathK, red) shows the presence of osteoclasts as small cells with single nuclei in Dermabond‐treated digits. (C′) Staining for cathepsin K in control digits shows large multi‐nucleated osteoclasts. Cathepsin K, red; DAPI, grey. (D) Dermabond‐treated digits also show a distal blastema, and new bone growth is observable as ribbons off the original bone stump (black arrow) at DPA 13. (D′) Control digits form a blastema, and new trabecular bone growth is observable by DPA 13 (black arrow). Scale bar: 200 μm in (A), (B), (D), and 100 μm in (C).
Figure 3
Figure 3
Dermabond treatment attenuates bone degradation during regeneration. (A) Dermabond‐treated digits show reduced bone degradation at DPA 7−12 (N = 12 mice, N = 24 digits). Samples were analyzed for bone growth using μCT. Data are normalized to initial DPA 0 bone volume and shown as a percentage. Error bars represent SEM. The initial unamputated (UA) bone volume (green dotted line) averages 125% of the amputated bone volume. 3D renderings of representative samples of Dermabond‐treated (B) and control (C) digits during regeneration illustrate the loss of a degradation stage in Dermabond‐treated digits. (D) The loss of degradation following Dermabond treatment is variable. 45% of digits treated display no loss of bone volume (Derm Group A, n = 11). The other 55% of digits treated are comparable to control digits (Derm Group B, n = 13). (E), (F) Re‐amputation of DPA 28 Dermabond‐treated digits after regeneration show return of the degradation phase during subsequent regeneration events. (E) 3D renderings show a regenerated Dermabond‐treated digit prior to re‐amputation from DPA 1 to DPA 28. (F) Representative X‐ray images of the same digit shows return of bone degradation after re‐amputation and the subsequent regeneration event—DPA 1, 6, 12, and 18. N = 4, Representative sample shown.
Figure 4
Figure 4
Mallory trichrome staining at DPA 10 shows both (A) a control digit and (B) a Dermabond‐treated digit with the blastema area outlined. Dermabond‐treated digits show ribboned bone growth (black arrow). Scale bar 200 μm. (C) Control digits are negative for von Willebrand factor 8 (VWF) staining in the blastema. Positive staining can be seen in the marrow region. Bone stump outlined in white. Scale bar 100 μm. (D) Control blastema shows Ki67 positive cells. (E) Dermabond‐treated digits show the blastema is negative for VWF staining. Red, VWF; grey, nuclei. Bone stump outlined in white. Scale bar 100 μm. (F) High magnification of boxed rectangle in (D) in a serial section of the same Dermabond‐treated digit shows Ki67 staining for proliferation. Red, Ki67; grey, nuclei. (G) Polarized light micrograph of the control sample at DPA 10 shows woven collagen fibers and collagen I and collagen III localization. Col III, green; Col I, red. (H) Polarized light micrograph of DPA 10 Dermabond‐treated sample shows collagen fibers aligned parallel to each other and the presence of collagen III (green) and collagen I (red/yellow). Scale bar 200 μm. Insets show a monochrome version of each picture to better visualize the collagen fiber orientation. (I), (J). H&E staining of DPA 21 samples of (I) a control digit and (J) a Dermabond‐treated digit which shows fewer trabecular spaces and less bone overgrowth than a control digit at the same time point. Scale bars 200 μm.
Figure 5
Figure 5
(A) Oxygen profiling of the epidermis in control and Dermabond‐treated digits using Hypoxyprobe (<1.3% oxygen) indicates relatively hypoxic microenvironments in the epidermis at DPA 3 and 5 in Dermabond‐treated digits. The anti‐Hypoxyprobe stained cells were selected and plotted as cell counts versus DAPI staining. Percentages of cells per total cellular area are shown in the bar graph. # P < 0.05. (B) Analysis of the hypoxic signal in control digits at DPA 3 shows few areas of hypoxia. (C) In comparison Dermabond‐treated digits at DPA 3 show hypoxic epidermis. The dotted outline delineates epidermis and underlying bone or connective tissue. (D) DPA 5 shows a hypoxic epidermis and a migratory phenotype of hypoxic cells (inset). (E) Dermabond‐treated digits show a decrease in hypoxia in the epidermis by DPA 7. N = 5 with representative samples shown. Red, Hypoxyprobe; grey, nuclei; Epi, epidermis; Ct, soft connective tissue. Scale bar 100 μm. (F) H&E staining of a Dermabond‐treated digit at DPA 7 showing complete wound closure. (G) H&E staining of a Dermabond‐treated digit at DPA 7 after daily HBOT treatment showing open epidermis (arrows). N = 3 mice, seven digits with representative sample shown. Scale bar 200 μm. (H) Control, Dermabond‐treated and Derm‐HBOT‐treated samples analyzed for loss of bone volume show that Derm‐HBOT‐treated samples have bone degradation levels comparable to control digits. Digits were tracked with μCT for 21 days and the maximum amount of bone volume lost was quantified. Data are normalized to the initial DPA 0 amputated bone volume. N = 4 mice, 14 digits. Error bars represent SEM.

Similar articles

Cited by

References

    1. Arnett, T.R. (2010). Acidosis, hypoxia and bone. Archives of Bio and Bio, 503, 103–109. - PubMed
    1. Arnett, T.R. , Gibbons, D.C. , Utting, J.C. , Orriss, I.R. , Hoebertz, A. , Rosendaal, M. et al. (2003). Hypoxia is a major stimulator of osteoclast formation and bone resorption. Journal of Cellular Physiology, 196, 2–8. - PubMed
    1. Boraldi, F. , Annovi, G. , Carraro, F. , Naldini, A. , Tiozzo, R. , Sommer, P. , et. al. (2007). Hypoxia influences the cellular cross‐talk of human dermal fibroblasts. A proteomic approach. Biochimica et Biophysica Acta 1774, 1402–13. - PubMed
    1. Borgens, R.B. (1982). Mice regrow the tips of their foretoes. Science, 217, 747–750. - PubMed
    1. Botusan, I.R. , Sunkari, V.G. , Savu, O. , Catrina, A.I. , Grünler, J. , Lindberg, S. et al. (2008). Stabilization of HIF‐1alpha is critical to improve wound healing in diabetic mice. Proceedings of the National Academy of Sciences of the United States of America, 105, 19426–19431. - PMC - PubMed

LinkOut - more resources