. 2001 Feb 1;106(1):65-103.
doi: 10.6028/jres.106.005. Print 2001 Jan-Feb.

The Ampere and Electrical Standards

Affiliations

The Ampere and Electrical Standards

R E Elmquist et al. J Res Natl Inst Stand Technol. .

Abstract

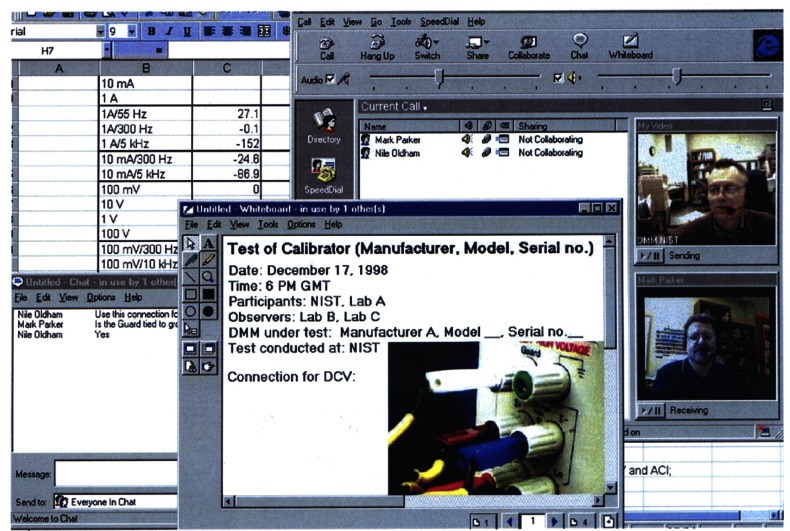
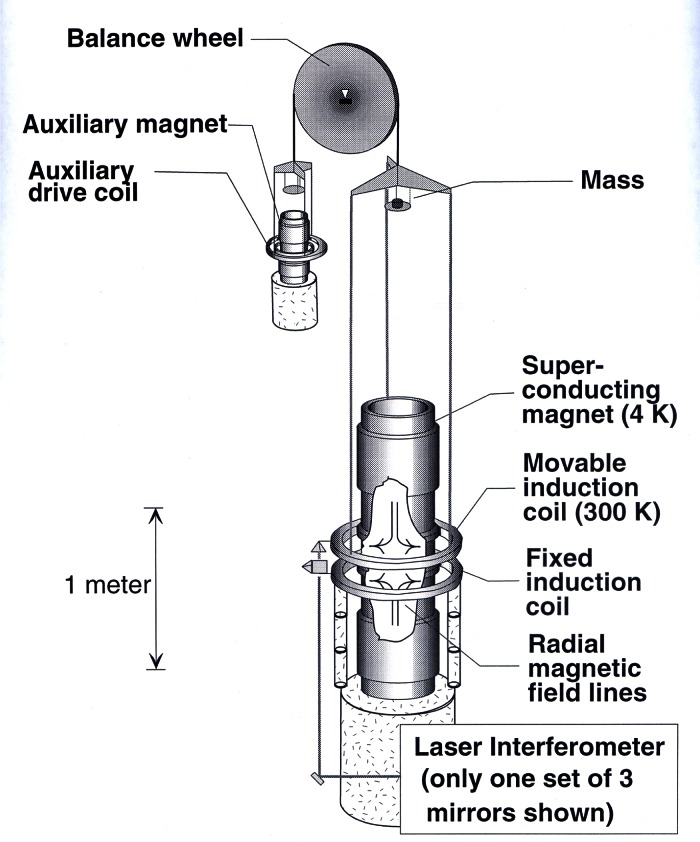
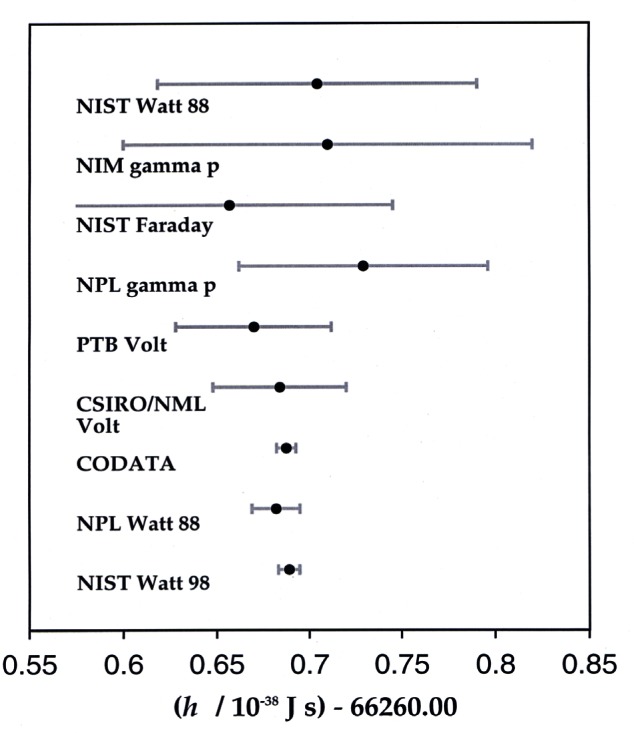
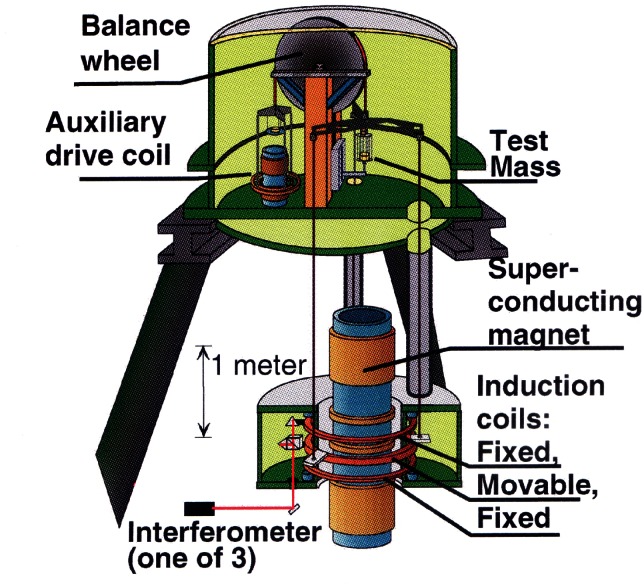
This paper describes some of the major contributions to metrology and physics made by the NIST Electricity Division, which has existed since 1901. It was one of the six original divisions of the National Bureau of Standards. The Electricity Division provides dc and low-frequency calibrations for industrial, scientific, and research organizations, and conducts research on topics related to electrical metrology and fundamental constants. The early work of the Electricity Division staff included the development of precision standards, such as Rosa and Thomas standard resistors and the ac-dc thermal converter. Research contributions helped define the early international system of measurement units and bring about the transition to absolute units based on fundamental principles and physical and dimensional measurements. NIST research has helped to develop and refine electrical standards using the quantum Hall effect and the Josephson effect, which are both based on quantum physics. Four projects covering a number of voltage and impedance measurements are described in detail. Several other areas of current research at NIST are described, including the use of the Internet for international compatibility in metrology, determination of the fine-structure and Planck constants, and construction of the electronic kilogram.

Keywords: Internet; calibration; electrical engineering; josephson arrays; measurement units; resistance measurements.


Figures

Fig. 1
Fig. 1
A double-walled 1 Ω standard resistor of the Thomas type.
Fig. 2
Fig. 2
Differences from the adjusted mean values of the International Ohm, as maintained by various national laboratories, 1911 to 1948. Points marked “Hg” indicate the results of measurements on mercury columns. Reprinted from Ref. [2].
Fig. 3
Fig. 3
A photograph of the outdoor pier with a wooden model showing the location of the mutual inductor, from the 1949 report “An absolute measurement of resistance by the Wenner method” [16].
Fig. 4
Fig. 4
Josephson junction structure irradiated by microwaves of energy hf, producing a dc voltage Vn across the junction.
Fig. 5
Fig. 5
A series of steps of constant voltage generated by a Josephson junction array.
Fig. 6
Fig. 6
Graph showing the Hall voltage VH and longitudinal voltage Vx for a quantized Hall resistance device in a magnetic flux density B and with constant current I. A diagram of such a device, pictured in the inset, shows the alignment of the flux density perpendicular to the plane of the device.
Fig. 7
Fig. 7
This picture shows a Josephson junction array (18 mm × 9 mm) consisting of 20 208 junctions in series that is able to provide voltages up to 12 V with ≈ 155 μV between two adjacent steps, when irradiated with microwave radiation at a frequency of 75 GHz. Each Josephson junction provides zero-crossing voltage steps when microwave radiation is applied through the finline antenna at the right.
Fig. 8
Fig. 8
Graph of zero-crossing voltage steps for a single Josephson junction.
Fig. 9
Fig. 9
Voltage calibration path at NIST, showing the Josephson voltage standard (JVS) 1 V system and 10 V system. Also shown are the transfer Zener voltage references, primary standard cells, and three calibration systems. MAP standards are standard cells used for the measurement assurance program.
Fig. 10
Fig. 10
Industry needs and NIST capabilities in voltage calibration. The expanded uncertainty corresponds to a coverage factor k = 2 (DVM: digital multimeter, JVS: Josephson voltage standard).
Fig. 11
Fig. 11
Cross section of a thin-film multijunction thermal converter.
Fig. 12
Fig. 12
Integrated micropotentiometer including the thin-film multijunction thermal converter (FMJTC) structure.
Fig. 13
Fig. 13
Photograph of a cryogenic thermal transfer standard showing the chip, converter stage, and reference platform. The cryostat base-plate is at 4.2 K, the reference platform is at 6 K, and the converter stage is at 6 K + ΔTc.
Fig. 14
Fig. 14
Diagram of the calculable capacitor electrodes, with one of the four main electrodes shown in cut-away view. Measurement voltages are applied across opposite pairs of main electrodes, and the central blocking electrode can be moved vertically to change the capacitance.
Fig. 15
Fig. 15
Calculable capacitor (vacuum chamber at center) and measurement apparatus.
Fig. 16
Fig. 16
The calculable capacitor measurement chain. Capacitance and resistance standards are represented by red boxes, with QHR representing the quantized Hall resistance. Measurement bridges used to relate the standards to each other are represented by ovals.
Fig. 17
Fig. 17
A 10 pF fused-silica capacitance standard.
Fig. 18
Fig. 18
Schematic of a cryogenic current comparator resistance bridge.
Fig. 19
Fig. 19
Time dependence of the U.S. ohm representation.
Fig. 20
Fig. 20
Hermetically-sealed resistor container assembly with glass-to-metal seals and copper purging tubes soldered to end plates.
Fig. 21
Fig. 21
Photograph of the programmable guarded coaxial switching system. The robotic xyz translation stage used for switching has been labeled “Jake”.
Fig. 22
Fig. 22
Connection of resistors for measurements by the ring method, showing the three subsets of connections for voltage measurements.
Fig. 23
Fig. 23
Schematic of a guarded multimegohm resistance bridge, used for comparing standard resistors up to 100 TΩ.
Fig. 24
Fig. 24
Typical video conference screen with video images of the participants on the right in the main panel, a shared spreadsheet in the upper left, the chat window in the lower left, and the whiteboard (electronic notebook) highlighted in the center.
Fig. 25
Fig. 25
Schematic of the 1990s NIST watt balance experiment. The wheel, both magnets, and the fixed induction coil are rigidly connected. A cryostat is between the superconducting magnet and the induction coils.
Fig. 26
Fig. 26
Comparison of recent electrical measurements of the Planck constant h. NIM: National Institute of Metrology (People’s Republic of China); NPL: National Physical Laboratory (UK); PTB: Physikalische-Technische Bundesanstalt, (Germany); CSIRO/NML: National Measurement Laboratory (Australia); CODATA: Committee on Data for Science and Technology of the International Council of Scientific Unions, Task Group on Fundamental Constants. The CODATA value of h is a least-squares adjusted value based on the other measurements shown here.
Fig. 27
Fig. 27
Schematic representation of the electronic kilogram apparatus. The vacuum chamber and support tripod are shown in cut-away view.

References

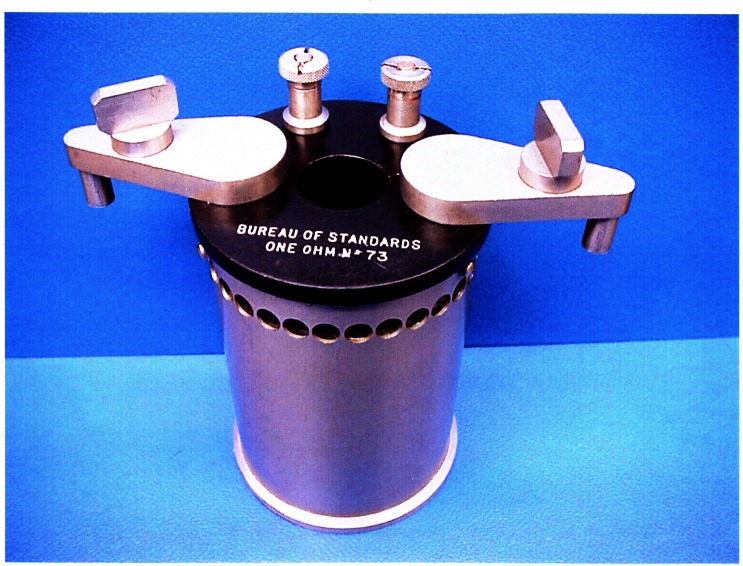
    1. Thomas JL. Precision resistors and their measurement. NBS Circ. 1948;470
    1. Silsbee FB. Establishment and maintenance of the electrical units. NBS Circ. 1949;475
    1. Harris FK. Electrical units; Proc 19th An Instrum Soc Amer Conf (Paper No. 12.1-1-64); 1964.
    1. Cochrane RC. Measures for Progress—A History of the National Bureau of Standards. U.S. Dept of Commerce; Washington, DC: 1966. - PubMed
    1. Rosa EB. Report to the International Committee on Electrical Units and Standards. NBS Misc Publ M. 1912;16

LinkOut - more resources