. 2001 Apr 1;106(2):381-9.
doi: 10.6028/jres.106.015. Print 2001 Mar-Apr.

The Development of Fluorescence Intensity Standards

Affiliations

The Development of Fluorescence Intensity Standards

A K Gaigalas et al. J Res Natl Inst Stand Technol. .

Abstract

The use of fluorescence as an analytical technique has been growing over the last 20 years. A major factor in inhibiting more rapid growth has been the inability to make comparable fluorescence intensity measurements across laboratories. NIST recognizes the need to develop and provide primary fluorescence intensity standard (FIS) reference materials to the scientific and technical communities involved in these assays. The critical component of the effort will be the cooperation between the Federal laboratories, the manufacturers, and the technical personnel who will use the fluorescence intensity standards. We realize that the development and use of FIS will have to overcome many difficulties. However, as we outline in this article, the development of FIS is feasible.

Keywords: fluorescence intensity; quantitative fluorescence; standards.


Figures

Fig. 1
Fig. 1
A schematic diagram of the entire fluorescence based biological assay. The word “probe” stands for a molecule that gives biological selectivity and the symbol “Fl” represents the fluorophore that is conjugated to the probe. The instrument and data processing software detects and processes the fluorescence measurements. The proposed particle SRM would be Fl conjugated to a probe-particle which would mimic the response of Fl in the biological assay. The comparison of the response of the SRM and biological assay would yield a quantitation of the fluorescence intensity.
Fig. 2
Fig. 2
A plot of the wavelength dependence of the relative absorbance (excitation) and the relative emission(fluorescence) of fluorescein in Borate buffer with pH=9. The difference in the maximum wavelengths of the two plots is called the Stokes shift.
Fig. 3
Fig. 3
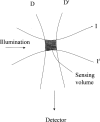
A schematic of the geometry of illumination and detection. The shaded volume is the sensing volume and is the volume over which the integral in Eq. (2) is taken. The sensing volume is the overlap of the illumination volume bounded by I and I′ and the detection volume bounded by D, D′. The geometry and various filters and optical elements give the instrumental factors in the fluorescence intensity measurements as described in Eq. (3).
Fig. 4
Fig. 4
A graph of hypothetical excitation profiles of fluorophores in the standard and test solutions. The vertical lines represent the excitation wavelengths used by two different instruments called A and B. The ratio of the molar extinction coefficients of the standard to test solutions is greater than 1 for instrument A and less than 1 for instrument B. The difference in the ratio would lead to different determinations of the concentration of the fluorophore in the test solution.
Fig. 5
Fig. 5
A graph of hypothetical emission spectral functions, s(λ), of a fluorophore in standard and test solutions. The thick horizontal lines represent the filter transmission range for instruments A and B. For the sake of simplicity the transmission will be set to 1. The ratio of the integral s(λ) of the standard and test solutions over the transmission range will be greater for instrument A than that for instrument B. The difference in the ratio would lead to different determinations of the concentration of the fluorophore in the test solution.

References

    1. Marti G. History, Practical Theory and Consensus of Quantitative Flow Cytometry Measurements, Standards for QC/QA in Flow Cytometry. Bethesda, MD: CBER, FDA; 1997.
    1. Barker PE, Schwab M. Junction mapping of translocation chromosomes by fluorescence in situ hybridization (FISH) and computer image analysis in human solid tumors. Methods of Molecular Genetics. 1993;2:129–154.
    1. Schwartz A, Marti GE, Poon R, Gratama JW, Fernandez-Repollet E. Standardizing flow cytometry: A classification system of fluorescence standards used for flow cytometry. Cytometry. 1998;33:106–114. - PubMed
    1. Gratama JW, D’Hautcourt JL, Mandy F, Rothe G, Barnett D, Janossy G, Papa S, Schmitz G, Lenkei R. Flow cytometric quantitation of immunofluorescence intensity: Problems and perspectives. Cytometry. 1998;33:166–178. - PubMed
    1. Lenkei R, Gratama JW, Rothe G, Schmitz G, D’Hautcourt JL, Arekrans A, Mandy F, Marti G. Performance of calibration standards for antigen quantitation with flow cytometry. Cytometry. 1998;33:188–196. - PubMed

LinkOut - more resources