. 2016 Sep 1;126(9):3567-79.
doi: 10.1172/JCI87382. Epub 2016 Aug 8.

MondoA coordinately regulates skeletal myocyte lipid homeostasis and insulin signaling

MondoA coordinately regulates skeletal myocyte lipid homeostasis and insulin signaling

Byungyong Ahn et al. J Clin Invest. .

Abstract

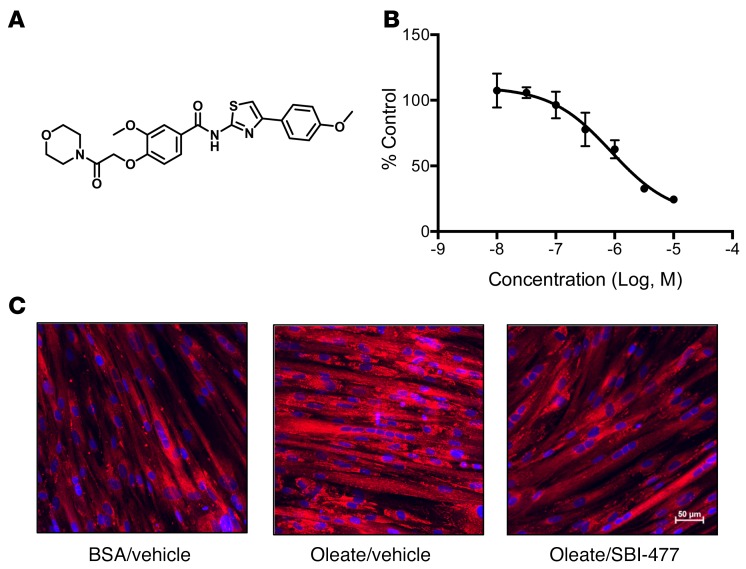
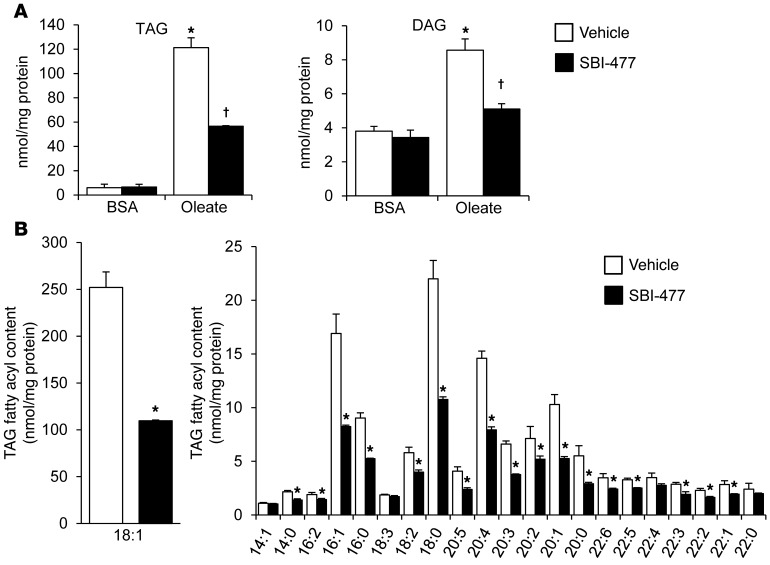
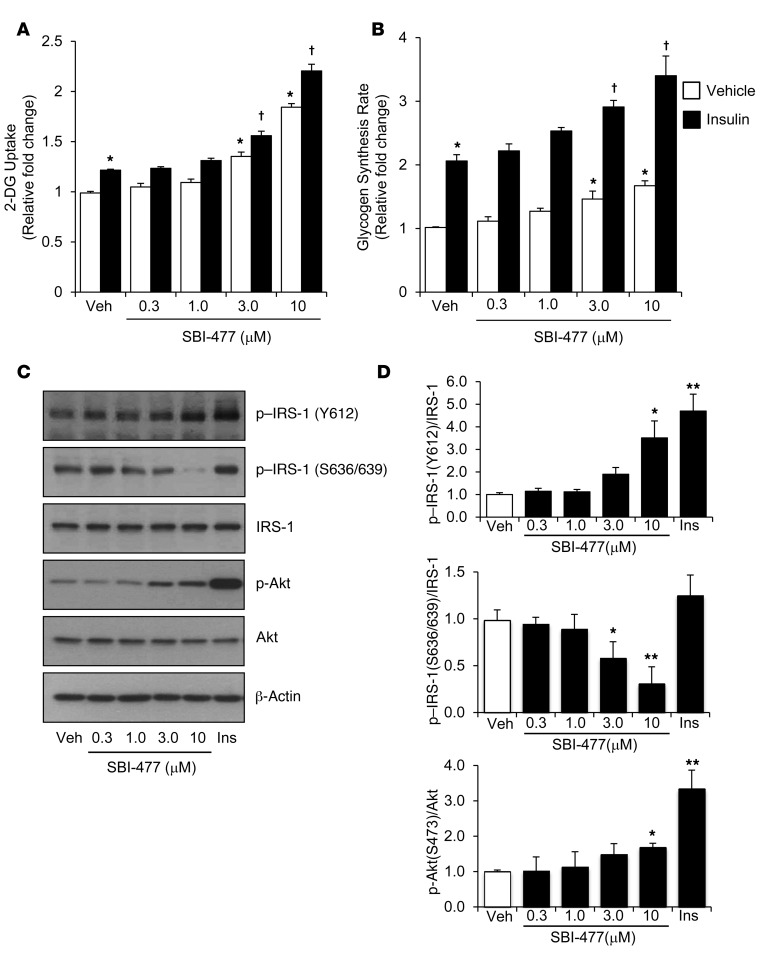
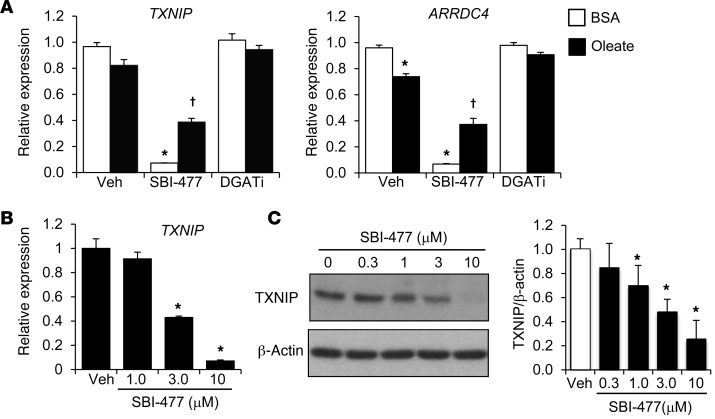
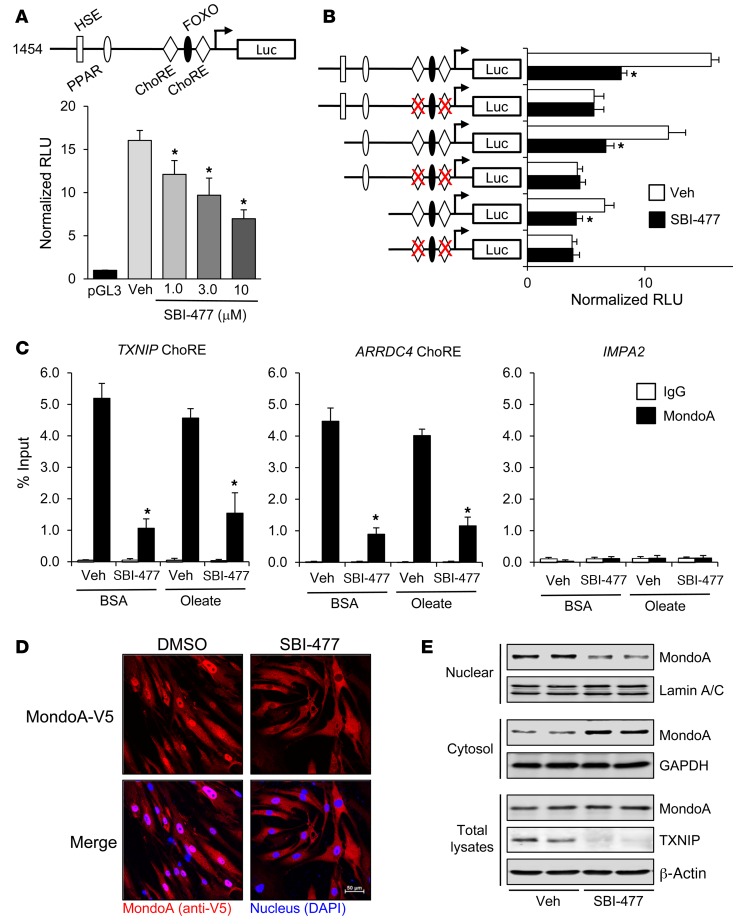
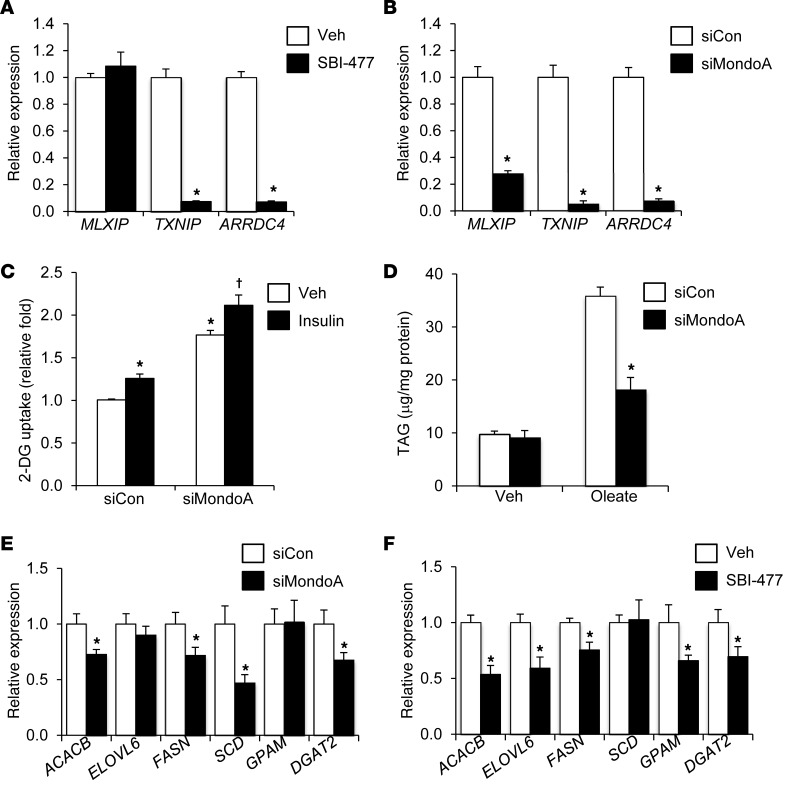
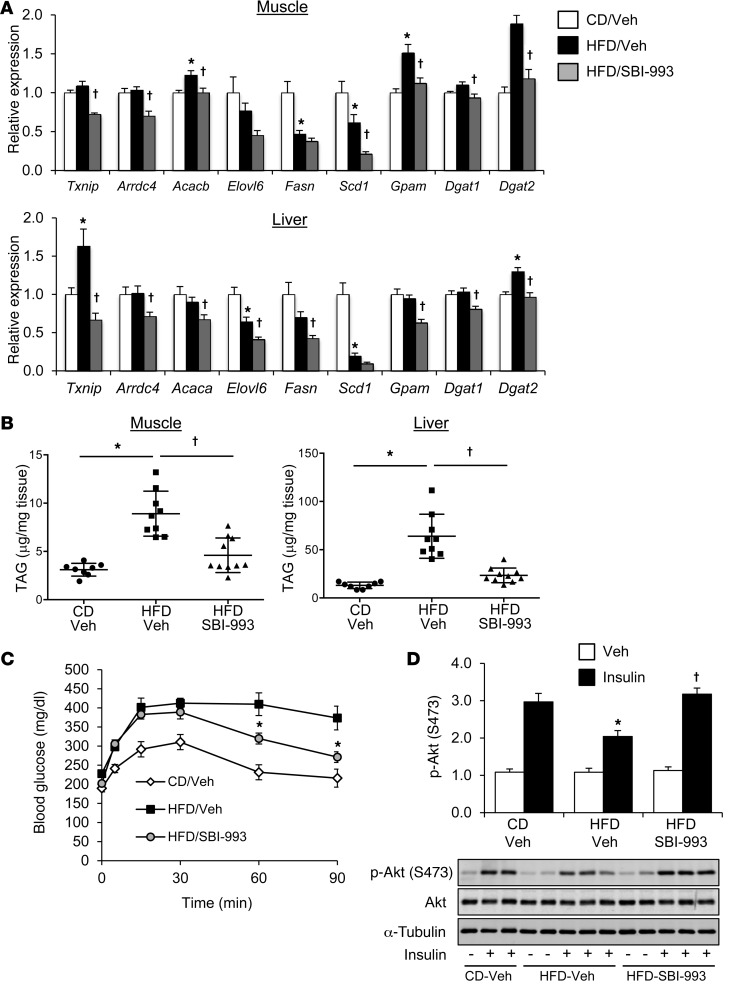
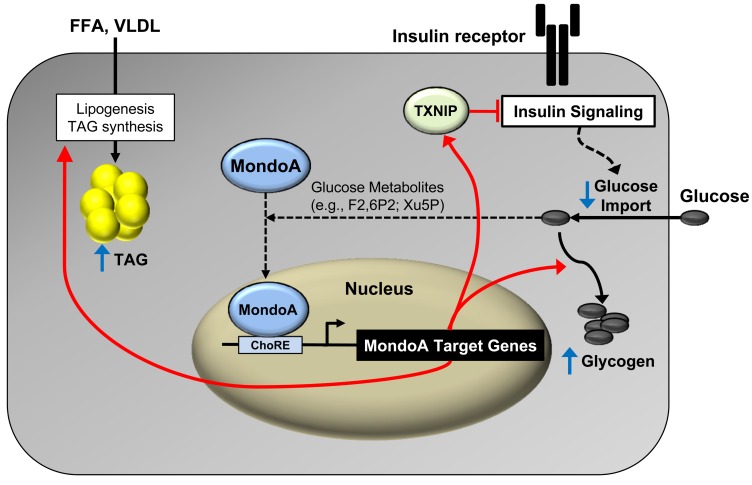
Intramuscular lipid accumulation is a common manifestation of chronic caloric excess and obesity that is strongly associated with insulin resistance. The mechanistic links between lipid accumulation in myocytes and insulin resistance are not completely understood. In this work, we used a high-throughput chemical biology screen to identify a small-molecule probe, SBI-477, that coordinately inhibited triacylglyceride (TAG) synthesis and enhanced basal glucose uptake in human skeletal myocytes. We then determined that SBI-477 stimulated insulin signaling by deactivating the transcription factor MondoA, leading to reduced expression of the insulin pathway suppressors thioredoxin-interacting protein (TXNIP) and arrestin domain-containing 4 (ARRDC4). Depleting MondoA in myocytes reproduced the effects of SBI-477 on glucose uptake and myocyte lipid accumulation. Furthermore, an analog of SBI-477 suppressed TXNIP expression, reduced muscle and liver TAG levels, enhanced insulin signaling, and improved glucose tolerance in mice fed a high-fat diet. These results identify a key role for MondoA-directed programs in the coordinated control of myocyte lipid balance and insulin signaling and suggest that this pathway may have potential as a therapeutic target for insulin resistance and lipotoxicity.


Figures

Figure 1
Figure 1. SBI-477 is a small-molecule inhibitor of neutral lipid accumulation in human skeletal myotubes.
(A) Chemical structure of SBI-477. (B) Effects of SBI-477, over a dose range, on triglyceride levels in human skeletal myotubes following a 24-hour exposure to 100 μM oleate. Data are shown as the percentage of DMSO vehicle control and are representative of more than 5 experiments. (C) Effects of SBI-477 on human skeletal myotube neutral lipid accumulation as visualized by AdipoRed staining (red). Cell nuclei were stained with DAPI (blue). Images shown are representative of more than 3 images.
Figure 2
Figure 2. SBI-477 inhibits expansion of cellular DAG and TAG pools in oleate-loaded myocytes.
Results of quantitative lipidomic analyses performed on human skeletal myotubes exposed to BSA or 100 μM oleate in the presence of DMSO vehicle (white bars) or 10 μM SBI-477 (black bars) for 24 hours. (A) Total mean TAG and DAG levels are shown. (B) Levels of individual TAG fatty acyl species, with 18:1 species shown separately (left). Data represent the mean ± SD (n = 3). *P < 0.05 versus vehicle; P < 0.05 versus oleate-loaded vehicle; Student’s t test.
Figure 3
Figure 3. SBI-477 stimulates glucose uptake and activates insulin signaling in the absence of insulin.
Human skeletal myotubes were incubated with SBI-477 at the indicated concentration for 24 hours and then treated with or without insulin (100 nM) for 30 minutes. Glucose (2-DG) uptake (A) and glycogen synthesis rates (B) were measured (n = 5) as described in Methods. (A and B) *P < 0.05 versus vehicle, no insulin; P < 0.05 versus vehicle with insulin; 2-way ANOVA with Tukey’s post-hoc test. (C) Western blot analysis of human myotubes treated with SBI-477 for 24 hours was performed to determine the effect on steps of the insulin-signaling pathway using specific Akt and IRS-1 phosphorylation sites as endpoints. Insulin treatment (100 nM) for 30 minutes was used as a positive control. (D) Graph shows quantitation of the Western blot data in C (n = 5). *P < 0.05 and **P < 0.01 versus vehicle; 1-way ANOVA with Bonferroni’s post-hoc test. Data represent the mean ± SD. Ins, insulin; Veh, vehicle.
Figure 4
Figure 4. Downregulation of TXNIP and ARRDC4 expression by SBI-477.
(A) TXNIP and ARRDC4 mRNA levels as determined by quantitative reverse transcription PCR (qRT-PCR) in human myotubes treated with SBI-477 (10 μM) or DGAT1 inhibitor (DGATi, 1 μM) for 24 hours in the absence or presence of 100 μM oleate (n = 4). Expression is shown relative to vehicle with BSA treatment. (B) TXNIP gene expression following exposure to a dose range of SBI-477 for 24 hours (n = 4). (C) Western blot analysis was performed to determine the effect of SBI-477 on TXNIP protein levels. Graph shows quantitation of the TXNIP Western blot data (n = 5). *P < 0.05 versus vehicle/BSA control; P < 0.05 versus vehicle/oleate; 1-way ANOVA with Bonferroni’s post-hoc test. Data represent the mean ± SD.
Figure 5
Figure 5. SBI-477 inhibits MondoA-mediated activation of the TXNIP gene promoter via effects on nuclear localization.
(A) A luciferase reporter construct containing approximately 1.5 kb of the human TXNIP promoter (schematic) or a pGL3 control vector was transfected into H9c2 skeletal myocytes. The activity of the TXNIP promoter (relative luciferase units [RLU]) was measured following treatment with SBI-477 at the indicated concentration (n = 5). (B) The activity of WT versus ChoRE mutant TXNIP promoters was measured in the presence and absence of SBI-477 (10 μM) for 24 hours (n = 5). The red “X” denotes inactivity mutations. (C) ChIP–qRT-PCR analysis was performed with anti-MondoA (black bars) or IgG (white bars) control Abs in human skeletal myotubes. Occupancy of MondoA on the ChoRE of the TXNIP or ARRDC4 promoters following treatment with SBI-477 in the absence or presence of oleate is shown (n = 4). Occupation on a MEF2-binding site within the IMPA2 promoter was used as a negative control. (D) Representative images of more than 3 micrographs of MondoA-V5 in human skeletal myoblasts following treatment with 10 μM SBI-477 or DMSO vehicle control for 24 hours. MondoA-V5 staining is shown in red, DAPI in blue. (E) Western blot analysis was performed on total cell lysates and nuclear or cytoplasmic fractions from primary human myotubes treated with 10 μM SBI-477 or DMSO vehicle control for 24 hours. Lamin A/C and GAPDH were included as controls for the nuclear and cytoplasmic fractions, respectively. *P < 0.05 versus vehicle; 1-way ANOVA with Bonferroni’s post-hoc test. Data represent the mean ± SD. HSE, heat shock element; Luc, luciferase.
Figure 6
Figure 6. MondoA depletion mimics action of SBI-477 in human skeletal myotubes.
TXNIP and ARRDC4 gene expression was measured following treatment with 10 μM SBI-477 (A) or siRNA-mediated MondoA (MLXIP) KD (B) (n = 4). *P < 0.05 versus vehicle (A) or nontargeting siRNA control (siCon) (B). (C) 2-DG uptake following MondoA KD (or siCon) in the absence or presence of insulin (n = 5). *P < 0.05 versus siCon/vehicle; P < 0.05 versus siCon/insulin. (D) Cellular TAG levels following MondoA KD in the absence or presence of 100 μM oleate (n = 5). *P < 0.05 versus siCon/oleate. Effect of MondoA KD (E) or SBI-477 treatment (F) on the expression of genes encoding lipogenic and triglyceride synthesis enzymes (n = 4). *P < 0.05 versus vehicle or siCon. Data represent the mean ± SD. Statistical significance in all panels was determined by Mann-Whitney U test.
Figure 7
Figure 7. SBI-993 inhibits muscle and hepatic TAG accumulation and reduces MondoA target gene expression in vivo.
Mice maintained on an HFD for 8 weeks were administered SBI-993 (50 mg/kg, q.d., s.c.) or a vehicle control for the final week of HFD feeding. Target gene expression (A) and total triglyceride content (B) were measured in skeletal muscle (gastrocnemius) and liver in mice maintained on a control diet (CD) or HFD (n = 6–10 mice per group). *P < 0.05 versus CD/vehicle; P < 0.05 versus HFD/vehicle; 1-way ANOVA with Bonferroni’s post-hoc test. (C) Blood glucose levels are shown following a glucose tolerance test (1 g/kg glucose, i.p.) after dosing with SBI-993 or vehicle (n = 6 per group). Data represent the mean ± SEM. *P < 0.05 HFD/vehicle versus HFD/SBI-993; 2-way ANOVA with Tukey’s multiple comparisons post-hoc test. (D) Western blot analysis of gastrocnemius skeletal muscle whole-cell lysate from mice receiving an acute insulin challenge (1.5 U/kg for 10 minutes) to examine insulin signaling using p-Akt (S473). Graph shows quantification of Western blot analysis (n = 4–6 per condition). Representative Western blots are shown. *P < 0.05 versus CD/vehicle; P < 0.05 versus HFD/vehicle; 1-way ANOVA with Bonferroni’s post-hoc test.
Figure 8
Figure 8. MondoA directs myocyte fuel homeostatic checkpoint functions.
Proposed gene-regulatory (red arrows) and metabolic “checkpoint” responses (blue arrows) downstream of MondoA. MondoA is a glucose “sensor” that is directly activated by glycolytic metabolites that stimulate nuclear import of MondoA. Once activated, MondoA functions as a “brake” to limit carbon entry into the cell via increasing levels of TXNIP, an inhibitor of insulin signaling and glucose uptake. In addition, MondoA promotes energy storage through activation of enzymes involved in lipid and glycogen synthesis. Thus, MondoA may serve to limit carbon intake and fuel burning during conditions of “plenty.” However, in states of chronic nutrient excess, persistent activation of MondoA may become maladaptive, contributing to a vicious cycle of cellular lipid accumulation (TAG synthesis) and insulin resistance (TXNIP-mediated suppressive effects).

References

    1. Pan DA, et al. Skeletal muscle triglyceride levels are inversely related to insulin action. Diabetes. 1997;46(6):983–988. - PubMed
    1. Krssak M, et al. Intramyocellular lipid concentrations are correlated with insulin sensitivity in humans: a 1H NMR spectroscopy study. Diabetologia. 1999;42(1):113–116. doi: 10.1007/s001250051123. - DOI - PubMed
    1. Goodpaster BH, Theriault R, Watkins SC, Kelley DE. Intramuscular lipid content is increased in obesity and decreased by weight loss. Metab Clin Exp. 2000;49(4):467–472. doi: 10.1016/S0026-0495(00)80010-4. - DOI - PubMed
    1. Mitra R, et al. The transcriptional coactivators, PGC-1α and β, cooperate to maintain cardiac mitochondrial function during the early stages of insulin resistance. J Mol Cell Cardiol. 2012;52(3):701–710. doi: 10.1016/j.yjmcc.2011.10.010. - DOI - PMC - PubMed
    1. Petersen KF, Dufour S, Befroy D, Garcia R, Shulman GI. Impaired mitochondrial activity in the insulin-resistant offspring of patients with type 2 diabetes. N Engl J Med. 2004;350(7):664–671. doi: 10.1056/NEJMoa031314. - DOI - PMC - PubMed

MeSH terms