. 2016 Oct;17(10):1216-1225.
doi: 10.1038/ni.3519. Epub 2016 Aug 8.

Plasma cell differentiation is coupled to division-dependent DNA hypomethylation and gene regulation

Affiliations

Plasma cell differentiation is coupled to division-dependent DNA hypomethylation and gene regulation

Benjamin G Barwick et al. Nat Immunol. 2016 Oct.

Abstract

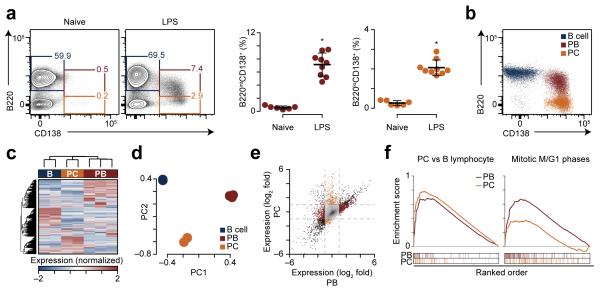
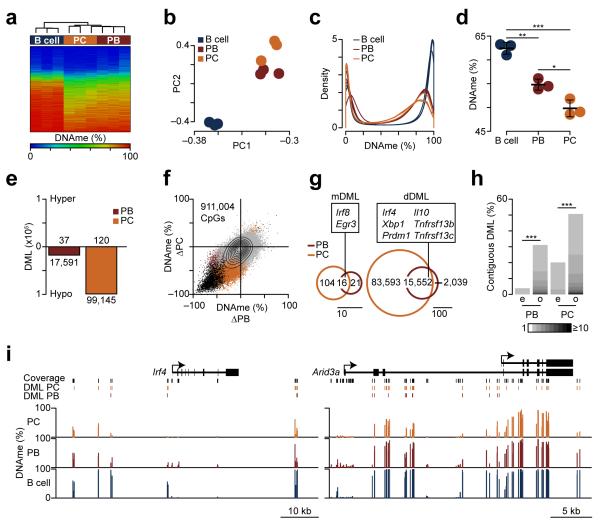
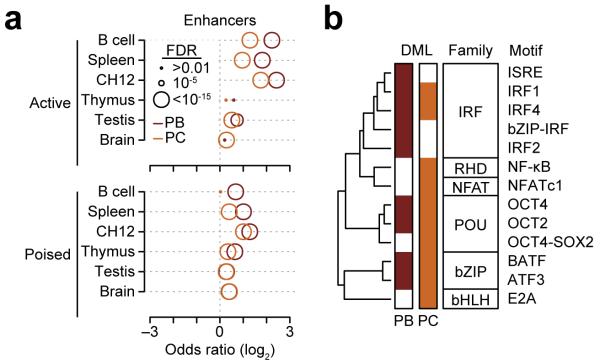
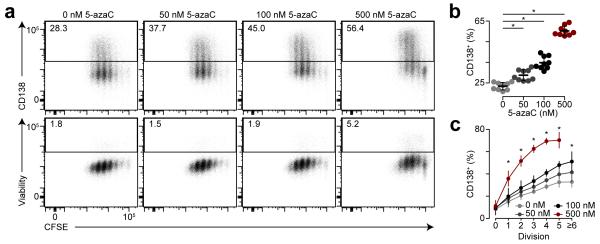
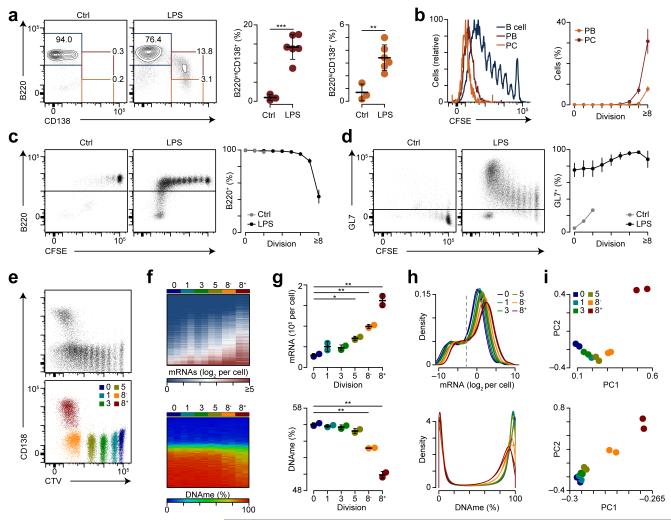
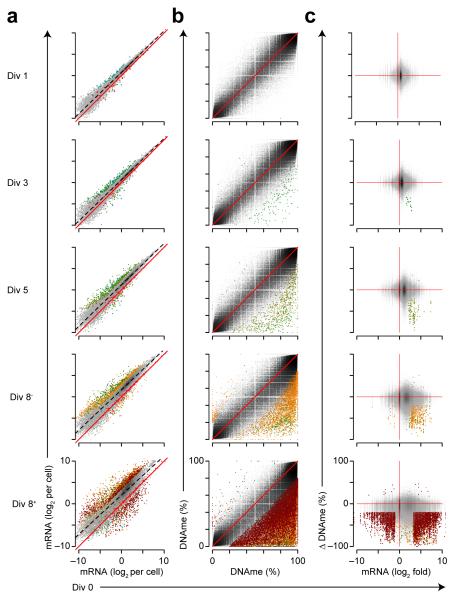
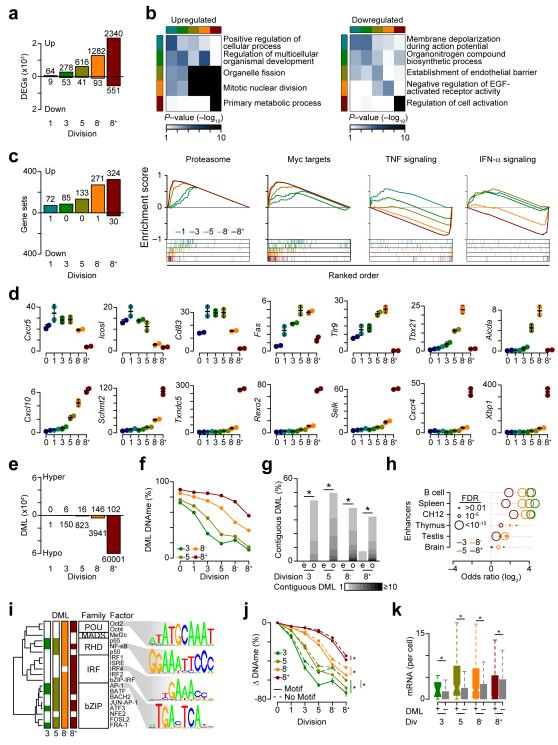
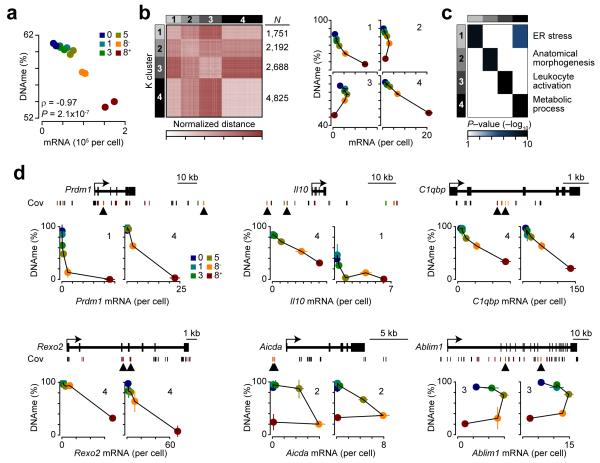
The epigenetic processes that regulate antibody-secreting plasma cells are not well understood. Here, analysis of plasma cell differentiation revealed DNA hypomethylation of 10% of CpG loci that were overrepresented at enhancers. Inhibition of DNA methylation enhanced plasma cell commitment in a cell-division-dependent manner. Analysis of B cells differentiating in vivo stratified by cell division revealed a fivefold increase in mRNA transcription coupled to DNA hypomethylation. Demethylation occurred first at binding motifs for the transcription factors NF-κB and AP-1 and later at those for the transcription factors IRF and Oct-2 and was coincident with activation and differentiation gene-expression programs in a cell-division-dependent manner. These data provide mechanistic insight into cell-division-coupled transcriptional and epigenetic reprogramming and suggest that DNA hypomethylation reflects the cis-regulatory history of plasma cell differentiation.


Figures

Figure 1
Figure 1
B-cell differentiation is coupled to unique transcriptional states. (a) Flow cytometry showing splenic B220 and CD138 expression in naïve and LPS-challenged mice on day 3 (left). Quantitation of B220intCD138+ plasmablasts and B220loCD138+ plasma cells (right). (b) Post sort purity of B cells, plasmablasts (PB) and plasma cells (PC). (c) Hierarchical clustering of expression data at 16,181 genes in the populations shown above. (d) Principle components analysis of expression data shown in c. (e) Scatterplot of expression changes in B220intCD138+ plasmablasts (PB) and B220loCD138+ plasma cells (PC) as compared to B cells from naïve mice. Differentially expressed genes (Supplementary Table 1) are shown in burgundy (plasmablasts), gold (plasma cells), or black (both). Dashed gray lines indicate expression changes of twofold. (f) Gene set enrichment analysis of expression changes in plasmablasts and plasma cells for genes regulated in human plasma cells (left, FDR <0.05) and the Reactome pathway ‘Mitotic M-M/G1 phases’ (FDR <0.01, plasmablasts only). Enrichment score is shown on top for both plasmablasts and plasma cells. Below is the overlap of genes from each gene set with the ordered expression changes of plasmablasts and plasma cells relative to B cells. *P <0.001 (two-tailed t-test). Data are representative from two experiments and 15 mice (a, mean and s.d.) or one experiment with three mice where two B cells, three plasmablasts, and two plasma cells were analyzed (c-f).
Figure 2
Figure 2
B220intCD138+ plasmablasts (PBs) and B220loCD138+ plasma cells (PCs) undergo DNA hypomethylation. (a) Hierarchically clustered heatmap of DNA methylation (DNAme) data for naïve splenic B220+ B cells and LPS-induced B220intCD138+ plasmablasts and B220loCD138+ plasma cells. (b) Principle components analysis of DNAme data. (c) Probability distribution of DNA methylation. (d) Average DNA methylation for B cells, plasmablasts and plasma cells showing a genome-wide decrease. (e) Barplot of differentially methylated loci (DML). Methylated loci (hyper) are shown on a positive scale and demethylated loci (hypo) are shown as negative values. (f) Scatter plot of DNA methylation changes in plasmablasts and plasma cells. Differentially methylated loci are colored in burgundy (PB), gold (PC) and black (both). (g) Venn diagram of methylated (left; mDML) and demethylated (right; dDML) showing overlap of plasmablast and plasma cell differentially methylated loci. (h) Bar plot showing the percent of differentially methylated loci clustered into contiguous regions for plasmablasts and plasma cells. The shade denotes the number of CpGs in the contiguous region, where contiguous is defined relative to assay coverage. The expected (e) percentiles are shown to the left of the observed (o). (k) Genome plots of Irf4 and Arid3a showing demethylated regions. Coverage is indicated by black bars and plasmablast and plasma cell differentially methylated loci are shown. Average DNA methylation for B cells, PBs, and PCs are shown below. *P <0.05, **P <0.01, ***P <0.001 (Welch’s t-test (d), or permutation testing (h)). Data represent three biological replicates (d; mean and s.d.).
Figure 3
Figure 3
Differentially methylated loci (DML) preferentially occur at B cell enhancers and near motifs of transcription factors required for B cell differentiation. (a) Overlap of B220intCD138+ plasmablast (PB) and B220loCD138+ plasma cell (PC) differentially methylated loci with active and poised enhancers. (b) Clustering of transcription factor motifs enriched near (≤50 bp) differentially methylated loci in plasmablasts and plasma cells. Motifs are clustered on the similarity of their consensus binding motif. Transcription factor families are denoted in black boxes (IRF: Inteferon Regulatory Factor; RHD: Rel Homology Domain; NFAT: Nuclear Factor of Activated T-cells; POU: Pituitary Octamer Unc-86 transcription factor; bZIP: basic Leucine Zipper Domain; bHLH: basic Helix-Loop-Helix). The HOMER motif name is labelled on the right. Significance (FDR ≤0.05) was determined from HOMER software. Enhancers were determined from publically available data, where active enhancers were defined as H3K4me1+H3K27ac+H3K4me3− and poised enhacers as H3K4me1+H3K27ac−H3K4me3-30. Data represent three biological replicates.
Figure 4
Figure 4
Inhibition of DNA methylation facilitates plasma cell differentiation. (a) Flow cytometry analysis of CFSE staining, CD138 expression and viability exclusion dye on B cells differentiated for three days ex vivo with LPS, IL-2, IL-5 and treated with increasing amounts of 5-azacytidine (5-azaC). (b) Frequency of CD138+ cells by 5-azaC treatment. (c) Frequency of CD138+ cells by cell division and 5-azaC treatment. *P <0.001 (two-tailed t-test (b) or ANOVA (c)). Data are from three independent experiments with 1-5 mice per experiment pooled and performed in triplicate (b, c, mean and s.d.).
Figure 5
Figure 5
Transcriptional amplification and DNA hypomethylation coincide with cellular division. (a) B220 and CD138 expression on transferred splenic naïve CD45.1+B220+ B cells showing LPS-induced CD138 expression (left). Quantification of B220intCD138+ plasmablasts (PBs; center) and B220loCD138+ plasma cells (PCs; right). (b) CFSE dilution on B220+ B cells, B220intCD138+ plasmablasts, and B220loCD138+ plasma cells (left). Quantification of B220intCD138+ plasmablasts and B220loCD138+ plasma cells by division (right). (c) B220 expression by division for control and LPS challenged mice (left). Quantitation of B220+ cells by division (right). (d) GL7 expression by division for control and LPS challenged mice (left). Quantitation of GL7+ cells by division (right). (e) Cell trace violet (CTV) staining and CD138 expression for CD45.1+ cells (top) and post sort purity (bottom) for the indicated populations. (f) Heatmaps of transcript expression (top) and DNA methylation (DNAme) (bottom) for populations shown in e. (g) Quantification of average mRNAs per cell (top) and DNAme (bottom) measured across 1,639,598 CpGs assessed. (h) Probability density for mRNA expression (top) and DNAme (bottom). The dashed gray line indicates the 90% detection level. (i) Principle component analysis for mRNA expression (top) and DNAme (bottom). *P <0.05, **P <0.01 and ***P <0.001 (two-tailed t-test (a, g)). Data are from two experiments with 4 and 6 mice per experiment (a-e) or one experiment performed in biological duplicate (f-i) (a-d, g; mean and s.d.).
Figure 6
Figure 6
Cell division coupled changes in gene expression and DNA methylation (DNAme). (a) Scatter plot of gene expression showing changes between undivided B cells (Div 0) and distinct divisions of differentiating B cells defined in Fig. 5e (bottom). Spike-in ERCC controls are shown as bright red triangles with a solid bright red regression line. The average regression between the two comparisons is shown as a black dashed line. Differentially expressed genes are shown in color denoting the division at which the gene was determined significant. (b) Scatterplot showing DNA methylation as in a. (c) Scatter plot of mRNA fold-change by change in DNA methylation showing correlation of gene expression and DNA methylation changes. Genes or CpG loci that are both differentially expressed and differentially methylated are colored as in a. Analysis was performed on data sets derived in Fig. 5e and represent the average of two biological replicates.
Figure 7
Figure 7
Dynamic gene expression changes correspond with a hierarchy of DNA hypomethylation. (a) Barplot of differentially expressed genes (DEGs) relative to division 0. (b) Heatmaps of gene ontology results for up and downregulated genes. Rows represent the top ontology for division-specific differentially expressed genes. Columns depict the relationship to other division differentially expressed genes. (c) Barplot of positively and negatively correlated GSEA results (left). GSEA showing upregulation of the proteosome and Myc signaling and downregulation of TNF and IFN-α pathways (right). Plots are as in Fig. 1f. (d) RNA-seq analyses of differentially expressed genes (units are average mRNA per cell). (e) Barplot of differentially methylated loci relative to division 0 with gains (hyper) in DNA methylation (DNAme) plotted above and loses (hypo) below. (f) Plot of DNA methylation at division specific differtenially methylated loci. (g) Barplot representing the fraction of differentially methylated loci that fall into contiguous blocks. The expected (e) number is shown next to the observed (o). (h) Odds ratio of overlap for division-specific demethylated loci with tissue-specific enhancers. (i) Transcription factor motifs enriched in division-specific demethylated regions as described in Fig. 3b. (j) DNA methylation differences for differentially methylated loci near transcription factor motifs in i. (l) Expression for genes that contain transcription factor motifs in i with (+) or without (-) a demethylated loci. *P <0.001 (Fisher’s exact test (b, h), permutation testing (g), ANOVA (j), and Wilcoxon-rank sum test (k)). Analysis was performed on data sets derived in Fig. 5e and represent the average of two biological replicates.
Figure 8
Figure 8
Gene expression correlates with cell division and DNA methylation (DNAme). (a) Scatterplot of average DNA methylation level by the sum of mRNA per cell showing a global correlation between expression and DNA methylation. (b) Heatmap of gene expresssion-DNA methylation correspondance. 11,456 Differentially methylated loci found near 2,431 differentially expressed genes were measured using a normalized Euclidean metric and organized using K-means clustering (see Methods). Average gene expression and DNA methylation for the four K-means groups (right). (c) Heatmap of the top gene ontology result for each of the four K-means groups in b. Each row represents the top ontology for a K-means group and how that ontology is enriched in other groups is depicted by the columns. (d) Gene plots for differentially expressed genes with differentially methylated loci are shown (top). Specific gene expression, DNA methylation and cell division correlations are shown for CpGs denoted in black upward facing arrowheads. Plots correspond to the left and right most CpG assessed, respectively. P-values are determined using an ANOVA (a) or Fisher’s exact test (c). Spearman’s correlation coefficient (ρ) is shown in a. Analysis was performed on data sets derived in Fig. 5e and represent two biological replicates (b, d; mean and s.d.).

References

    1. Macallan DC, et al. B-cell kinetics in humans: rapid turnover of peripheral blood memory cells. Blood. 2005;105:3633–3640. - PubMed
    1. Kouzine F, et al. Global Regulation of Promoter Melting in Naive Lymphocytes. Cell. 2013;153:988–999. - PMC - PubMed
    1. Nutt SL, Taubenheim N, Hasbold J, Corcoran LM, Hodgkin PD. The genetic network controlling plasma cell differentiation. 2011. - PubMed
    1. Hodgkin PD, Lee JH, Lyons AB. B cell differentiation and isotype switching is related to division cycle number. J Exp Med. 1996;184:277–281. - PMC - PubMed
    1. Hasbold J, Corcoran LM, Tarlinton DM, Tangye SG, Hodgkin PD. Evidence from the generation of immunoglobulin G–secreting cells that stochastic mechanisms regulate lymphocyte differentiation. Nat Immunol. 2004;5:55–63. - PubMed

Methods references

    1. Hahne F, et al. flowCore: a Bioconductor package for high throughput flow cytometry. BMC Bioinformatics. 2009;10:106. - PMC - PubMed
    1. Langmead B, Trapnell C, Pop M, Salzberg SL. Ultrafast and memory-efficient alignment of short DNA sequences to the human genome. Genome Biol. 2009;10:R25. others. - PMC - PubMed
    1. Hsu F, et al. The UCSC Known Genes. Bioinformatics. 2006;22:1036–1046. - PubMed
    1. Gentleman RC, et al. Bioconductor: open software development for computational biology and bioinformatics. Genome biology. 2004;5:R80. - PMC - PubMed
    1. Benjamini Y, Hochberg Y. Controlling the False Discovery Rate: A Practical and Powerful Approach to Multiple Testing. Journal of the Royal Statistical Society. Series B (Methodological) 1995;57:289–300.

Publication types

MeSH terms