. 2016 Sep;22(9):1043-9.
doi: 10.1038/nm.4156. Epub 2016 Aug 8.

Defective proviruses rapidly accumulate during acute HIV-1 infection

Affiliations

Defective proviruses rapidly accumulate during acute HIV-1 infection

Katherine M Bruner et al. Nat Med. 2016 Sep.

Abstract

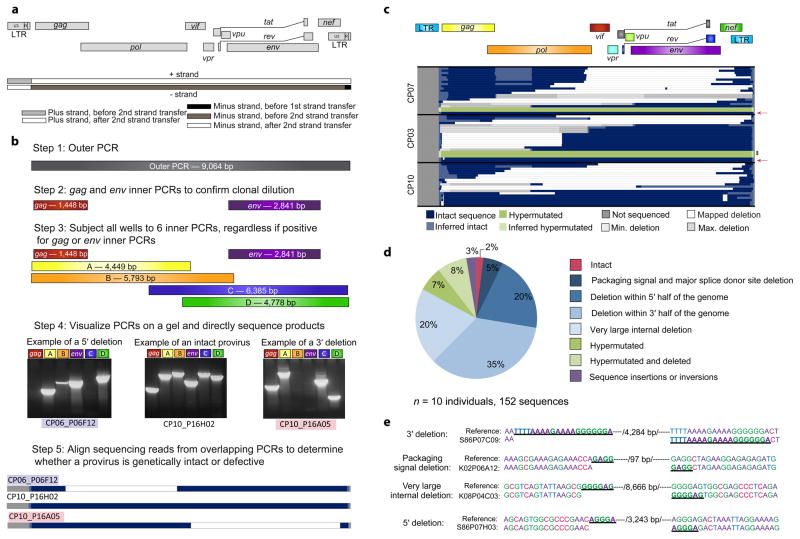
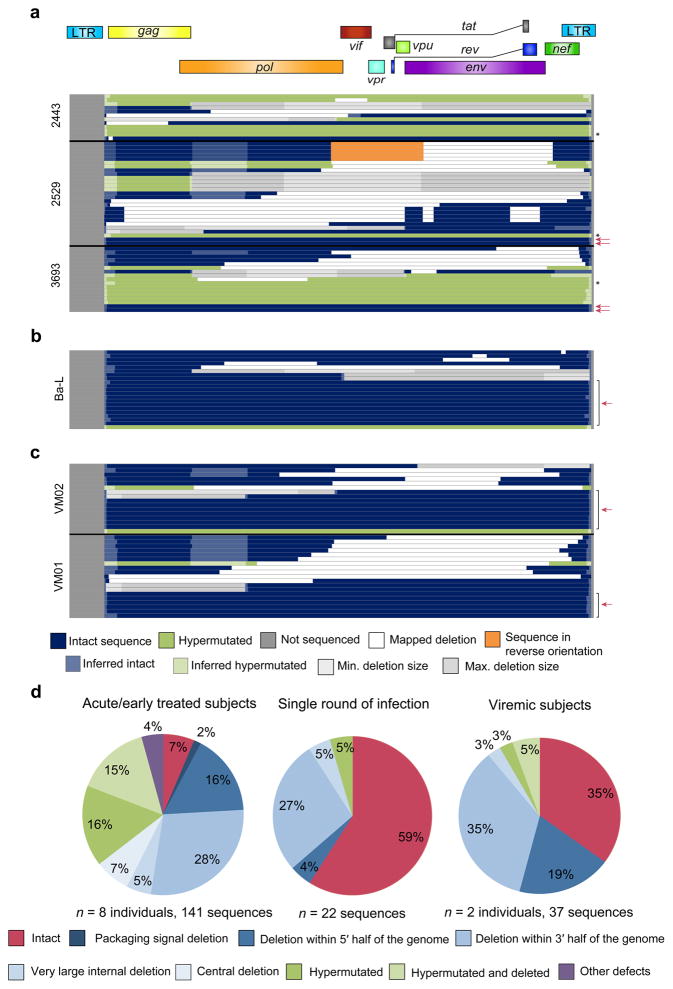
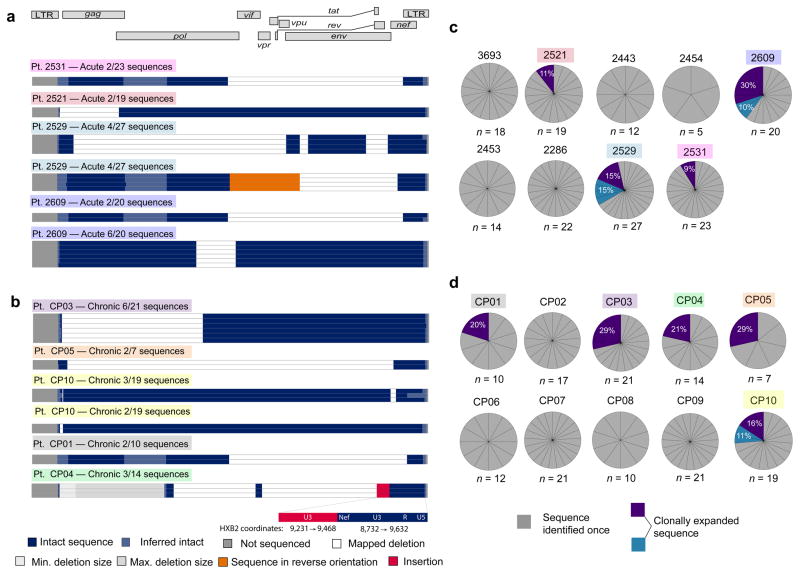
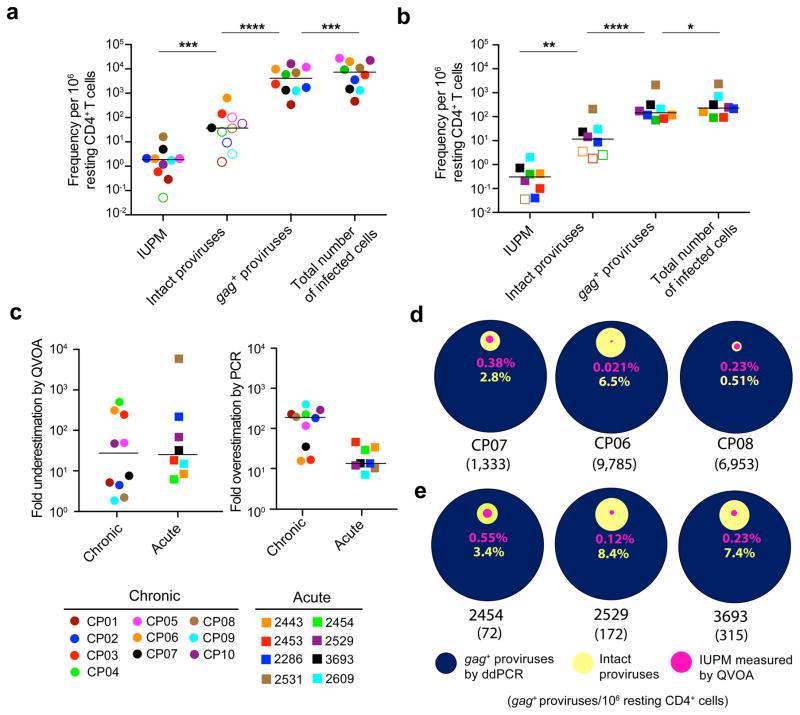
Although antiretroviral therapy (ART) suppresses viral replication to clinically undetectable levels, human immunodeficiency virus type 1 (HIV-1) persists in CD4(+) T cells in a latent form that is not targeted by the immune system or by ART. This latent reservoir is a major barrier to curing individuals of HIV-1 infection. Many individuals initiate ART during chronic infection, and in this setting, most proviruses are defective. However, the dynamics of the accumulation and the persistence of defective proviruses during acute HIV-1 infection are largely unknown. Here we show that defective proviruses accumulate rapidly within the first few weeks of infection to make up over 93% of all proviruses, regardless of how early ART is initiated. By using an unbiased method to amplify near-full-length proviral genomes from HIV-1-infected adults treated at different stages of infection, we demonstrate that early initiation of ART limits the size of the reservoir but does not profoundly affect the proviral landscape. This analysis allows us to revise our understanding of the composition of proviral populations and estimate the true reservoir size in individuals who were treated early versus late in infection. Additionally, we demonstrate that common assays for measuring the reservoir do not correlate with reservoir size, as determined by the number of genetically intact proviruses. These findings reveal hurdles that must be overcome to successfully analyze future HIV-1 cure strategies.


Conflict of interest statement

The authors declare no competing financial interests.

Figures

Figure 1
Figure 1
Proviral sequences in chronically-treated subjects are highly defective. (a) Schematic of strand transfer events during reverse transcription relative to the HIV-1 genome. Deletions occur during minus strand synthesis before the second strand transfer event by the same copy choice mechanism that leads to recombination. (b) Unbiased full genome sequencing strategy based on mechanistic considerations in (a) to capture the majority of defective proviruses. Bands from representative proviruses with a 5′ deletion, an intact sequence, and a 3′ deletion are shown. (c) Maps of proviral clones from three representative subjects treated during the chronic phase of infection. Each horizontal bar represents an individual clone identified through full genome sequencing. In cases where a deletion could not be precisely mapped due to a deletion encompassing multiple forward or reverse primer binding sites, the possible maximum and minimum deletions sizes are plotted (in grey). If sequencing data shows a mapped deletion that removes primer-binding sites for other amplicons, the resulting missing sequence was inferred to be present (light blue or green). A pink arrow denotes full-length, genetically intact sequences. Black asterisks indicate likely full-length hypermutated proviruses that were not fully sequenced due to extreme hypermutation. See Supplementary Fig. 1 for maps of proviruses from seven additional subjects. (d) Summary of 152 proviral sequences. (e) Short repeats (underlined) identified on both ends of the deletion junctions are consistent with a copy choice mechanism of recombination resulting in deletion of the intervening sequence and one homology region (/number of basepairs deleted/).
Figure 2
Figure 2
Defective proviruses accumulate rapidly during the course of HIV-1 infection. (a—c) Maps of independent proviral clones. Each horizontal bar represents an individual clone identified through full genome sequencing. In cases where a deletion could not be precisely mapped, likely due to a deletion encompassing multiple forward or reverse primer binding sites, the maximum and minimum deletions sizes are plotted (in grey). If sequencing data shows a mapped deletion that removes primer-binding sites for other amplicons, the resulting missing sequence was inferred to be present (light blue or green). A pink arrow denotes full-length, genetically intact sequences. Black asterisks indicate likely full-length hypermutated proviruses that were not fully sequenced due to extreme hypermutation. (a) Sequences from resting CD4+ T cells of three representative subjects treated during acute/early infection (9 subjects total studied). For additional acute/early subject sequences, see Supplementary Fig. 5. (b) Sequences identified following a single round of in vitro infection of healthy donor CD4+ T lymphoblasts with HIV-1 (Ba-L isolate). (c) Sequences from CD4+ T cells from viremic subjects in the chronic phase of infection. (d) Summary of all proviral sequences identified from each study population.
Figure 3
Figure 3
Expanded clones identified in chronically and acutely treated subjects are grossly defective. (a,b) Maps of expanded HIV-1 clones identified in resting CD4+ T cells from subjects treated in acute (a) or chronic (b) infection. Expanded clones are defined as clones amplified in completely independent PCR reactions from a single subject that are identical at every nucleotide. The frequency of each clone is shown relative to the total number of clones identified in that subject. Colored boxes denote the subject in which each expanded clone was identified (see c,d) (c,d) Proportion of sequences from subjects treated during acute (c) or chronic (d) infection that are expanded clones. The number of sequences examined for each subject (n) is noted. Expanded clones (purple/blue) are shown as a percentage of total sequences from the relevant subject.
Figure 4
Figure 4
Current assays significantly underestimate or overestimate the size of the latent reservoir. (a,b) Comparison of different reservoir measurements in resting CD4+ T cells from subjects starting ART during chronic (a) or acute (b) infection. The frequency of infected cells was measured by QVOA, which detects cells that release infectious virus after one round of T cell activation and is reported as the number of infectious units per million resting CD4+ T cells (IUPM). For individuals in whom the IUPM was below the limit of detection, the median posterior estimate of infection frequency was plotted instead (open symbols). The predicted total number of infected cells was calculated for each subject by correcting the ddPCR result (gag+ proviruses) for the fraction of proviruses with deletions in gag. The frequency of cells with intact proviruses was calculated as the frequency of infected cells times the fraction of intact proviruses estimated for each subject using an empirical Bayesian model. Open symbols indicate subjects in which no intact proviruses were detected. Horizontal bars indicate median values. Statistical significance was determined using a two-tailed paired t-test and the variance was similar between groups. *P < 0.05; ** P < 0.01; *** P < 0.001; **** P < 0.0001. (c) Underestimation of the latent reservoir size by the QVOA was calculated by dividing the number of intact proviruses by the QVOA result for each subject. Overestimation of the latent reservoir size by DNA PCR was calculated by dividing the gag+ provirus PCR values by the number of intact proviruses. Horizontal bars indicate median values. (d,e) Comparison of infected cell frequencies as determined by QVOA (pink), analysis of intact proviruses (yellow), and ddPCR for gag+ proviral DNA (blue) for three representative CP- (d) and AP- treated (e) subjects. All values are plotted as a percentage of the frequency of cells with gag+ proviral DNA. The number of gag+ proviruses per million resting CD4+ T cells as measured by ddPCR is indicated in parenthesis for each subject. For additional subject comparison plots, see Supplementary Fig. 7d,e.

References

    1. Finzi D, et al. Identification of a reservoir for HIV-1 in patients on highly active antiretroviral therapy. Science. 1997;278:1295–1300. - PubMed
    1. Chun TW, et al. Presence of an inducible HIV-1 latent reservoir during highly active antiretroviral therapy. Proc Natl Acad Sci USA. 1997;94:13193–13197. - PMC - PubMed
    1. Wong JK, et al. Recovery of replication-competent HIV despite prolonged suppression of plasma viremia. Science. 1997;278:1291–1295. - PubMed
    1. Siliciano JD, et al. Long-term follow-up studies confirm the stability of the latent reservoir for HIV-1 in resting CD4+ T cells. Nat Med. 2003;9:727–728. - PubMed
    1. Ruelas DS, Greene WC. An integrated overview of HIV-1 latency. Cell. 2013;155:519–529. - PMC - PubMed

Publication types

MeSH terms

Substances