. 2016 Aug 8;12(8):e1005809.
doi: 10.1371/journal.ppat.1005809. eCollection 2016 Aug.

The Mechanism for Type I Interferon Induction by Mycobacterium tuberculosis is Bacterial Strain-Dependent

Affiliations

The Mechanism for Type I Interferon Induction by Mycobacterium tuberculosis is Bacterial Strain-Dependent

Kirsten E Wiens et al. PLoS Pathog. .

Abstract

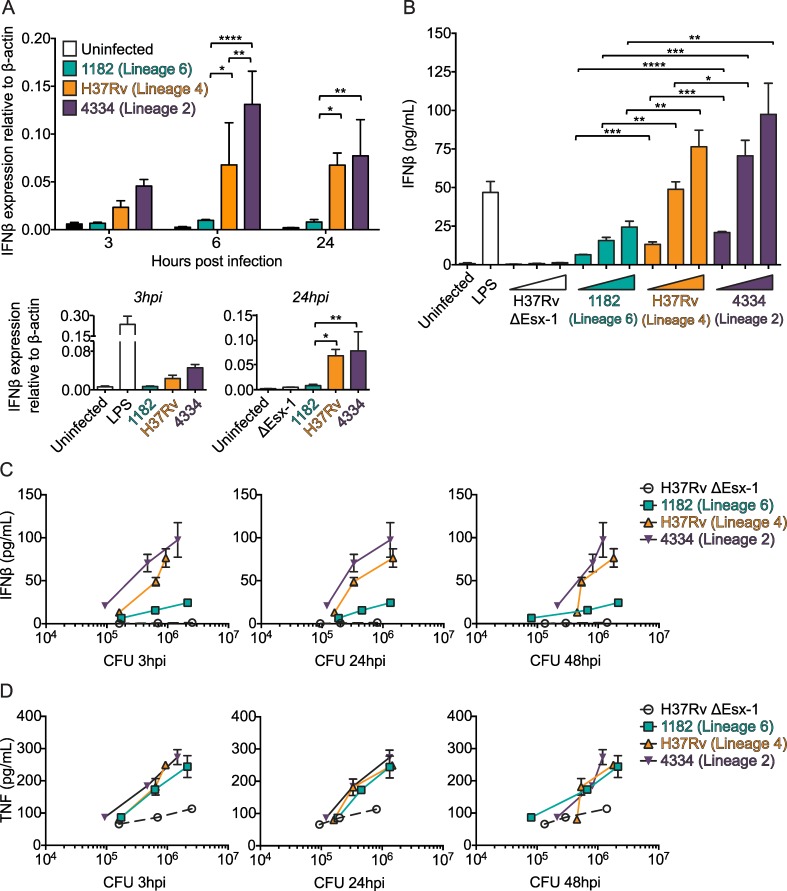
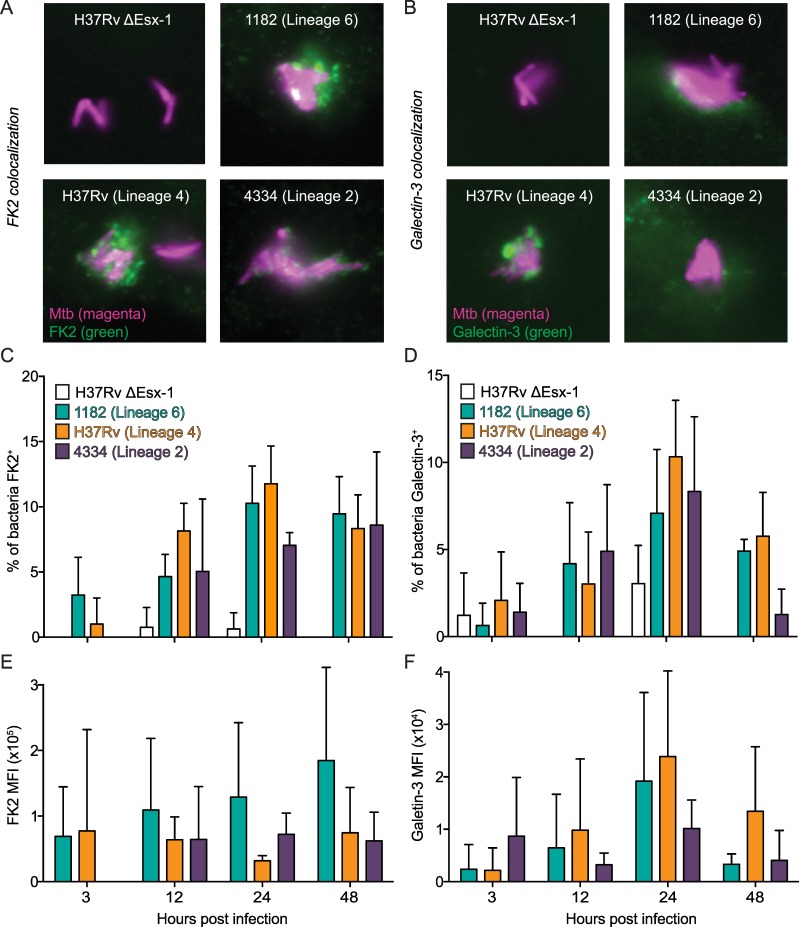
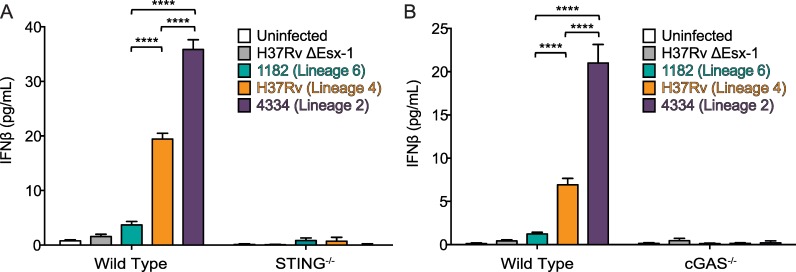
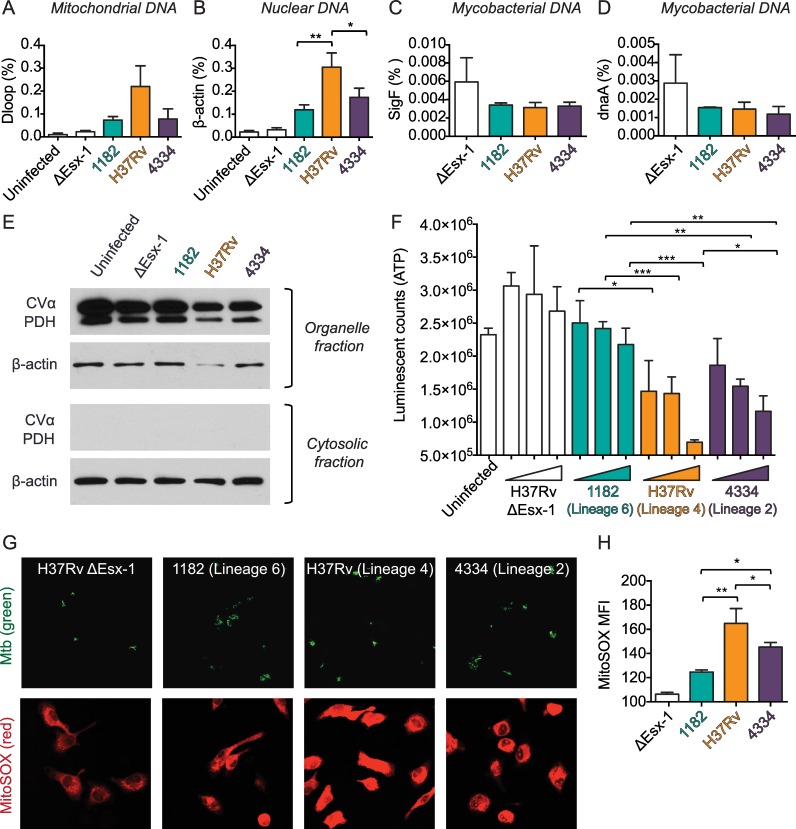
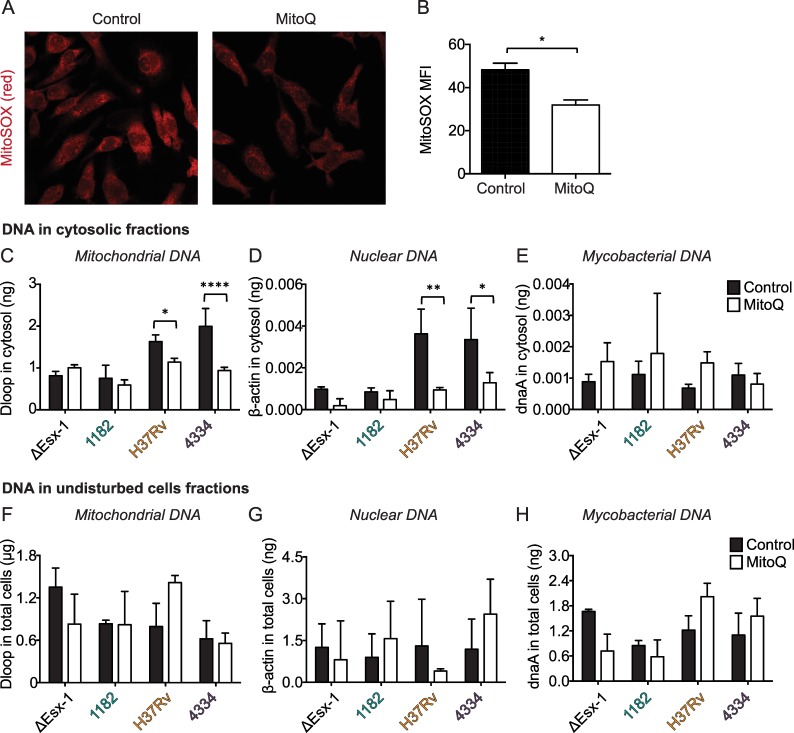
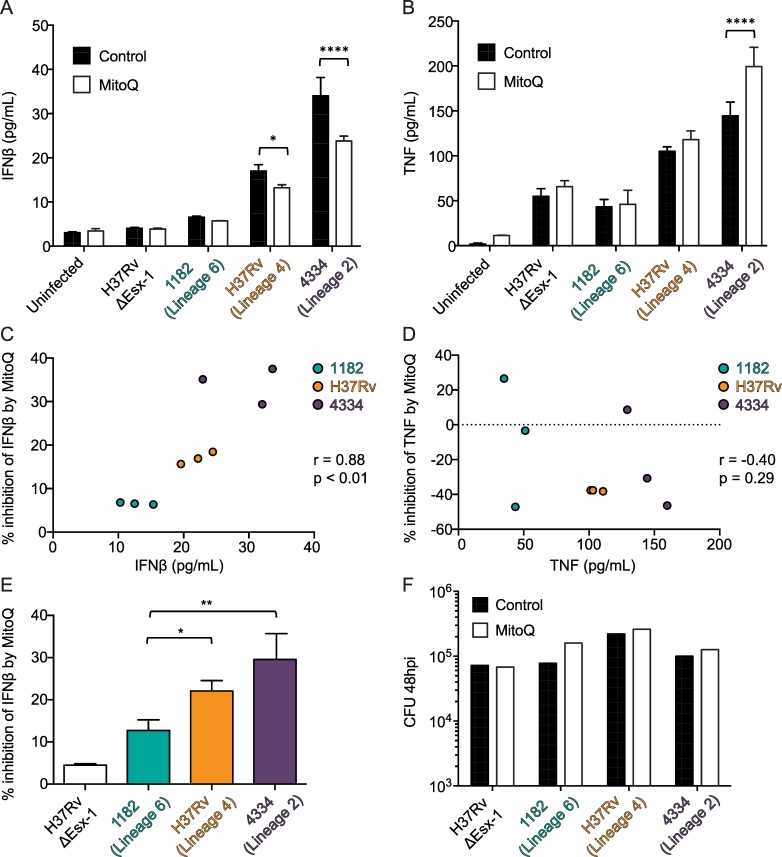
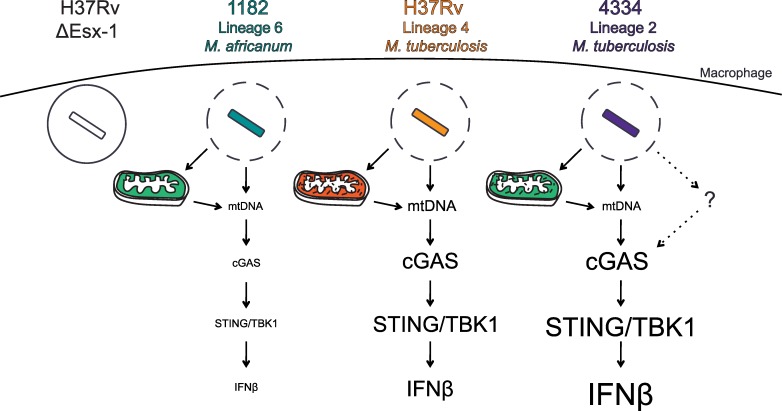
Type I interferons (including IFNαβ) are innate cytokines that may contribute to pathogenesis during Mycobacterium tuberculosis (Mtb) infection. To induce IFNβ, Mtb must gain access to the host cytosol and trigger stimulator of interferon genes (STING) signaling. A recently proposed model suggests that Mtb triggers STING signaling through bacterial DNA binding cyclic GMP-AMP synthase (cGAS) in the cytosol. The aim of this study was to test the generalizability of this model using phylogenetically distinct strains of the Mtb complex (MTBC). We infected bone marrow derived macrophages with strains from MTBC Lineages 2, 4 and 6. We found that the Lineage 6 strain induced less IFNβ, and that the Lineage 2 strain induced more IFNβ, than the Lineage 4 strain. The strains did not differ in their access to the host cytosol and IFNβ induction by each strain required both STING and cGAS. We also found that the three strains shed similar amounts of bacterial DNA. Interestingly, we found that the Lineage 6 strain was associated with less mitochondrial stress and less mitochondrial DNA (mtDNA) in the cytosol compared with the Lineage 4 strain. Treating macrophages with a mitochondria-specific antioxidant reduced cytosolic mtDNA and inhibited IFNβ induction by the Lineage 2 and 4 strains. We also found that the Lineage 2 strain did not induce more mitochondrial stress than the Lineage 4 strain, suggesting that additional pathways contribute to higher IFNβ induction. These results indicate that the mechanism for IFNβ by Mtb is more complex than the established model suggests. We show that mitochondrial dynamics and mtDNA contribute to IFNβ induction by Mtb. Moreover, we show that the contribution of mtDNA to the IFNβ response varies by MTBC strain and that additional mechanisms exist for Mtb to induce IFNβ.


Conflict of interest statement

The authors have declared that no competing interests exist.

Figures

Fig 1
Fig 1. IFNβ induction is bacterial strain-dependent during Mtb infection.
A) BMDM were infected with the indicated mycobacterial strains at an MOI of 5 or stimulated with LPS (10 ng/mL). RNA was harvested for IFNβ mRNA quantification by qRT-PCR at 3, 6, and 24 hr post infection. *p<0.05, **p<0.01, ****p<0.0001 by two-way repeated measures ANOVA with Tukey post-tests; means ± SD (n = 3). B) BMDM were infected with the indicated bacterial strains at MOI of 1, 5, and 10 or stimulated with LPS (10 ng/mL). Supernatants were collected for IFNβ protein quantification by ELISA at 48 hr post infection. *p<0.05, **p<0.01, ***p<0.001, ****p<0.0001 by one-way ANOVA with Tukey post-tests for each MOI; means ± SD (n = 3). Results are representative of 3 independent experiments. C-D) Cell lysates from the experiment shown in Fig 1B were collected at 3, 24, and 48 hr post infection. Colony forming units (CFU) were quantified by serial dilution on 7H11 agar plates. CFU for each MOI at each time point are plotted on the x-axes and the corresponding IFNβ (C) and TNF (D) secretion at 48 hr post infection is plotted on the y-axes.
Fig 2
Fig 2. Access to the host cytosol does not vary by mycobacterial strain.
A-B) BMDM were infected with the indicated dsRed-expressing mycobacterial strains at an MOI of 1. BMDM were fixed overnight and stained for FK2 and Galectin-3 at 3, 12, 24, and 48 hr post infection. Representative images are shown for FK2 colocalization at 48 hr post infection (A) and Galectin-3 colocalization at 24 hr post infection (B), with bacteria shown in magenta and FK2 and Galectin-3 shown in green. C-D) 10 images were captured at 100x magnification for each chamber well and the percent of bacteria that colocalized with FK2 (C) and Galectin-3 (D) was calculated for each strain. E-F) Mean fluorescence intensity (MFI) of the FK2 (E) and Galectin-3 (F) staining directly surrounding each colocalized bacterium was calculated using ImageJ. Results are representative of 1–3 independent experiments. All differences in percent colocalization and MFI between 1182, H37Rv, and 4334 were not significant (p>0.05) by two-way repeated measures ANOVA with Tukey post-tests; means ± SD (n = 4).
Fig 3
Fig 3. IFNβ induction by each MTBC strain is dependent on STING and cGAS.
A) Wild type and STING-/- BMDM were infected with the indicated mycobacterial strains at an MOI of 5. Supernatants were collected for IFNβ protein quantification by ELISA at 48 hr post infection. B) Wild type and cGAS-/- BMDM were infected with the indicated bacterial strains at an MOI of 5. Supernatants were collected for IFNβ protein quantification by ELISA at 48 hr post infection. ****p<0.0001 by two-way ANOVA with Tukey post-tests; means ± SD (n = 3).
Fig 4
Fig 4. Release of host, but not bacterial, DNA into the cytosol is mycobacterial strain-dependent and is associated with mitochondrial stress.
A-D) BMDM were infected with the indicated mycobacterial strains at an MOI of 5. 24 hr post infection, cells were collected and fractionated. Mitochondrial (A), nuclear (B), and bacterial (C,D) DNA in cytosolic fractions was quantified using gene-specific primers and normalized to the amount of each gene in lysates of unfractionated cells (shown as %). *p<0.05, **p<0.01 by one-way ANOVA with Tukey post-tests; means ± SD (n = 3). E) Mitochondrial proteins (CVα and PDH) in the organelle and cytosolic fractions were quantified on immunoblots. β-actin was used as the cytosolic loading control. Results are representative of 2 independent experiments. F) BMDM were cultured in the presence of galactose and absence of glucose for 24 hr and then infected with the indicated mycobacterial strains at MOI of 1, 5, and 10. 24 hr post infection luciferase and luciferin were added to cell lysates and ATP production was measured by luminescence. *p<0.05, **p<0.01, ***p<0.001 by one-way ANOVA with Tukey post-tests for each MOI; means ± SD (n = 3). G-H) BMDM were infected with the indicated GFP-expressing mycobacterial strains at an MOI of 5. Live BMDM were stained with MitoSOX at 24 hr post infection and then fixed overnight. G) Representative images are shown, with Mtb shown in green and MitoSOX shown in red. H) 5 pictures were taken at 60x magnification for each chamber well and mean fluorescence intensity (MFI) of MitoSOX was determined for each infected BMDM using ImageJ. Results are representative of 3 independent experiments. *p<0.05, **p<0.01 by one-way ANOVA with Tukey post-tests; means ± SD (n = 3).
Fig 5
Fig 5. Mitochondrial stress contributes to accumulation of mtDNA in the cytosol during H37Rv/Lineage 4 and 4334/Lineage 2 infections.
A-H) BMDM were treated with MitoQ or control (dTPP) for 4 hours and then infected with the indicated mycobacterial strains at an MOI of 5. A) Uninfected cells were stained with MitoSOX at the time of infection. B) Mean fluorescence intensity (MFI) of MitoSOX was determined using ImageJ. C-H) 24 hr post infection, cells were collected and fractionated. Amount of DNA in cytosolic (C-E) and undisturbed cell (F-H) fractions was determined using gene-specific primers as in Fig 4A–4D; amount in ng or μg was determined using standards that were generated independently of experimental samples and that contained abundant levels of each gene. *p<0.05, **p<0.01, ****p<0.0001 by two-way ANOVA with Sidak post-tests; means ± SD (n = 3).
Fig 6
Fig 6. Mitochondrial stress contributes to IFNβ induction by MTBC strains.
A-F) BMDM were treated with MitoQ or control (dTPP) for 4 hours and then infected with the indicated bacterial strains at an MOI of 5. A-B) 48 hr post infection supernatants were collected for IFNβ (A) and TNF (B) protein quantification by ELISA. *p<0.05, ****p<0.0001 by two-way ANOVA with Sidak post-tests; means ± SD (n = 3). IFNβ results are representative of 3 independent experiments. TNF comparison between control and MitoQ treatment is representative of 3 independent experiments, but the differences in TNF between Mtb strains varied between experiments. C-D) Percent inhibition of IFNβ (C) or TNF (D) induction during MitoQ treatment was calculated for each replicate (n = 3) during infection with each strain. Pearson correlation coefficient (r) of percent inhibition (y-axis) and cytokine secretion (x-axis) is shown. G) Percent inhibition of IFNβ during MitoQ treatment. *p<0.05, **p<0.01 by one-way ANOVA with Tukey post-tests; means ± SD (n = 3). F) Lysates from replicates (n = 3) of the experiment shown in Fig 6A–6E were pooled and CFU were quantified by serial dilution on 7H11 agar plates.
Fig 7
Fig 7. Model for mycobacterial strain-dependent IFNβ induction.
We propose a model in which mitochondrial stress and mtDNA contribute to IFNβ induction by Mtb. 1182/Lineage 6 accesses the host cytosol to the same extent as H37Rv/Lineage 4 and 4334/Lineage 2. However, this strain induces less mitochondrial stress and less accumulation of mtDNA in the cytosol, which contributes to lower IFNβ induction. H37Rv/Lineage 4 induces more mitochondrial stress and more accumulation of mtDNA in the cytosol, which contributes to increased IFNβ induction. Our data suggest that 4334, and perhaps other strains, provide an additional cGAS signal that has not yet been discovered.

References

    1. McNab F, Mayer-Barber K, Sher A, Wack A, O'Garra A. Type I interferons in infectious disease. Nature reviews Immunology. 2015;15(2):87–103. 10.1038/nri3787 . - DOI - PMC - PubMed
    1. Maertzdorf J, Ota M, Repsilber D, Mollenkopf HJ, Weiner J, Hill PC, et al. Functional correlations of pathogenesis-driven gene expression signatures in tuberculosis. Plos One. 2011;6(10):e26938 Epub 2011/11/03. 10.1371/journal.pone.0026938 - DOI - PMC - PubMed
    1. Berry MP, Graham CM, McNab FW, Xu Z, Bloch SA, Oni T, et al. An interferon-inducible neutrophil-driven blood transcriptional signature in human tuberculosis. Nature. 2010;466(7309):973–7. Epub 2010/08/21. 10.1038/nature09247 - DOI - PMC - PubMed
    1. Teles RM, Graeber TG, Krutzik SR, Montoya D, Schenk M, Lee DJ, et al. Type I interferon suppresses type II interferon-triggered human anti-mycobacterial responses. Science. 2013;339(6126):1448–53. Epub 2013/03/02. 10.1126/science.1233665 - DOI - PMC - PubMed
    1. Mayer-Barber KD, Andrade BB, Oland SD, Amaral EP, Barber DL, Gonzales J, et al. Host-directed therapy of tuberculosis based on interleukin-1 and type I interferon crosstalk. Nature. 2014;511(7507):99–103. 10.1038/nature13489 . - DOI - PMC - PubMed

Publication types

Substances