. 2016 Aug 8;11(8):e0159961.
doi: 10.1371/journal.pone.0159961. eCollection 2016.

Spectral Cytometry Has Unique Properties Allowing Multicolor Analysis of Cell Suspensions Isolated from Solid Tissues

Affiliations

Spectral Cytometry Has Unique Properties Allowing Multicolor Analysis of Cell Suspensions Isolated from Solid Tissues

Sandrine Schmutz et al. PLoS One. .

Abstract

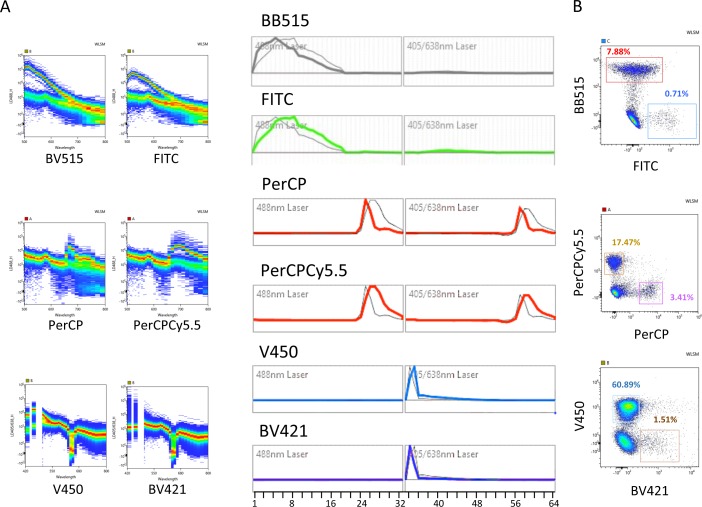
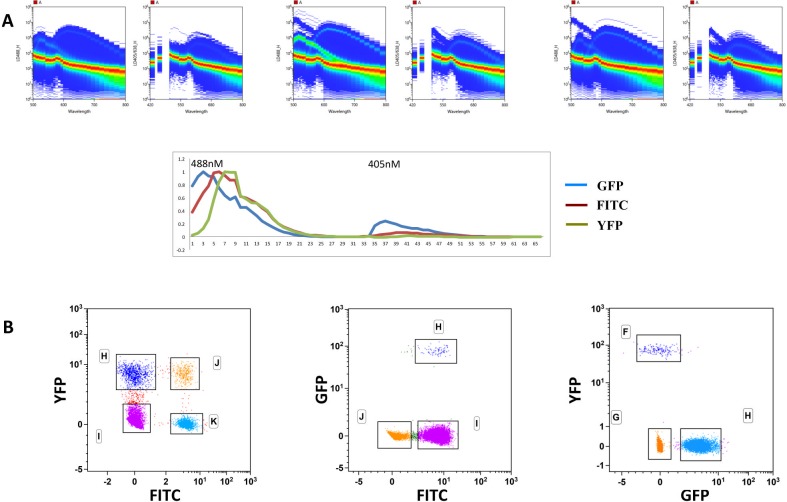
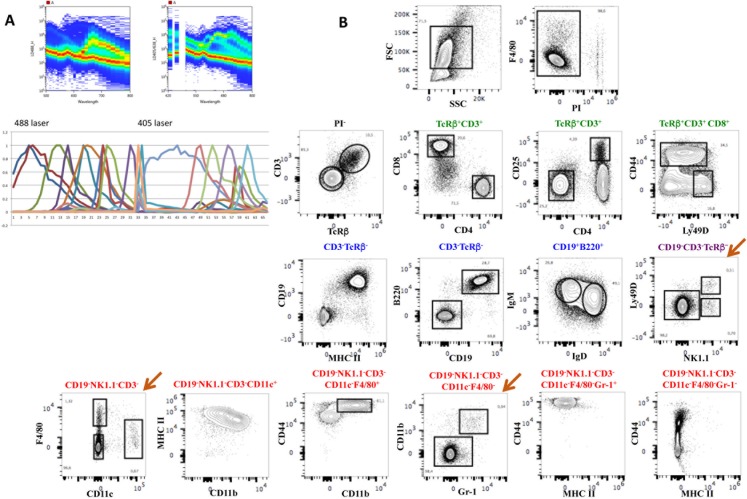
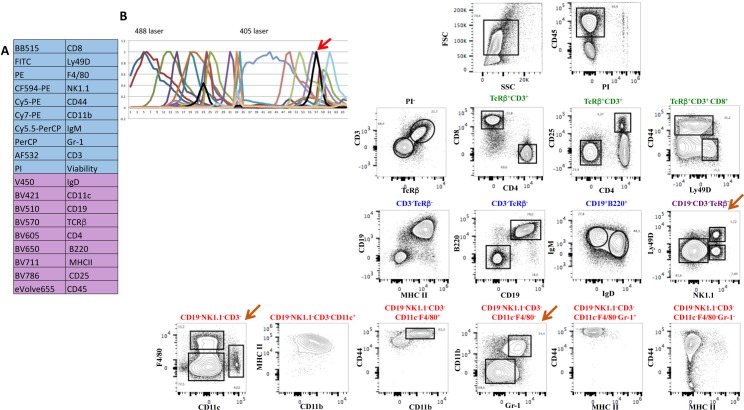
Flow cytometry, initially developed to analyze surface protein expression in hematopoietic cells, has increased in analytical complexity and is now widely used to identify cells from different tissues and organisms. As a consequence, data analysis became increasingly difficult due the need of large multi-parametric compensation matrices and to the eventual auto-fluorescence frequently found in cell suspensions obtained from solid organs. In contrast with conventional flow cytometry that detects the emission peak of fluorochromes, spectral flow cytometry distinguishes the shapes of emission spectra along a large range of continuous wave lengths. The data is analyzed with an algorithm that replaces compensation matrices and treats auto-fluorescence as an independent parameter. Thus, spectral flow cytometry should be capable to discriminate fluorochromes with similar emission peaks and provide multi-parametric analysis without compensation requirements. Here we show that spectral flow cytometry achieves a 21-parametric (19 fluorescent probes) characterization and deals with auto-fluorescent cells, providing high resolution of specifically fluorescence-labeled populations. Our results showed that spectral flow cytometry has advantages in the analysis of cell populations of tissues difficult to characterize in conventional flow cytometry, such as heart and intestine. Spectral flow cytometry thus combines the multi-parametric analytical capacity of the highest performing conventional flow cytometry without the requirement for compensation and enabling auto-fluorescence management.


Conflict of interest statement

Competing Interests: The authors have declared that no competing interests exist.

Figures

Fig 1
Fig 1. Spectral cytometry allows separating fluorescent probes with close emission peaks.
Mouse splenic cells were labeled with fluorescence labeled antibodies. Two different representations of the spectra of dyes with very close emission wavelengths are shown after excitation with the blue: FITC-Ly49D (green) and BB515-CD8 (grey), PerCP-Gr-1 and Cy5.5-PerCP-IgM (red) or the violet laser: V450-IgD (blue) and BV421-CD11c (purple) (A) and can be discriminated on pseudo-color plots after the unmixing algorithm was applied (B).
Fig 2
Fig 2. Spectral cytometry allows separating FTIC, from GFP and YFP.
Splenic cells from wild type C57BL/6 mice, from a RoRγt-Cre:Rosa26FL-STOP-YFP and from a ubiquitin-GFP CD8-TcR transgenic mouse were mixed two-by-two in similar proportions, stained with anti-CD8 FITC antibody and analyzed in spectral FCM. A. Plots showing the spectra on the two excitation lasers (left plot 488nm and right plot 405nm) of FITC with YFP and PI (left panels), FITC with GFP and PI (middle panels) and GFP with YFP and PI. The lower diagram shows the reference florochrome spectra shape calculated on single stained samples with GFP, FITC and YFP. B. Plots corresponding to the three independent unmixings of the two-by-two cell combinations. In all samples PI was added to exclude dead cells. The analysis was done in the Kaluza 1.5 software and the scales were readjusted in the FITC:YFP lower left plot.
Fig 3
Fig 3. Spectral cytometry allows separating fluorescent probes with virtually identical peaks although with different shapes of the emission spectra.
Small differences in the spectra shapes of BV605-CD4 (yellow) and eVolve605-CD62L (orange), and BV650-B220 (red) and eVolve655-CD45 (grey) (A) allow the discrimination between these four dyes when stainings were done with the four dyes together staining mouse spleen cells (B). C. Histogram showing the discrimination of CD45-eVolve655 positive from negative cells D. Fluorescence minus one (FMO) plots show the percentage of the populations when one dye is missing and the resulting strategy to place the quadrants. Data was analyzed in the Kaluza1.5 software.
Fig 4
Fig 4. An 18-color antibody panel for the analysis of murine spleen cells.
Multi-color antibodies panel with 18 different antibody-labeled fluorochromes, excited by the 488nm laser (blue) and by the 405nm laser (purple) (see Fig 5). The complex emission spectra of all fluorochromes are shown in the 488nm (upper left panel) and in the 405nm lasers (upper right panel) and in reference fluorochrome spectra shape with each colored curve corresponding to a different fluorochrome (lower panel)(B). C. The contour plots show the discriminative capacity of this multi-parametric analysis to separate the different populations of B, T, NK, dendritic or myeloid cells. The brown arrow shows rare subsets of NK and myeloid cells. The analysis was done in the FlowJo software after deconvolution.
Fig 5
Fig 5. One additional fluorescent dye in the panel did not alter the discrimination of the splenocyte subsets.
Mouse splenocytes were stained with the previous antibody combination to which CD45-eVolve655 was added. Panel A shows the list of antibodies and fluorochromes used in the experiment. B. The reference spectra of all fluorochromes are shown. The black line shows the reference spectrum of the newly added CD45-eVolve655 (pointed with a red arrow). C. The distribution of the populations was not altered by the introduction of an additional fluorochrome and rare cell subsets were now easily detected (brown arrow). The analysis was done in the FlowJo software after deconvolution.
Fig 6
Fig 6. The presence of auto-fluorescent cells does not impair the detection of intra-epithelial lymphocytes, in spectral FCM.
Small intestinal cells comprising epithelial cells and lymphocytes were stained with antibodies recognizing TcRδ-ΠE, TcRβ-Cy7-APC, X∆3-Pacific Blue, Vγ7-APC, CD8-FITC and Vδ4-Cy7-PE. PI was added in the FACS buffer before analysis. The acquisition of the data was done sequentially in the three instruments after appropriate quality control. Doublets were eliminated in the FSC-H/FSC-W. The analysis was done in the Kaluza 1.5 software. Plots show the different steps of the gating strategy. Cells within the FSC-A/SSC-A lymphocyte gate are labeled in blue while cells within the intestinal epithelial cell gate are labeled in red. Arrows point to different population distortions and auto-fluorescence. The first column from the left corresponds to data obtained in instrument B-LSR Fortessa (BD Biosciences); the second, to data obtained in instrument C-Cytoflex (Beckman Coulter); the third and fourth to data obtained in spectral FCM-SP6800 (Sony Inc.) without and with (SP6800 AF) auto-fluorescent management, respectively, after deconvolution.
Fig 7
Fig 7. A large subset of auto-fluorescent cells in E17.5 cardiac cell preparations can be included in the fluorescence analysis, in spectral FCM.
Embryonic hearts were isolated and sequentially digested with collagenase with mechanical dissociation at the end of each of seven consecutive digestion cycles. Cell suspensions were stained with antibodies anti TER119 and CD45-PE, Sca-1-Cy5-PE and CD31-APC. Acquisition of the data in the three instruments was done sequentially. Black arrows show auto-fluorescent cells in the two conventional cytometers while these cells are not detected as auto-fluorescent in spectral cytometry and can thus be analyzed for specific fluorescent staining. Instrument A is a Canto II and B a LSR Fortessa (BD Biosciences). B. Auto-fluorescent cells (within the elliptical gate in green) and CD31+ cells (rectangular gate in blue), taken as negative control, were sorted into lysis buffer and subjected to Q-RT-PCR that quantified cardiac troponin (TNNT2) [13] and atrial light chain-2 (MYL7) [14] transcripts specific for cardiomyocytes and not found in endothelial, stromal or hematopoietic cells. a.u. arbitrary units calculated relative to the expression of the house-keeping transcript GAPDH.

References

    1. Futamura K, Sekino M, Hata A, Ikebuchi R, Nakanishi Y, Egawa G et al. (2015) Novel full-spectral flow cytometry with multiple spectrally-adjacent fluorescent proteins and fluorochromes and visualization of in vivo cellular movement. Cytometry A 87: 830–842. 10.1002/cyto.a.22725 - DOI - PMC - PubMed
    1. Roederer M (2002) Multiparameter FACS analysis. Curr Protoc Immunol Chapter 5: Unit 5.8. - PubMed
    1. Perfetto SP, Chattopadhyay PK, Roederer M (2004) Seventeen-colour flow cytometry: unravelling the immune system. Nat Rev Immunol 4: 648–655. - PubMed
    1. Eberl G, Littman DR (2004) Thymic origin of intestinal alphabeta T cells revealed by fate mapping of RORgammat+ cells. Science 305: 248–251. - PubMed
    1. Vonarbourg C, Mortha A, Bui VL, Hernandez PP, Kiss EA, Hoyler T et al. (2010) Regulated expression of nuclear receptor RORγt confers distinct functional fates to NK cell receptor-expressing RORγt(+) innate lymphocytes. Immunity 33: 736–751. 10.1016/j.immuni.2010.10.017 - DOI - PMC - PubMed

Substances