. 2017 Feb 1;595(3):865-881.
doi: 10.1113/JP272791. Epub 2016 Sep 15.

Convergence of visual and whisker responses in the primary somatosensory thalamus (ventral posterior medial region) of the mouse

Affiliations

Convergence of visual and whisker responses in the primary somatosensory thalamus (ventral posterior medial region) of the mouse

Annette E Allen et al. J Physiol. .

Abstract

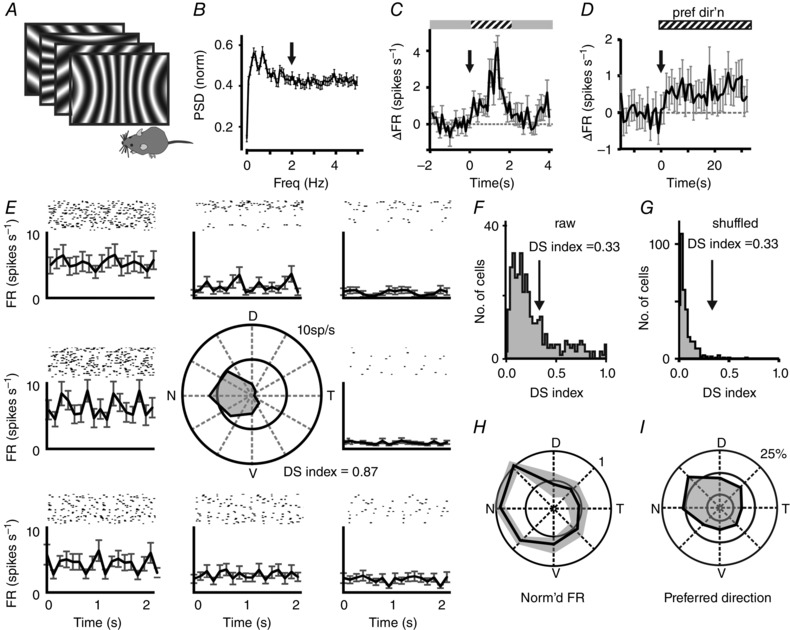
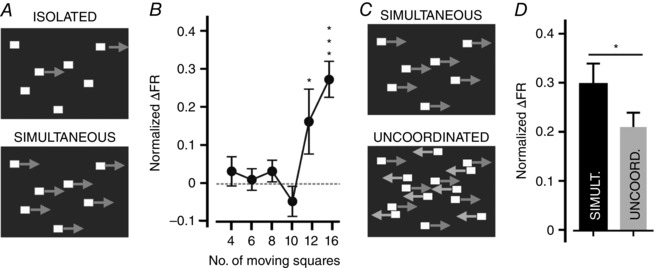
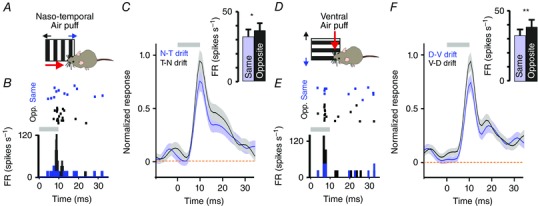
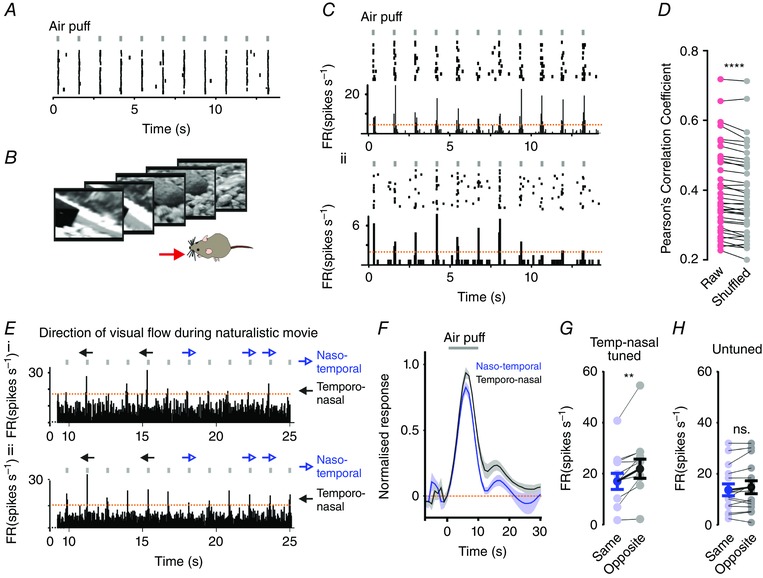
Key points: Using in vivo electrophysiology, we find that a subset of whisker-responsive neurons in the ventral posterior medial region (VPM) respond to visual stimuli. These light-responsive neurons in the VPM are particularly sensitive to optic flow. Presentation of optic flow stimuli modulates the amplitude of concurrent whisker responses. Visual information reaches the VPM via a circuit encompassing the visual cortex. These data represent a new example of cross-modal integration in the primary sensory thalamus.

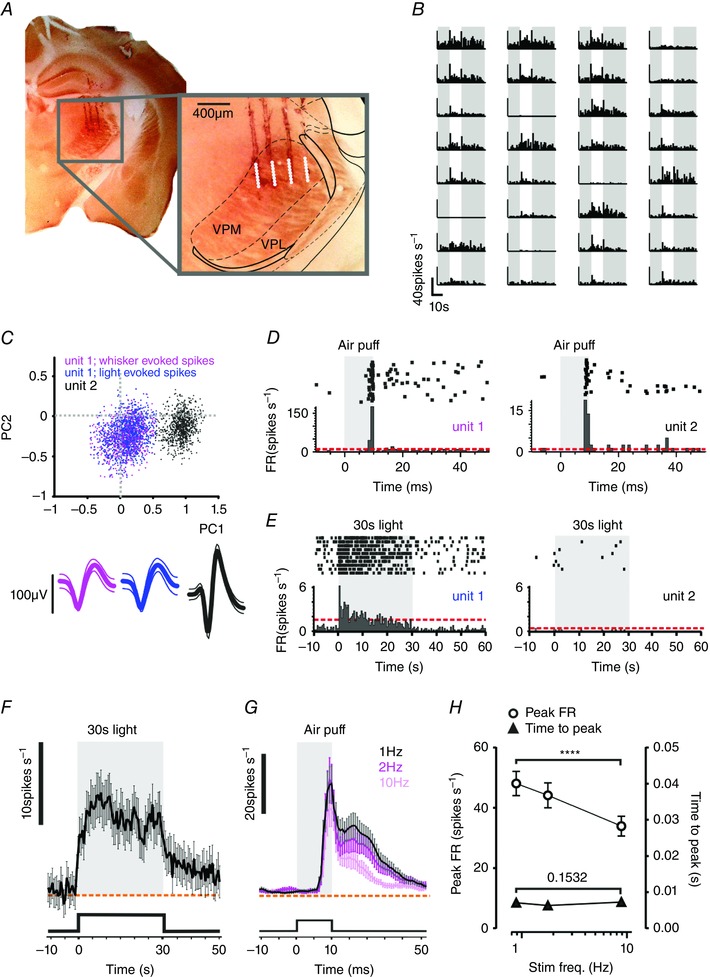
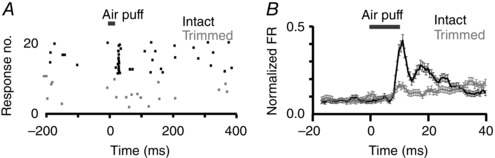
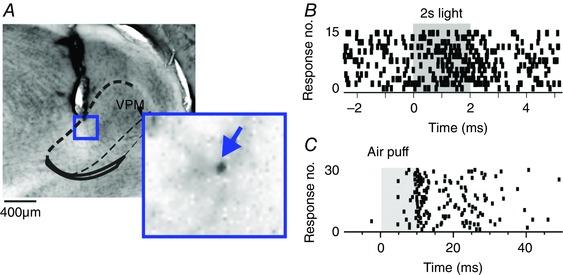
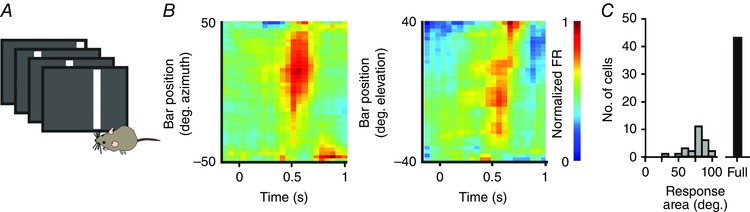
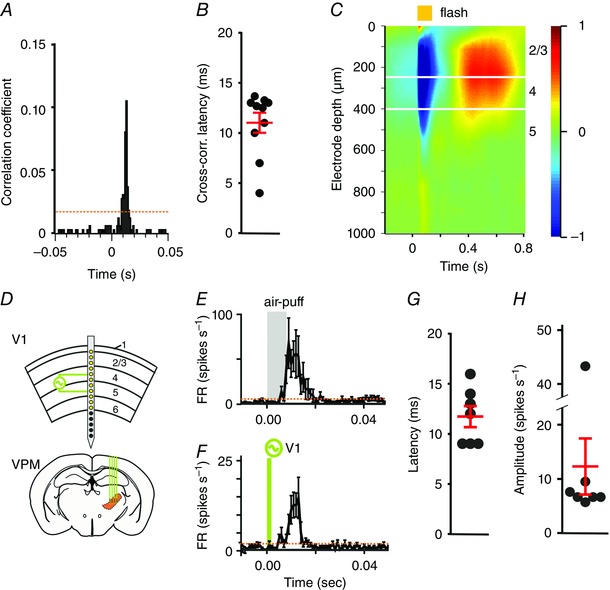
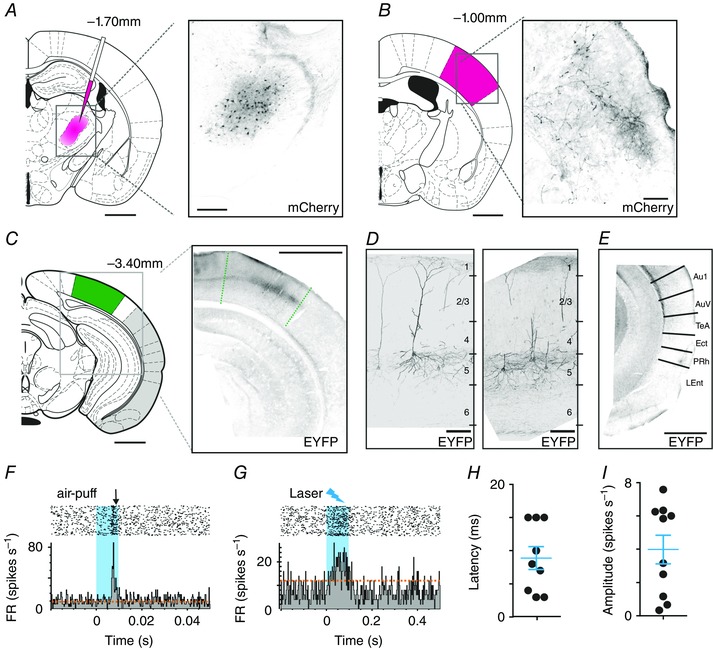
Abstract: Sensory signals reach the cortex via sense-specific thalamic nuclei. Here we report that neurons in the primary sensory thalamus of the mouse vibrissal system (the ventral posterior medial region; VPM) can be excited by visual as well as whisker stimuli. Using extracellular electrophysiological recordings from anaesthetized mice we first show that simple light steps can excite a subset of VPM neurons. We then test the ability of the VPM to respond to spatial patterns and show that many units are excited by visual motion in a direction-selective manner. Coherent movement of multiple objects (an artificial recreation of 'optic flow' that would usually occur during head rotations or body movements) best engages this visual motion response. We next show that, when co-applied with visual stimuli, the magnitude of responses to whisker deflections is highest in the presence of optic flow going in the opposite direction. Importantly, whisker response amplitude is also modulated by presentation of a movie recreating the mouse's visual experience during natural exploratory behaviour. We finally present functional and anatomical data indicating a functional connection (probably multisynaptic) from the primary visual cortex to VPM. These data provide a rare example of multisensory integration occurring at the level of the sensory thalamus, and provide evidence for dynamic regulation of whisker responses according to visual experience.

Keywords: VPM; multisensory; thalamus; vision.


Figures

Figure 1
Figure 1. Visual responses in the mouse VPM
A and B, a representative placement of our 4 × 8 multichannel recording probe in the mouse VPM (A) and associated light responses (B). A, half coronal section in which tracks of the four‐shank electrode are visible owing to tissue damage and deposition of DiI applied to the probe prior to insertion. Inset shows expanded view of recording site with approximate boundaries of major brain nuclei. Location of the VPM was confirmed with cytochrome oxidase staining (brown). B, multi‐unit, light‐evoked changes in firing rate at each of 32 recording sites for this placement. Responses are mean change in firing rate to 10 presentations of a full field 10 s stimulus. Grey bars indicate periods of darkness before and after visual stimulus. C, separation of two representative single units by principal component analysis. Scatter plot shows first two principal components (PC1 and PC2) of two separated units; waveforms underneath show spikes from unit 1 elicited by whisker (pink) and light (blue) stimuli and from the separated unit 2 (black). D and E, peri‐event raster (above) and histograms for units 1 and 2 from C over multiple presentations of whisker (D, 10 ms air‐puff moving contralateral whiskers) or light (E, 30 s contralateral full field stimulus; 14.9 log photons cm–2 s–1) stimuli. Grey shading indicates stimulus presentation. F, mean ± SEM firing rate of all neurons classed as light responsive (77/231 units recorded in seven mice) in response to 30 s contralateral full field stimulus. Orange dashed line shows baseline firing rate. Grey shading indicates stimulus presentation. G, mean ± SEM firing rate of VPM neurons in response to 10 ms air puff at 1, 2 and 10 Hz (black, pink and pale pink, respectively; n = 46 units). Grey shading indicates stimulus presentation. H, quantification of response amplitude and latency of whisker responses in light responsive units at three tested frequencies; RM one‐way ANOVAs of these parameters revealed significant differences in amplitude (circles; P < 0.0001) but not latency (triangles; P = 0.15). Data show mean ± SEM changes in firing rate (n = 46). [Colour figure can be viewed at wileyonlinelibrary.com]
Figure 2
Figure 2. Clipping whiskers abolished responses to air‐puff stimuli
A, raster plot of a representative unit to 10 ms whisker stimulus with intact (black) and trimmed (grey) whiskers. B, mean ± SEM normalized firing rate of all whisker responsive neurons (n = 144) before (black) and after (grey) whisker trimming. Grey bars indicate air‐puff stimulus.
Figure 3
Figure 3. Single channel isolation of cross‐modal responses in VPM
A, histological section (approximate boundaries of VPM indicated with dashed lines), in which the tract of a single channel, high‐impedance glass electrode probe is visible. Inset shows magnification of cellular iontophoretical deposition of Chicago Sky Blue, highlighted with blue arrow. B and C, raster plots of a representative single unit isolated with high‐impedance electrode in response to light [B; 15 presentations of a full field 2 s stimulus to contralateral eye (grey shading indicates light presentation) and whisker stimuli (C; 30 presentations of a 10 ms air puff, moving contralateral whiskers (grey shading indicates air‐puff presentation)]. [Colour figure can be viewed at wileyonlinelibrary.com]
Figure 4
Figure 4. Spatial receptive fields of VPM light responses
A, cartoon showing receptive field mapping protocol, comprising presentation of bars (500 ms duration, each bar occupying 12.5 deg of visual space) at changing spatial locations. B, heat maps for a representative neuron showing the mean normalized firing rate over time (x‐axis) to the presentation of bars (as depicted in A) at various positions in space (y‐axis). Left panel shows responses to vertical bars and right panel to horizontal bars. C, histogram showing the distribution of neurons (n = 69) responding over particular areas of visual space, plus the population of neurons that responded only to full field stimulation. [Colour figure can be viewed at wileyonlinelibrary.com]
Figure 5
Figure 5. Units in the VPM respond to visual motion
A, cartoon depicting presentation of drifting grating stimuli, which were presented drifting in eight directions [0.24 cycles per degree (cpd); inversion every 500 ms]. Gratings were adjusted to account for variations in visual angle, so that stimuli presented in the centre or extremes of the monitor occupied an equivalent area of visual space. B, mean ± SEM normalized power spectral density (PSD) of 160 light‐responsive neurons. Power spectral densities were computed for all light‐responsive neurons following onset of drifting gratings; no neuron showed a statistical change in power at 2 Hz (arrow) during presentation of drifting grating. C, mean ± SEM firing rate of a subset of neurons (n = 28/160) in response to a transition from grey screen to drifting gratings (2 s presentation of 0.24 cpd grating). Data show baseline‐subtracted change in firing rate for drift responsive neurons. Transition from grey to grating stimulus is depicted above, and with arrow. D, mean ± SEM change in firing rate of all DS cells (DS index > 0.33) upon switching to their preferred direction of movement (n = 107) from a (random) alternative direction of motion. Data show baseline‐subtracted change in firing rate. Transition from gratings of one direction to another is depicted above and with arrow. E, the firing rate of an example unit to visual gratings drifting in eight directions (positioned clockwise relative to the direction of motion). For each direction, a double plot of the mean ± SEM firing rate is shown in the lower panel, with raster plots of each repeat shown above. Polar plot in centre shows mean firing rate during presentation of drifting gratings in each direction. D = dorsal, V = ventral, T = temporal, N = nasal. This particular neuron has a high DS index of 0.87. F and G, the direction selective index for all units is plotted in F as a histogram (data shows DS index at 0.24 cpd for all units isolated from VPM; n = 368). A threshold of > 0.33 was used to categorize cells as direction selective (DS), indicated with arrow. A similar histogram produced for a shuffled version of the data is clustered at low DS indices (G). H, polar plot showing the normalized firing rate (mean ± SEM for four presentations) from a representative cell showing that the pattern of firing for different directions was retained across repeated presentations. D = dorsal, V = ventral, T = temporal, N = nasal. I, polar plot showing the distribution of preferred direction of motion at 0.24 cpd for all DS neurons (n = 95). D = dorsal, V = ventral, T = temporal, N = nasal.
Figure 6
Figure 6. The VPM response to coordinated visual motion
A, schematics of the stimuli used to test responses to coordinated visual motion. ‘Isolated’ motion (top panel) was created by varying the numbers of these squares remaining static (between four and 12 squares). ‘Simulataneous’ motion (lower panel) was created by coordinated horizontal movement of 16 white evenly sized squares (12.5 × 12.5 deg of visual space) on a black background. B, mean ± SEM normalized change in firing rate (relative to baseline) of light‐responsive neurons (n = 78) during isolated motion of between four and 16 squares. Amplitudes were compared with a one‐way ANOVA with a Dunnett's post hoc test comparing each condition with that of no movement; only when 12 or all 16 squares were moving was a significant increase in firing rate induced (* P < 0.05; *** P < 0.001). C, ‘uncoordinated’ motion (lower panel) was generated by introducing another 16 white squares moving horizontally in the opposite direction. D, mean ± SEM normalized change in firing rate (relative to baseline) during presentation of simultaneous or uncoordinated motion (compared with paired two‐tailed t test; P = 0.03, n = 18).
Figure 7
Figure 7. Visual motion modulates the amplitude of whisker responses
A, cartoon depicting stimulation of whiskers (naso‐temporal whisker deflection; red arrow) with co‐application of naso‐temporal or temporo‐nasal drifting gratings (blue and black arrows, respectively). B, raster plot (upper panel) and PSTH (lower panel) of responses of a representative unit to naso‐temporal whisker deflections (10 ms 1 Hz air puff stimulus at time 0) during co‐applied drifting gratings moving in the same (naso‐temporal; blue rasters/PSTH) or opposite (temporo‐nasal; black rasters/PSTH) direction. Grey bar indicates presentation of air‐puff. C, mean ± SEM PSTHs of normalized firing rate for units responding to naso‐temporal whisker deflections (10 ms 1 Hz air puff stimulus at time 0) recorded during co‐application of a visual grating moving in the same (blue) or opposite (black) direction. Inset: mean ± SEM peak change in firing rate when gratings were co‐applied in the same or opposite direction (paired two‐tailed t test: * P = 0.04). Grey bar indicates presentation of air‐puff. D–F, as A–C for units that responded to ventral whisker deflections (n = 99) and exposed to ventral (same) or dorsal (opposite) drifting gratings. The amplitudes of whisker responses (F, inset) were significantly different in the presence of visual gratings drifting in the same vs. opposite direction (paired two‐tailed t test: ** P = 0.0073). [Colour figure can be viewed at wileyonlinelibrary.com]
Figure 8
Figure 8. Whisker responses are tuned by a naturalistic representation of visual motion
A, a representative VPM unit showing highly reproducible responses to repeated whisker stimulations when presented in the dark (raster plot of spikes over 30 repeats of a 15 s trail of air‐puffs). Timing of air puffs is indicated above rasters with grey bars. B, example frames taken from a 33 s movie that was presented during co‐application of a whisker stimulus. C, responses of two representative units shown as rasters (upper panels) and mean PSTHs (lower panels) to whisker stimuli (indicated by black bars above raster plots) during co‐presentation of a 33 s naturalistic movie (responses shown to 15 repeats of movie). Timing of air puffs is indicated above rasters with grey bars. D, aligned scatter plot of Pearson's correlation coefficient calculated for activity across 30 repeats of the movie (red circles) and for shuffled versions of the data (grey circles; activity still aligned to whisker stimulus but shuffled across movie phase) in 39 whisker/light‐responsive units (paired two‐tailed t test: P < 0.0001). E, portions of the naturalistic movie that contained epochs of coherent visual motion are indicated above the PSTHs from two representative VPM units, which were tuned to temporo‐nasal visual motion (as determined by responses to drifting gratings). Black arrows indicate motion in preferred (temporo‐nasal) direction; blue arrows in anti‐preferred (naso‐temporal) direction. Timing of air puffs is indicated above rasters with grey bars. Orange dashed lines show confidence interval based on 2× standard deviations of baseline firing rate. F, mean ± SEM normalized firing rate in response to whisker stimulation during epochs of the naturalistic movie containing preferred or anti‐preferred motion. Data show responses of direction‐selective neurons tuned to temporo‐nasal motion (n = 10). Grey bar indicates presentation of air‐puff. G and H, mean ± SEM change in firing rate in response to whisker stimuli for direction‐selective neurons tuned to temporo‐nasal motion (G; n = 10) or untuned neurons (H; n = 15) during epochs of the naturalistic movie containing temporo‐nasal (black) or naso‐temporal (blue) motion. Neurons tuned to temporo‐nasal motion showed significant differences in amplitude to naso‐temporal whisker deflections during visual motion occurring in the opposite vs. same direction (paired two‐tailed t test ** P < 0.01); untuned neurons showed no significant difference in response amplitude (paired two‐tailed t test, P > 0.05). [Colour figure can be viewed at wileyonlinelibrary.com]
Figure 9
Figure 9. Influence of V1 on VPM physiology
A, cross‐correlation of spiking as a function of latency (0 = time of spike in V1) for a representative pair of V1 and VPM neurons showing significant correlation (orange dashed line shows confidence interval based on 2× standard deviations of baseline). B, scatter of delay between firing in V1 vs. VPM for all V1 and VPM pairs showing significant correlation. Red lines indicate mean ± SEM. C, current source density (normalized CSD; −1 to 1) analysis was used to define depth from cortical surface of recording sites of a 1 × 16 probe inserted into V1. A 100 ms flash (time 0; indicated with yellow bar) evoked a laminar response profile, with a current sink in a deep layer (blue) spreading more superficially, followed by a current source (red); based upon previous reports we define these events as centred on layer 4 and 2/3, respectively (Niell & Stryker, 2008). This analysis was used to identify electrodes spanning layers 4 and 5 for electrical stimulation. D, cartoon depicting location of recording/stimulating electrode sites in representative placement of 1 × 16 recording probe relative to cortical layers (figures to right) derived from data in C, and recording probe inserted into VPM. Green lines show electrode sites spanning layers 4 and 5 used for electrical stimulation. E and F, responses of a representative unit in VPM are shown in response to 100 presentations of a 1 Hz 10 ms whisker stimulus (E) and to 100 presentations of a 1 Hz 100 μs current reversal in V1 (F). Data show mean ± SEM. Orange dashed lines show confidence interval based on 2× standard deviations of baseline firing rate. G and H, scatter of response latency (G) and amplitude (H) of neurons in VPM (7/50 whisker responsive neurons from two mice) responding to V1 electrical stimulation. Red lines indicate mean ± SEM. [Colour figure can be viewed at wileyonlinelibrary.com]
Figure 10
Figure 10. Mapping the connectivity of V1 and VPM
A, viral tracing of connections to VPM. Left panel shows schematic depiction of injection site of AAV‐EF1a‐mCherry‐IRES‐WGA‐Cre virus (pink). Right panel shows representative coronal section of VPM, showing associated mCherry expression (black). Scale bars = 1 mm and 250 μm. B, left panel: schematic depiction of S1 within full coronal section. Right panel: mCherry‐positive fibres (black) of primary transfected neurons in a representative coronal section of S1 (scale bars = 1 mm). C, left panel: schematic depiction of V1 within full coronal section. Right panel: EYFP‐expressing neurons (black) in a representative coronal section of V1 (scale bars = 1 mm). D, expanded view of EYFP‐expressing cells (black) in coronal section of V1; figures to right represent approximate location of cortical layers. No mCherry expression was found in V1 (channel not shown). Scale bars = 100 μm. E, EYFP expression in other cortical regions (regions highlighted in grey in C). No EYFP signal (shown in black) was found in these regions (using equivalent exposure and gain). Abbreviations: Au1 – primary auditory cortex; AuV – secondary auditory cortex, ventral region; TeA – temporal association cortex; Ect – ectorhinal cortex; PRh – perirhinal cortex; LEnt – lateral entorhinal cortex . Scale bar = 1 mm. F, responses of a representative VPM single unit to repeated whisker stimulation (100 repeats 1 Hz 10 ms airpuff; blue bar indicates stimulus presentation). Upper panels show raster plots to individual stimulus repeats, and lower panels associated mean PSTH (orange dashed lines depict 2× standard deviations above baseline firing). G, responses of the same VPM unit shown in F to optogenetic activation of neurons in V1 (1 Hz presentation of 100 ms blue laser stimulus; blue bar indicates stimulus presentation). Upper panels show raster plots to individual stimulus repeats, and lower panels associated mean PSTH (orange dashed lines depicts 2× standard deviations above baseline firing). H and I, mean latency (H) and amplitude (I) of laser‐evoked firing in nine VPM units (n = 2 mice) responding to optogenetic stimulation of V1. [Colour figure can be viewed at wileyonlinelibrary.com]

References

    1. Ahissar E, Sosnik R & Haidarliu S (2000). Transformation from temporal to rate coding in a somatosensory thalamocortical pathway. Nature 406, 302–306. - PubMed
    1. Allen AE, Brown TM & Lucas RJ (2011). A distinct contribution of short‐wavelength‐sensitive cones to light‐evoked activity in the mouse pretectal olivary nucleus. J Neurosci 31, 16833–16843. - PMC - PubMed
    1. Allen AE, Procyk CA, Howarth M, Walmsley L & Brown TM (2016). Visual input to the mouse lateral posterior and posterior thalamic nuclei: photoreceptive origins and retinotopic order. J Physiol 594, 1911–1929. - PMC - PubMed
    1. Bale MR & Petersen RS (2009). Transformation in the neural code for whisker deflection direction along the lemniscal pathway. J Neurophysiol 102, 2771–2780. - PMC - PubMed
    1. Berens P (2009). CircStat: a MATLAB toolbox for circular statistics. J Statist Software 31(10).

Publication types

LinkOut - more resources