

Stereological Analysis of Liver Biopsy Histology Sections as a Reference Standard for Validating Non-Invasive Liver Fat Fraction Measurements by MRI
- PMID: 27501242
- PMCID: PMC4976876
- DOI: 10.1371/journal.pone.0160789
Stereological Analysis of Liver Biopsy Histology Sections as a Reference Standard for Validating Non-Invasive Liver Fat Fraction Measurements by MRI
Abstract
Background and aims: Validation of non-invasive methods of liver fat quantification requires a reference standard. However, using standard histopathology assessment of liver biopsies is problematical because of poor repeatability. We aimed to assess a stereological method of measuring volumetric liver fat fraction (VLFF) in liver biopsies and to use the method to validate a magnetic resonance imaging method for measurement of VLFF.
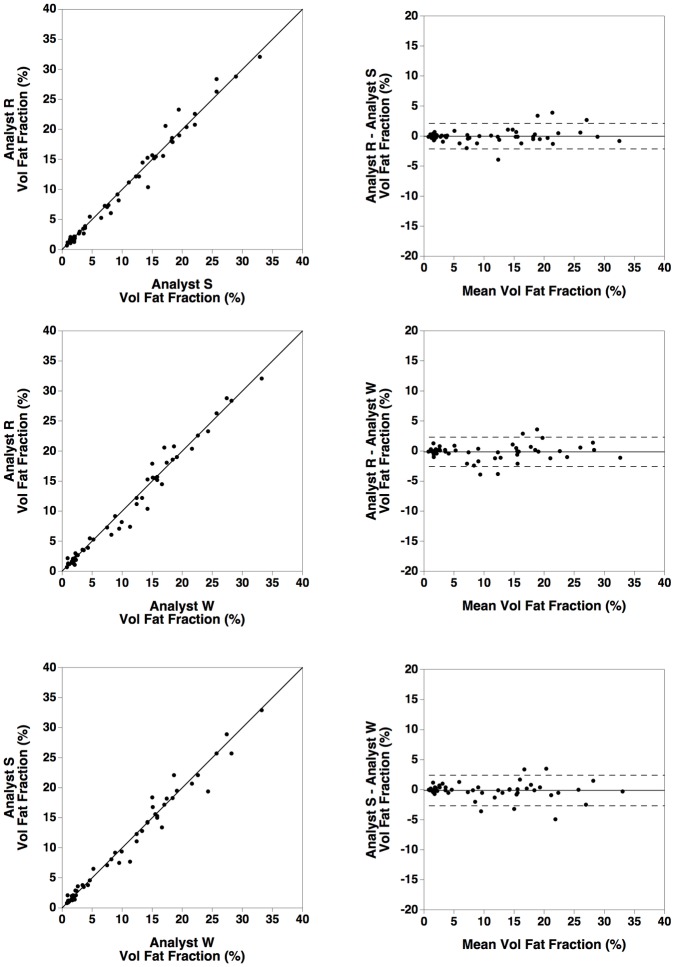
Methods: VLFFs were measured in 59 subjects (1) by three independent analysts using a stereological point counting technique combined with the Delesse principle on liver biopsy histological sections and (2) by three independent analysts using the HepaFat-Scan® technique on magnetic resonance images of the liver. Bland Altman statistics and intraclass correlation (IC) were used to assess the repeatability of each method and the bias between the methods of liver fat fraction measurement.
Results: Inter-analyst repeatability coefficients for the stereology and HepaFat-Scan® methods were 8.2 (95% CI 7.7-8.8)% and 2.4 (95% CI 2.2-2.5)% VLFF respectively. IC coefficients were 0.86 (95% CI 0.69-0.93) and 0.990 (95% CI 0.985-0.994) respectively. Small biases (≤3.4%) were observable between two pairs of analysts using stereology while no significant biases were observable between any of the three pairs of analysts using HepaFat-Scan®. A bias of 1.4±0.5% VLFF was observed between the HepaFat-Scan® method and the stereological method.
Conclusions: Repeatability of the stereological method is superior to the previously reported performance of assessment of hepatic steatosis by histopathologists and is a suitable reference standard for validating non-invasive methods of measurement of VLFF.
Conflict of interest statement
Figures


Similar articles
-
Volumetric Liver Fat Fraction Determines Grade of Steatosis More Accurately Than Controlled Attenuation Parameter in Patients With Nonalcoholic Fatty Liver Disease.Clin Gastroenterol Hepatol. 2020 Apr;18(4):945-953.e2. doi: 10.1016/j.cgh.2019.08.023. Epub 2019 Aug 20. Clin Gastroenterol Hepatol. 2020. PMID: 31442603
-
A comparison of liver fat fraction measurement on MRI at 3T and 1.5T.PLoS One. 2021 Jul 13;16(7):e0252928. doi: 10.1371/journal.pone.0252928. eCollection 2021. PLoS One. 2021. PMID: 34255778 Free PMC article.
-
Non-invasive quantification of hepatic steatosis in living, related liver donors using dual-echo Dixon imaging and single-voxel proton spectroscopy.Clin Radiol. 2016 Jan;71(1):58-63. doi: 10.1016/j.crad.2015.10.002. Epub 2015 Nov 7. Clin Radiol. 2016. PMID: 26555703
-
Overload hepatitides: quanti-qualitative analysis.Abdom Imaging. 2012 Apr;37(2):180-7. doi: 10.1007/s00261-011-9762-5. Abdom Imaging. 2012. PMID: 21643735 Review.
-
Stereology: a method for analyzing images.Prog Neurobiol. 1991;37(5):433-74. doi: 10.1016/0301-0082(91)90009-p. Prog Neurobiol. 1991. PMID: 1754688 Review.
Cited by
-
Evaluation of proton density fat fraction (PDFF) obtained from a vendor-neutral MRI sequence and MRQuantif software.Eur Radiol. 2023 Dec;33(12):8999-9009. doi: 10.1007/s00330-023-09798-4. Epub 2023 Jul 4. Eur Radiol. 2023. PMID: 37402003
-
Assessment of Liver Fat: Dual-Energy CT versus Conventional CT with and without Contrast.Diagnostics (Basel). 2022 Mar 14;12(3):708. doi: 10.3390/diagnostics12030708. Diagnostics (Basel). 2022. PMID: 35328261 Free PMC article.
-
Accurate and generalizable quantitative scoring of liver steatosis from ultrasound images via scalable deep learning.World J Gastroenterol. 2022 Jun 14;28(22):2494-2508. doi: 10.3748/wjg.v28.i22.2494. World J Gastroenterol. 2022. PMID: 35979264 Free PMC article.
-
A Novel Automatic Digital Algorithm that Accurately Quantifies Steatosis in NAFLD on Histopathological Whole-Slide Images.Cytometry B Clin Cytom. 2019 Nov;96(6):521-528. doi: 10.1002/cyto.b.21790. Epub 2019 Jun 7. Cytometry B Clin Cytom. 2019. PMID: 31173462 Free PMC article.
-
The measurement of liver fat from single-energy quantitative computed tomography scans.Quant Imaging Med Surg. 2017 Jun;7(3):281-291. doi: 10.21037/qims.2017.05.06. Quant Imaging Med Surg. 2017. PMID: 28811994 Free PMC article.
References
-
- Kojima S-I, Watanabe N, Numata M, Ogawa T, Matsuzaki S. Increase in the prevalence of fatty liver in Japan over the past 12 years: analysis of clinical background. Journal of Gastroenterology 2003; 38: 954–61. - PubMed
-
- Lazo M, Hernaez R, Eberhardt M S, Bonekamp S, Kamel I, Guallar E, et al. Prevalence of Nonalcoholic Fatty Liver Disease in the United States: The Third National Health and Nutrition Examination Survey, 1988–1994. American Journal of Epidemiology 2013; 178: 38–45. 10.1093/aje/kws448 - DOI - PMC - PubMed
-
- Farrell G C, Larter C Z. Nonalcoholic fatty liver disease: From steatosis to cirrhosis. Hepatology 2006; 43: S99–S112. - PubMed
MeSH terms
LinkOut - more resources
Full Text Sources
Other Literature Sources
Medical
