. 2016 Sep 8;537(7619):229-233.
doi: 10.1038/nature19339. Epub 2016 Aug 8.

Proteasome inhibition for treatment of leishmaniasis, Chagas disease and sleeping sickness

Affiliations

Proteasome inhibition for treatment of leishmaniasis, Chagas disease and sleeping sickness

Shilpi Khare et al. Nature. .

Abstract

Chagas disease, leishmaniasis and sleeping sickness affect 20 million people worldwide and lead to more than 50,000 deaths annually. The diseases are caused by infection with the kinetoplastid parasites Trypanosoma cruzi, Leishmania spp. and Trypanosoma brucei spp., respectively. These parasites have similar biology and genomic sequence, suggesting that all three diseases could be cured with drugs that modulate the activity of a conserved parasite target. However, no such molecular targets or broad spectrum drugs have been identified to date. Here we describe a selective inhibitor of the kinetoplastid proteasome (GNF6702) with unprecedented in vivo efficacy, which cleared parasites from mice in all three models of infection. GNF6702 inhibits the kinetoplastid proteasome through a non-competitive mechanism, does not inhibit the mammalian proteasome or growth of mammalian cells, and is well-tolerated in mice. Our data provide genetic and chemical validation of the parasite proteasome as a promising therapeutic target for treatment of kinetoplastid infections, and underscore the possibility of developing a single class of drugs for these neglected diseases.


Conflict of interest statement

Patents related to this work has been filed (WO 2015/095477 A1, WO 2014/151784 A1, WO 2014/151729). Several authors own shares of Novartis.

Figures

Extended Data Figure 1
Extended Data Figure 1. Pharmacokinetic profile of GNF6702 in mouse
a, Time profiles of mean free plasma concentration of GNF6702 in mouse model of visceral leishmaniasis; free GNF6702 concentration values were predicted from measured total plasma concentration values collected on day 1 and day 8 of treatment. Dashed blue lines correspond to intra-macrophage L. donovani EC50 of 18 ± 1.8 nM and EC99 of 42 ± 5.6 nM. Circles: means ± s.d.; n=3 mice for treatment day 1; n=5 mice for treatment day 8; fraction unbound in mouse plasma=0.063. For data points lacking error bars, standard deviations are smaller than circles representing means. b, Time course of total GNF6702 concentration in mouse plasma and brain after single oral dose (20 mg/kg); n=2 mice per time point; circles: measured values; rectangles: means.
Extended Data Figure 2
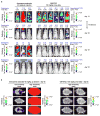
Extended Data Figure 2. GNF6702 clears parasites from mice infected with T. brucei
a, In vivo quantification of bioluminescent T. brucei in infected mice before and after treatment. ip: intraperitoneal; day 21: start of treatment; day 28: 24 hours after last GNF6702 dose; day 42: evaluation of early parasite recrudescence in mice treated with diminazene aceturate (n=3); day 42 and 92: absence of parasite recrudescence in mice treated with GNF6702 (n=6). Images from uninfected mice (3 mice of 4 are shown) aged-matched for day 0 were collected independently using the same acquisition settings. Parasitemia (blue font) and whole mouse total flux (black font) values of each animal are shown above the image; N.D.: not detectable. Within each group the mouse numbers in yellow (top left in each image) refer to the same mouse imaged throughout. Complete sets of parasitemia and whole mouse total flux values collected on individual mice throughout the experiment are listed in Supplementary Tables 4 and 5. b, Brains from mice shown in panel a were soaked in luciferin and imaged for presence of bioluminescent T. brucei at the indicated time points. For three diminazene-treated mice, two images of each brain are shown, one at a lower sensitivity (left) and the other at a high signal intensity scale.
Extended Data Figure 3
Extended Data Figure 3. Structures and profiles of GNF3943 and GNF8000 used for selection of resistant T. cruzi lines
L. donovani: amastigotes proliferating within primary mouse macrophages; T. brucei: the bloodstream form trypomastigotes; T. cruzi: amastigotes proliferating in 3T3 fibroblast cells; macrophage: mouse primary peritoneal macrophages; EC50 and CC50 : half-maximum growth inhibition concentration; F: oral bioavailability in mouse after administering single compound dose (20 mg/kg) as a suspension; CL: plasma clearance in mouse after single iv bolus dose (5 mg/kg); all EC50 and CC50 values correspond to means ± s.e.m. (n=4 technical replicates).
Extended Data Figure 4
Extended Data Figure 4. Mutations in proteasome beta 4 subunit confer resistance to GNF6702 in T. cruzi and T. brucei
a, growth curves of wild type, GNF3943-resistant and GNF8000-resistant T. cruzi epimastigote strains in the presence of increasing concentrations of GNF6702, nifurtimox, bortezomib and MG132; RU (relative units) corresponds to parasite growth relative to the DMSO control (%); for data points lacking error bars, standard errors are smaller than circles representing means; due to limited aqueous solubility, the highest tested GNF6702 concentration was 10 μM. b, growth inhibition EC50 values of GNF6702, bortezomib, MG132 and nifurtimox on indicated T. cruzi strains. c, growth inhibition EC50 values of GNF6702 and bortezomib on T. cruzi epimastigotes and T. brucei bloodstream form trypomastigotes overexpressing PSMB4WT or PSMB4F24L. Data shown in panels a, b and c correspond to means ± s.e.m. (n=3 technical replicates).
Extended Data Figure 5
Extended Data Figure 5. Correlation between inhibition of parasite proteasome chymotrypsin-like activity and parasite growth inhibition by the GNF6702 compound series
IC50: half-maximum inhibition of indicated parasite proteasome; T. brucei EC50: half-maximum growth inhibition on T. brucei bloodstream form trypomastigotes; T. cruzi EC50: half-maximum growth inhibition on T. cruzi amastigotes proliferating inside 3T3 cells; data points correspond to means of 2 technical replicates; red circles: IC50>20 μM; yellow circles: IC50>20 μM and EC50>25 μM; data for 317 analogues are shown.
Extended Data Figure 6
Extended Data Figure 6. Hypothetical model of GNF6702 binding to T. cruzi proteasome beta 4 subunit
a, Alignment of amino acid sequences of proteasome beta 4 subunits (PSMB4) from L. donovani, T. cruzi, T. brucei and H. sapiens. Green: amino acid residues conserved between human and kinetoplastid PSMB4 proteins; blue: amino acid residues conserved only among kinetoplastid PSMB4 proteins; black: amino acids mutated in T. cruzi mutants resistant to analogues from the GNF6702 series. b, Surface representation of the modeled T. cruzi 20S proteasome structure showing relative positions of the beta 5 and beta 4 subunits. Beta 4 amino acid residues F24 and I29 (colored yellow) are located at the interface of the two beta subunits. GNF6702 is depicted in a sphere representation bound into a predicted pocket on the beta 4 subunit surface with carbon, nitrogen, oxygen and hydrogen atoms colored magenta, blue, red and grey, respectively. The other T. cruzi 20S proteasome subunits are colored gray. c, Close-up of the beta 5 and beta 4 subunits. The beta 5 subunit active site (pocket 1, chymotrypsin-like activity) is colored pale green. The predicted beta 4 pocket (pocket 2) with bound GNF6702 is colored blue. The inhibitor is shown in a stick representation with atoms colored as described in caption for the b panel. Beta 4 residues F24 and I29 are colored yellow. The proteasome model shown in panels b and c was produced by The PyMol Molecule Graphics System, Version 1.8, Schrodinger, LLC.
Extended Data Figure 7
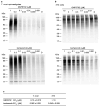
Extended Data Figure 7. Effect of GNF6702 on accumulation of ubiquitylated proteins by T. cruzi epimastigotes and 3T3 cells
a, Western blot analysis of T. cruzi whole cell extracts with anti-ubiquitin antibody after treatment with GNF6702 and bortezomib. b, Western blot analysis of 3T3 whole cell extracts with anti-ubiquitin antibody after treatment with GNF6702 and borteomib. c, Concentrations of GNF6702 and bortezomib effecting half-maximum accumulation of ubiquitylated proteins in T. cruzi and 3T3 cells (means ± s.e.m.; n=3 technical replicates); total ubiquitin signal values in individual blot lanes shown in panels a and b were quantified and used for calculation of the listed EC50 values. In a and b, numbers above the blot lanes indicate compound concentrations and D indicates control, DMSO-treated cells. For western blot source data, see Supplementary Figure 1.
Figure 1
Figure 1. Chemical evolution of GNF6702 from the phenotypic hit GNF5343
L. donovani: amastigotes proliferating within primary mouse macrophages; T. brucei: the bloodstream form trypomastigotes; T. cruzi: amastigotes proliferating in 3T3 fibroblast cells; macrophage: mouse primary peritoneal macrophages; EC50 and CC50: half-maximum growth inhibition concentration; F: oral bioavailability in mouse after administering single compound dose (20 mg/kg) as a suspension; CL: plasma clearance in mouse after single iv bolus dose (5 mg/kg); N.D.: not determined; all EC50 and CC50 values correspond to means ± s.e.m. (n=4 technical replicates).
Figure 2
Figure 2. GNF6702 clears parasites in mouse models of kinetoplastid infections
a, Post-treatment L. donovani liver burdens in mouse model of VL as assessed by qPCR (n=5 mice). b, PK/PD relationship for ten GNF6702 analogues, each administered at several doses; circles: mean liver burdens associated with individual compound regimens (30 regimens in total; n=5 mice per regimen) relative to vehicle; horizontal dotted line: 90% reduction in the liver L. donovani burden; vertical dotted line: 0.94-fold multiple of the mean free compound plasma concentration/the L. donovani EC90 value ratio. c, Post-treatment L. major footpad burdens in the BALB/c mouse model of CL as assessed by qPCR (n= 6 mice); the p values (two-tailed distribution) relate parasite burdens in compound-treated mice with those from vehicle-treated mice; left inset picture: a representative mouse footpad after treatment with vehicle; right inset picture: a representative mouse footpad after treatment with GNF6702 10 mg/kg twice-daily regimen. d, T. cruzi burden in mouse blood (circles), colon (triangles) and heart (diamonds) as assessed by qPCR after 20 days of treatment and four weeks of immunosuppression (n=8 mice). e, Whole body in vivo imaging of bioluminescent T. brucei before and after treatment; Trypanosoma brucei–infected mice were treated by a single intraperitoneal injection of diminazene aceturate (n=3 mice) or by oral administration of GNF6702 once-daily for 7 days (n=6 mice); filled symbols show whole body bioluminescence values for individual mice; several mice from the untreated and diminazene aceturate-treated groups were euthanized between days 28 and 56 due to CNS infection symptoms; background bioluminescence values shown for uninfected mice (grey-filled squares; n=4) were collected independently from mice aged-matched for day 0 using the same acquisition settings. Red dotted lines in a, c and d plots show limit of parasite detection by qPCR; plot symbols below the red dotted line: mice with no detectable parasites; data points below the limit of detection are ‘jittered’ to show number of animals in a group; thick horizontal lines: means of the treatment groups; RU: relative units (parasite burden relative to the mean burden of the vehicle-treated group).
Figure 3
Figure 3. F24L mutation in proteasome beta 4 subunit confers selective resistance to GNF6702
a, growth inhibition of T. cruzi epimastigote strains ectopically expressing PSMB4WT or PSMB4F24L protein by GNF6702 and bortezomib; non-induced/induced: culture medium without/with tetracycline to modulate expression of tetracycline-inducible PSMB4 genes. b, growth inhibition of T. brucei bloodstream form trypomastigotes constitutively overexpressing PSMB4WT or PSMB4F24L protein by GNF6702 and bortezomib. EC50 values for each strain/compound pair are listed inside a and b plot panels next to corresponding strain/compound symbol (defined in plot legends); means from n=3 technical replicates are shown; error bars represent s.e.m. values; for data points lacking error bars, s.e.m. values are smaller than circles representing means; due to limited aqueous solubility, the highest tested GNF6702 concentration was 10 μM. RU (relative units) in a and b corresponds to parasite growth relative to the DMSO control (%).
Figure 4
Figure 4. Compounds from GNF6702 series inhibit growth of kinetoplastid parasites by inhibiting parasite proteasome chymotrypsin-like activity
a, Inhibition of three proteolytic activities of purified wild type (PSMB4WT) and PSMB4I29M T. cruzi proteasomes by GNF6702 and bortezomib; IC50 values for proteasome proteolytic activities are listed inside plots. b, Correlation between inhibition of chymotrypsin-like activity of purified L. donovani proteasome (IC50) and L. donovani axenic amastigote growth inhibition (EC50; data points correspond to means of 2 technical replicates); red circles: IC50>20 μM; blue circles: EC50>25 μM; yellow circles: IC50>20 μM and EC50>25 μM; data for 317 analogues are shown. c, Lineweaver-Burk plot of inhibition of T. cruzi proteasome chymotrypsin-like activity by GNF6702 at increasing concentrations of a peptide substrate. d, Effect of GNF6702 and bortezomib on three proteolytic activities of human constitutive proteasome; IC50 values for proteasome proteolytic activities are listed inside plots. Data shown in a, c and d represent means ± s.e.m. (n=3 technical replicates; for data points lacking error bars, s.e.m. values are smaller than circles representing means). Due to limited aqueous solubility, the highest tested GNF6702 concentration in experiments shown in a and d was 10 μM.

Similar articles

Cited by

References

    1. World Health Organization. Research priorities for Chagas disease human African trypanosomiasis leishmaniasis. 2012. pp. 1–100. WHO Technical Report Series 975. - PubMed
    1. El-Sayed NM, et al. Comparative genomics of trypanosomatid parasitic protozoa. Science. 2005;309:404–409. doi: 10.1126/science.1112181. - DOI - PubMed
    1. Bilbe G. Infectious diseases. Overcoming neglect of kinetoplastid diseases. Science. 2015;348:974–976. doi: 10.1126/science.aaa3683. - DOI - PubMed
    1. Sundar S, Chakravarty J. An update on pharmacotherapy for leishmaniasis. Expert Opinion on Pharmacotherapy. 2015;16:237–252. doi: 10.1517/14656566.2015.973850. - DOI - PMC - PubMed
    1. Nagle AS, et al. Recent developments in drug discovery for leishmaniasis and human African trypanosomiasis. Chemical Reviews. 2014 doi: 10.1021/cr500365f. - DOI - PMC - PubMed

MeSH terms