. 2016 Sep 8;537(7619):234-238.
doi: 10.1038/nature19334. Epub 2016 Aug 8.

Germinal centre hypoxia and regulation of antibody qualities by a hypoxia response system

Affiliations

Germinal centre hypoxia and regulation of antibody qualities by a hypoxia response system

Sung Hoon Cho et al. Nature. .

Abstract

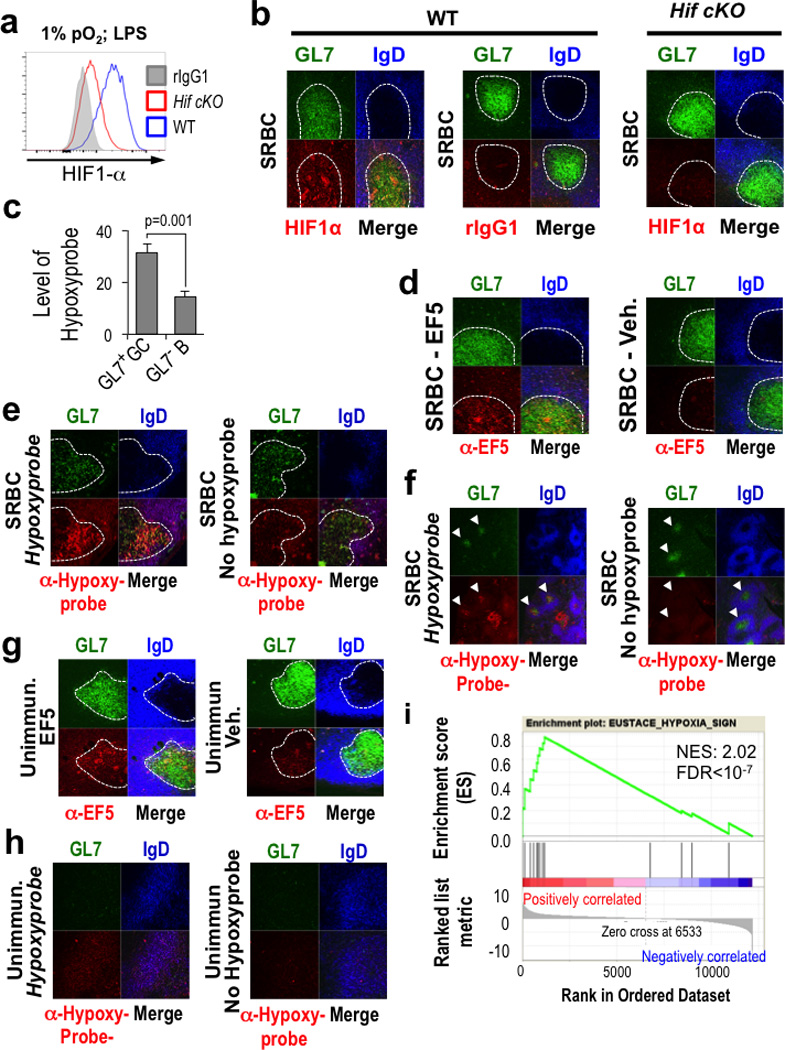
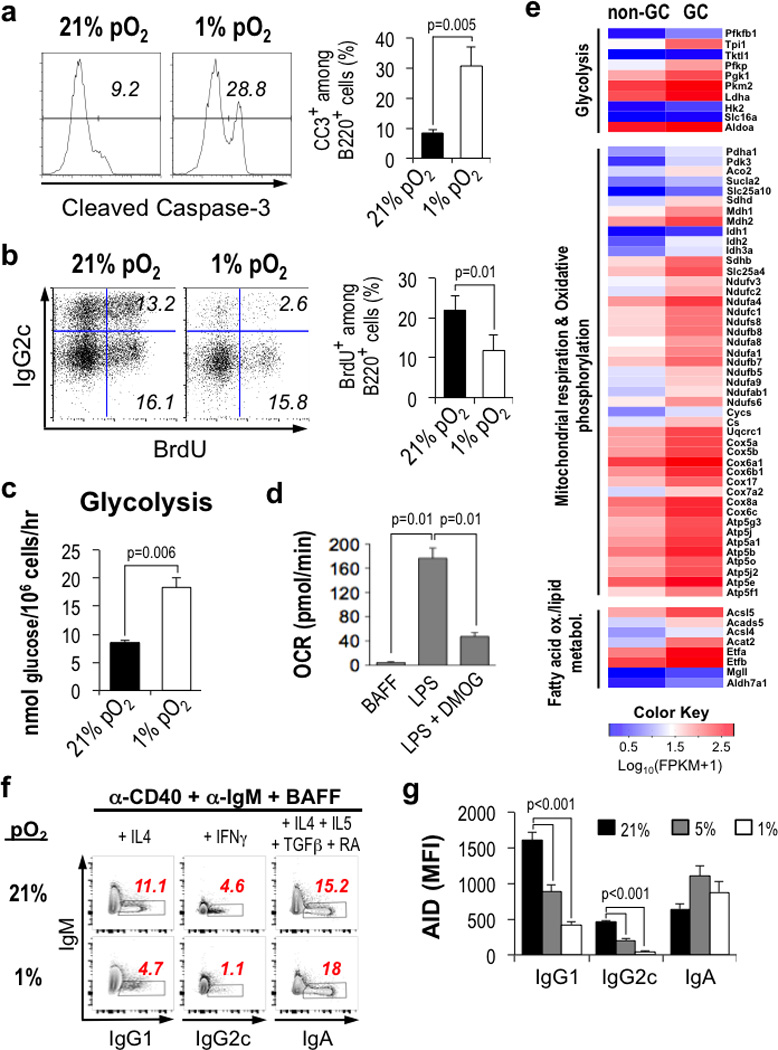
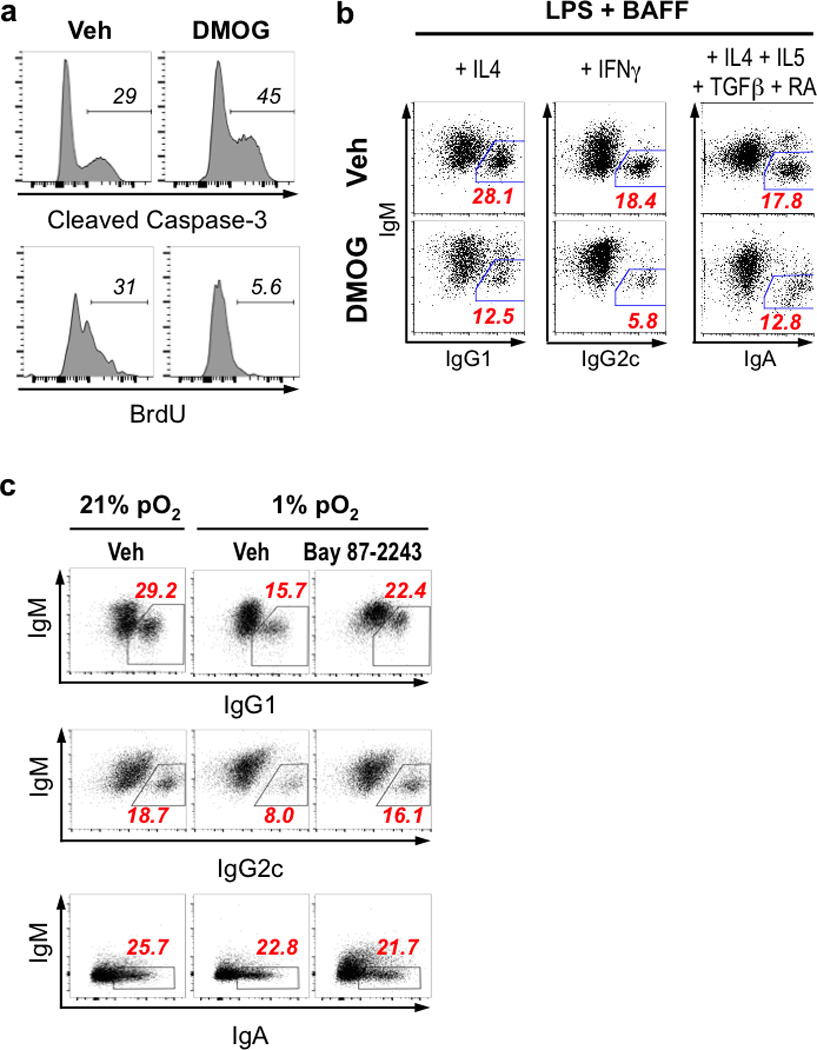
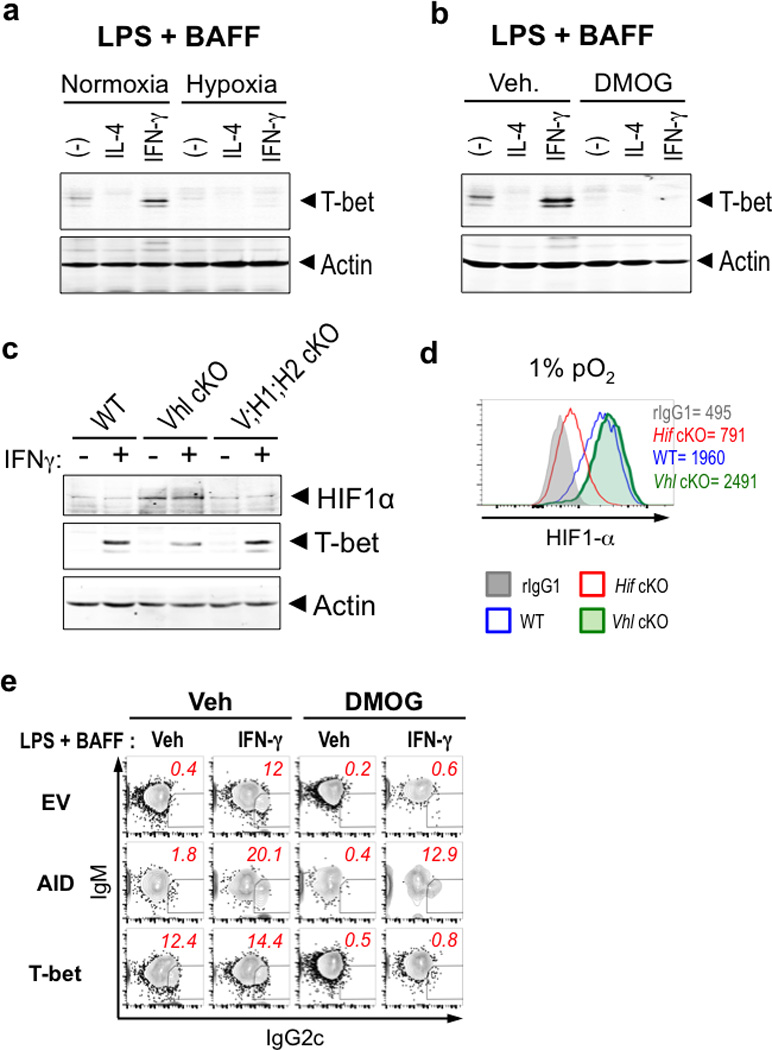
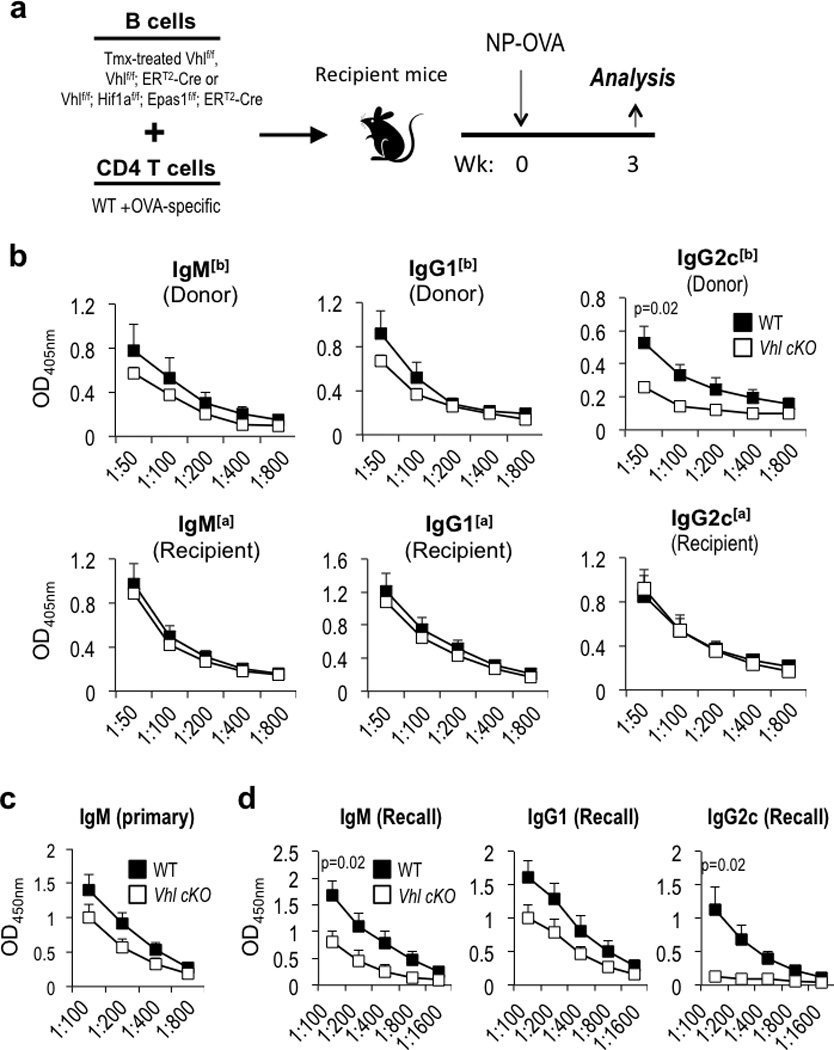
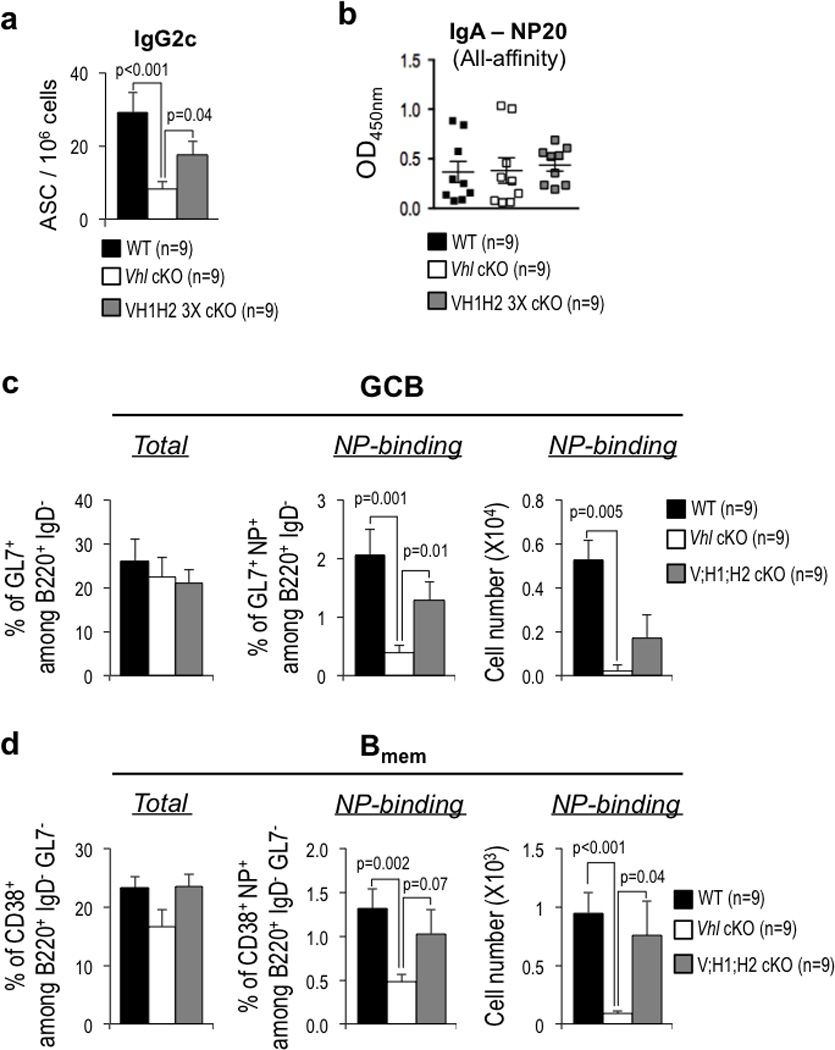
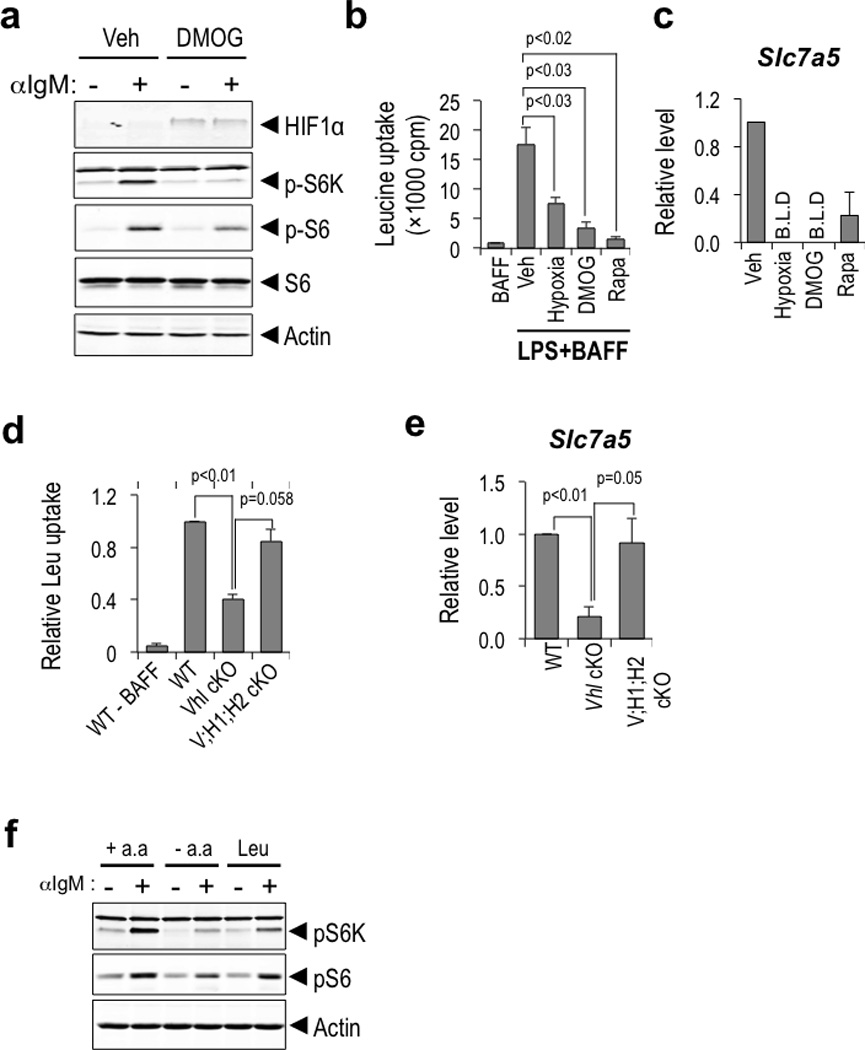
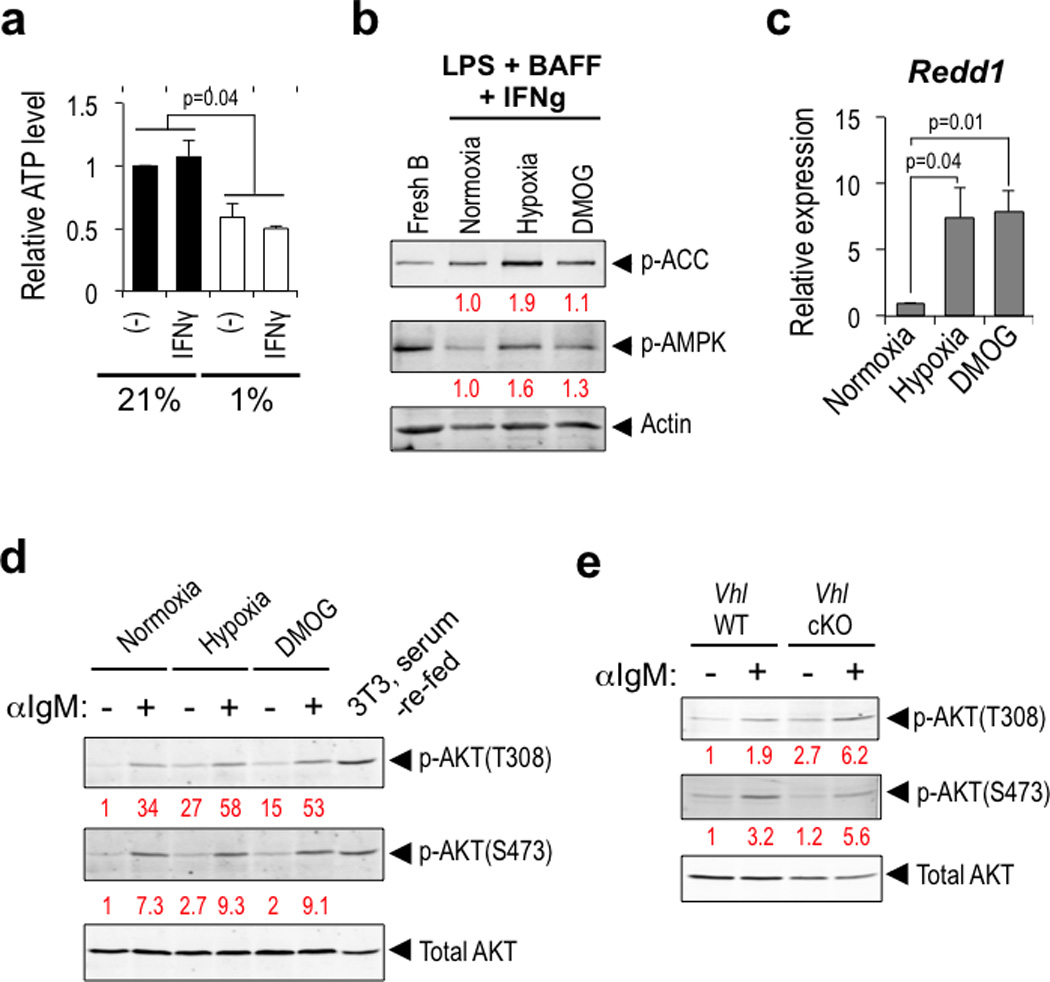
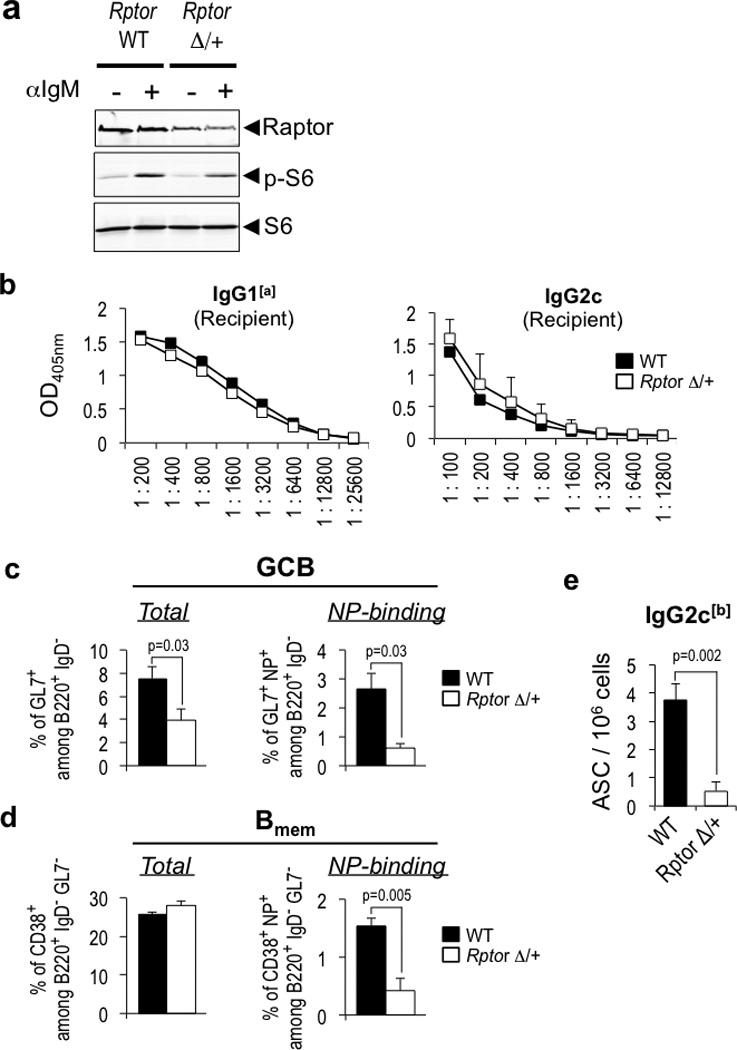
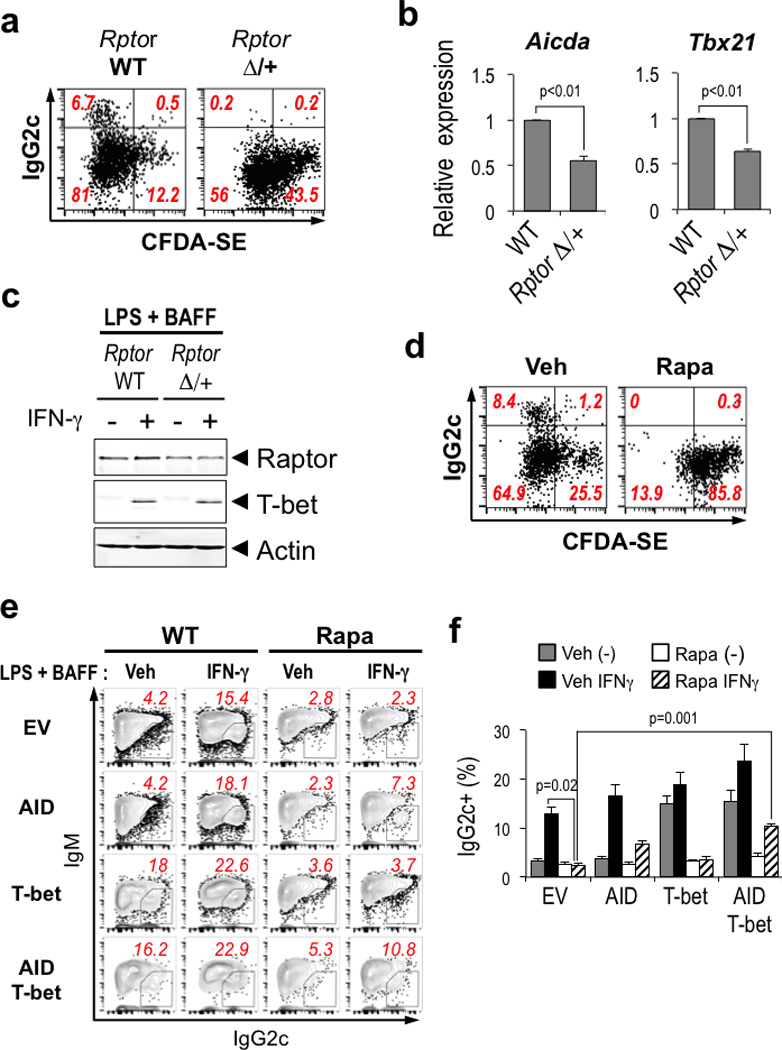
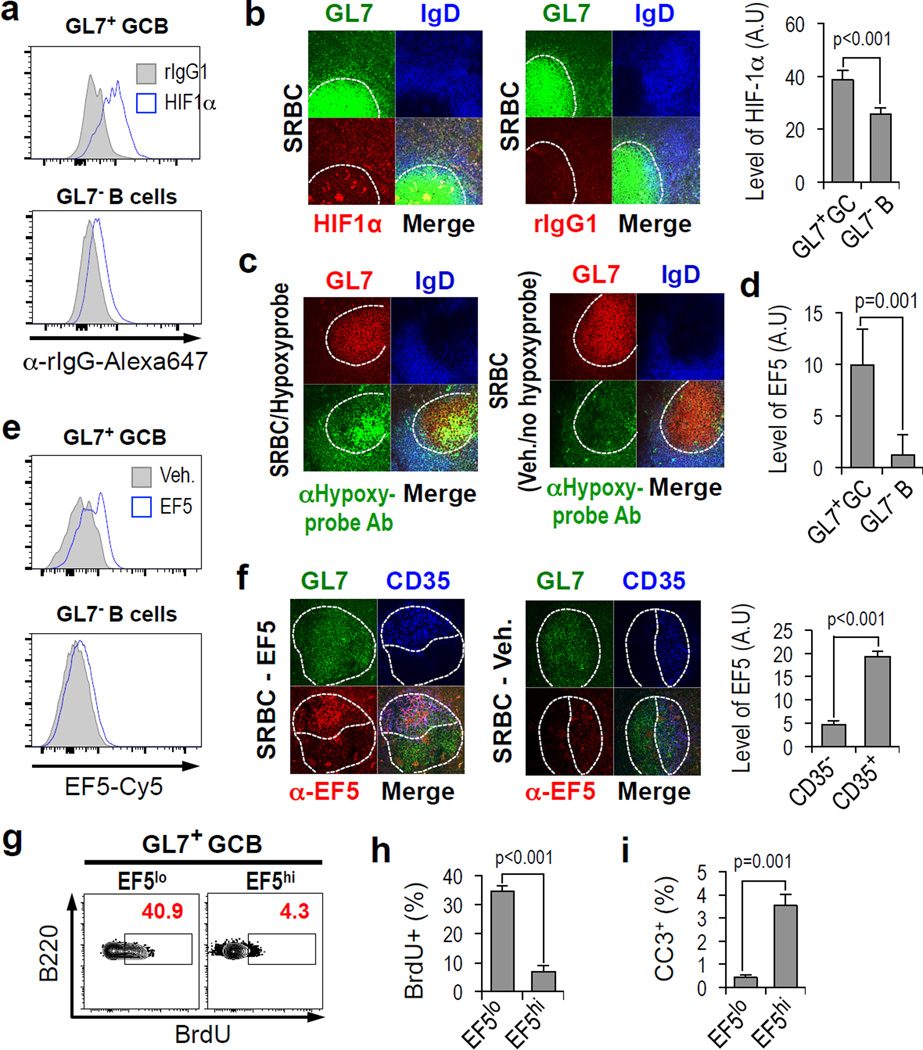
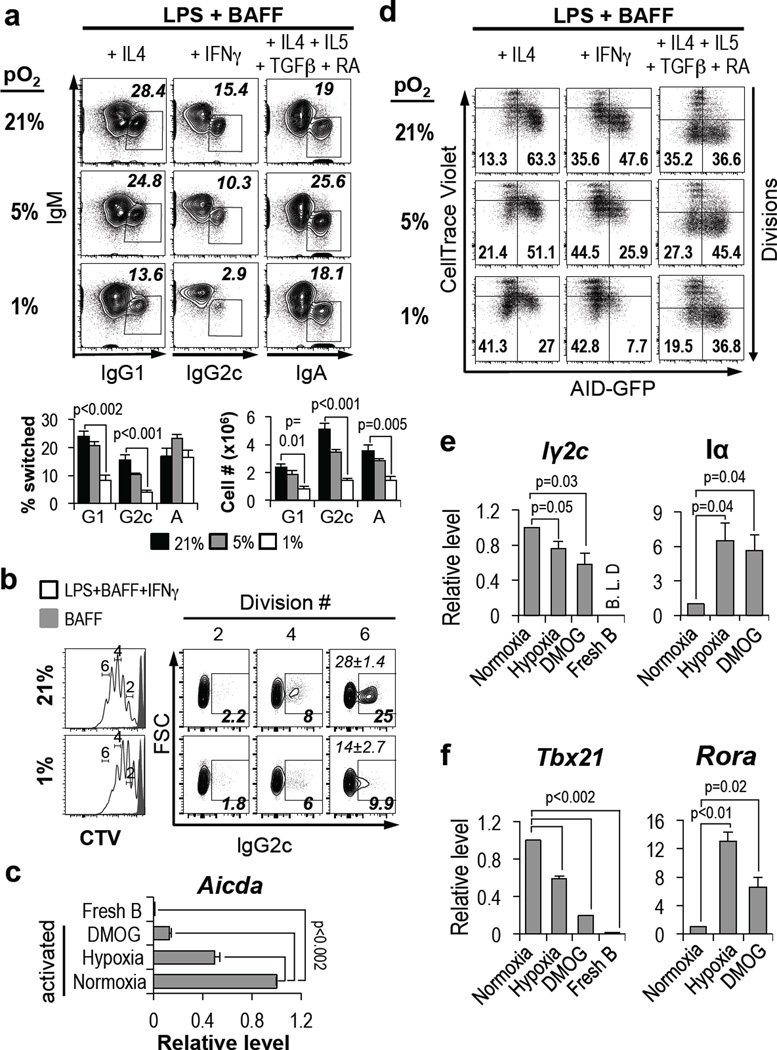
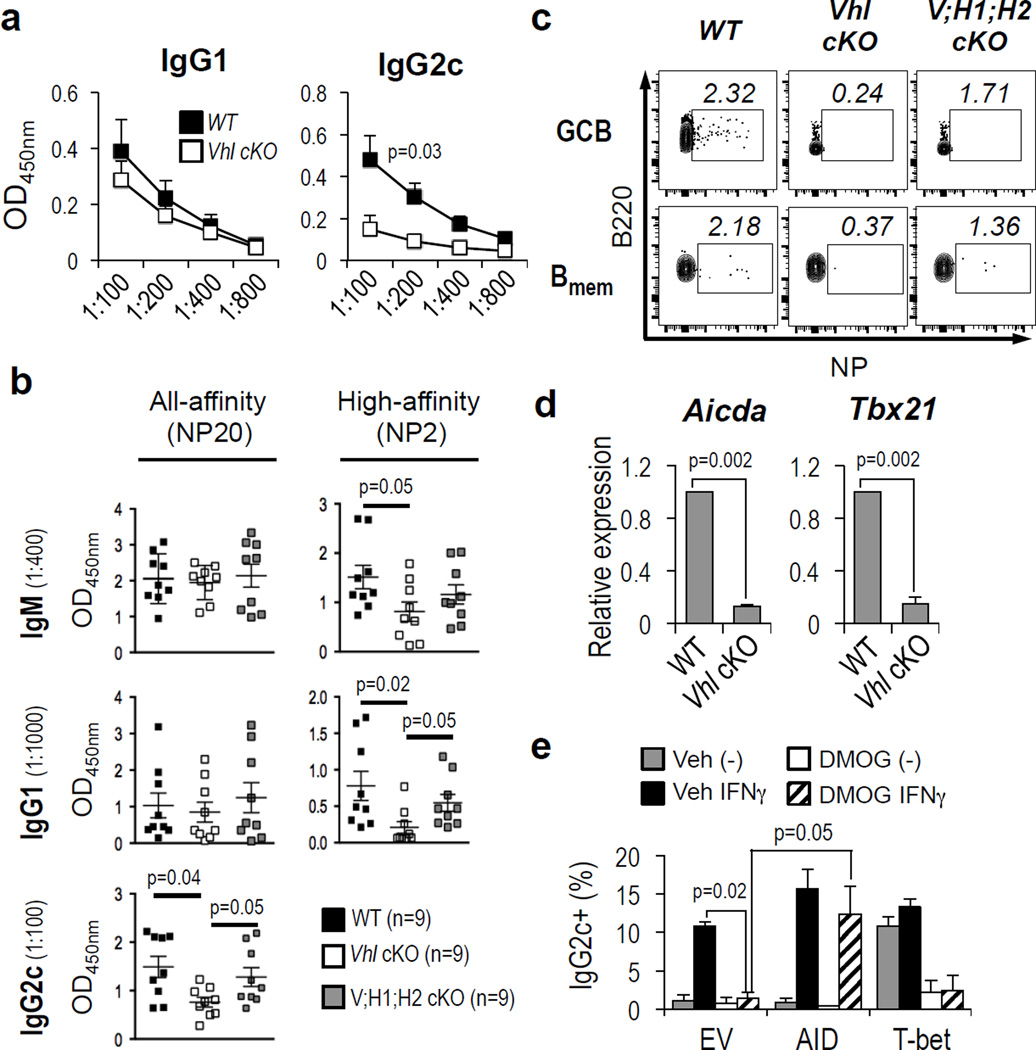
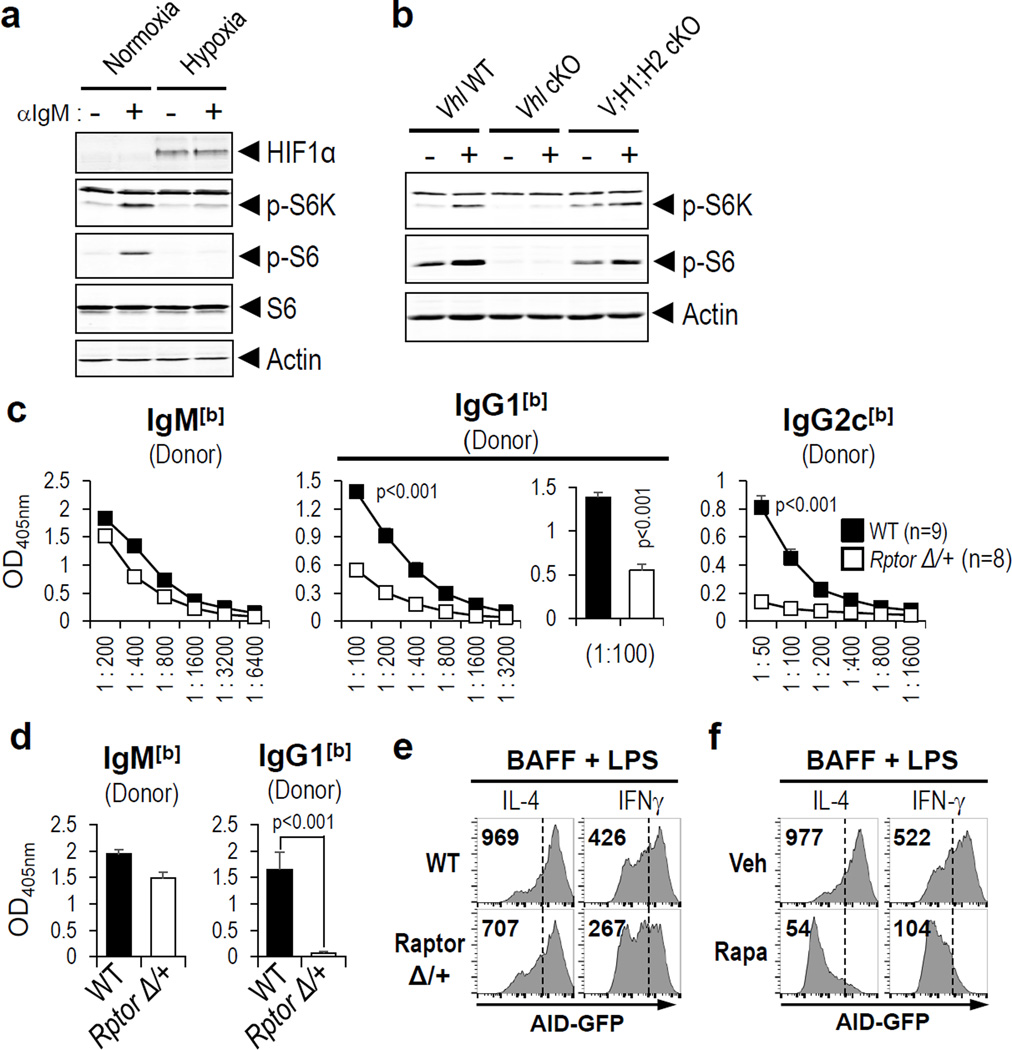
Germinal centres (GCs) promote humoral immunity and vaccine efficacy. In GCs, antigen-activated B cells proliferate, express high-affinity antibodies, promote antibody class switching, and yield B cell memory. Whereas the cytokine milieu has long been known to regulate effector functions that include the choice of immunoglobulin class, both cell-autonomous and extrinsic metabolic programming have emerged as modulators of T-cell-mediated immunity. Here we show in mice that GC light zones are hypoxic, and that low oxygen tension () alters B cell physiology and function. In addition to reduced proliferation and increased B cell death, low impairs antibody class switching to the pro-inflammatory IgG2c antibody isotype by limiting the expression of activation-induced cytosine deaminase (AID). Hypoxia induces HIF transcription factors by restricting the activity of prolyl hydroxyl dioxygenase enzymes, which hydroxylate HIF-1α and HIF-2α to destabilize HIF by binding the von Hippel-Landau tumour suppressor protein (pVHL). B-cell-specific depletion of pVHL leads to constitutive HIF stabilization, decreases antigen-specific GC B cells and undermines the generation of high-affinity IgG, switching to IgG2c, early memory B cells, and recall antibody responses. HIF induction can reprogram metabolic and growth factor gene expression. Sustained hypoxia or HIF induction by pVHL deficiency inhibits mTOR complex 1 (mTORC1) activity in B lymphoblasts, and mTORC1-haploinsufficient B cells have reduced clonal expansion, AID expression, and capacities to yield IgG2c and high-affinity antibodies. Thus, the normal physiology of GCs involves regional variegation of hypoxia, and HIF-dependent oxygen sensing regulates vital functions of B cells. We propose that the restriction of oxygen in lymphoid organs, which can be altered in pathophysiological states, modulates humoral immunity.


Figures

Extended Data Figure 1
Extended Data Figure 1. Landscape of hypoxic cells in follicles and GCs of lymphoid organs
(a, b) Controls for anti-HIF-1α Ab staining of GC and portions of the surrounding splenic follicle, as in Fig. 1a, b, with fluorescent signals at the same intensity settings when analyzing samples processed together, using SRBC immunization of WT and Hif-deleted mice and either anti-HIF-1α sera or non-immune rabbit IgG (rIgG1), as indicated. Shown are (a) flow cytometry results of intracellular staining performed after exposure of lymphoblasts of the indicated genotypes to 4-hydroxytamoxifen and hypoxia, and (b) confocal images (40x magnification) as in Fig. 1a, b, respectively. (c) Quantified data obtained from samples represented in Fig. 1c. Shown are the mean (±SEM) specific fluorescence intensities of Hypoxyprobe™ (anti-pimonidazole) staining in germinal centers (delimited as GL7+) and GL7 IgD+ follicular B cell regions after subtracting background signal (mean fluorescence intensities in these regions after anti-pimonidazole staining of samples from PBS-injected control mice). (d) Immunostaining of EF5-modified cells. Shown are confocal microscopic images of spleen sections from SRBC-immunized mice injected with EF5 (left) or PBS (right) 2 hr before harvest, followed by direct immunofluorescent staining of frozen sections with anti-GL7 Ab, anti-IgD and anti-EF5, representative of the quantified data presented in Fig. 1d. (e) Representative images of mesenteric LN after injections and immunostaining as in Fig. 1c. (f) Low (10x) magnification image of anti-pimonidazole immunohistochemistry on spleen sections from SRBC-immunized mice injected with pimonidazole (left) or PBS (right) prior to harvest. Among stained sections for both anti-pimonidazole and EF5, ∼75 % of GC sections were unequivocally positive. (g) Representative images of Peyer’s Patches from non-immune, EF5-injected mice processed as in Fig. 1c. (h) Representative images of spleen sections from unimmunized mice injected with Hypoxyprobe™ (left) or PBS (right) 3 hr before harvest, processed in parallel with sections from immunized mice injected with probe, and imaged by confocal microscopy at the same time and settings as for the sections from immunized mice. (i) GSEA plots comparing gene set pre-ranked by log2-fold change in relative expression (GL7+/GL7-) in a hypoxia gene signature.
Extended Data Figure 2
Extended Data Figure 2. Altered B cell survival, proliferation and metabolism in reduced pO2
(a) Increased executioner caspase-3 activation in hypoxic B cells. Shown (left panels) are representative flow histograms of activated (cleaved) caspase-3 (CC3) in the B cell gate after activated B cells were cultured in pO2 of 21% (normoxia) and 1% (hypoxia). B cells were stimulated with BAFF, LPS, and IFN-γ, cultured (4 d) at the indicated oxygen tension and processed for detection of activated caspase-3 using fluorescent-conjugated active caspase-3 Ab. Panel to right displays the mean (±SEM) quantitative data for the frequencies of B cells positive for caspase-3 cleavage in three independent replicate experiments. (b) O2 sufficiency enhances cell cycle rates. As in (a), but cells were pulsed with BrdU and frequencies of S-phase during the cultures are displayed in relation to IgG2c switching, with a representative result (left panels) and quantitation of the overall B220+ cell populations in three independent replicate experiments (right panel). B cells were cultured (4 d) with BAFF, LPS, and IFN-γ at the indicated oxygen levels, pulsed (4 hr) with BrdU, and then stained with anti-IgG2c, -B220, and -BrdU Ab after fixation, permeabilization, and processing. (c, d) Pools of purified WT B cells were stimulated with BAFF and LPS, divided, and cultured (2 d) in pO2 of 21% (normoxia) and 1% (hypoxia). (c) Rates of glycolysis were measured after return to their previous oxygen conditions, using equal numbers of surviving B cells after culture as detailed in the Methods. The bar graph shows mean (±SEM) rates of glycolysis measured in three independent experiments. (d) Inhibition of PHD activity decreases cellular respiration of B lymphoblasts. Purified B cells were activated and cultured (2 d) with LPS and BAFF in the presence or absence of the PHD inhibitor DMOG (0.5 mM). Oxygen Consumption Rate (OCR) was measured with cultured viable B cells (1.5×10⁵ cells) as detail in the Methods. The bar graph shows mean (±SD) OCR of technical triplicate measurements in one experiment representative of three independent replicates with similar results. (e) Metabolic gene expression profile of GL7+ GC B cells. Genes showing significant expression changes in GL7+ GC B cells were mined for genes important for the indicated cellular processes. The heat map depicts values for the indicated genes shown as the value derived as log10 of the fragments per kilobase per million (reads) after adding 1 to each value (FPKM+1). (f) Hypoxia limits switch to IgG among B cells activated via BCR and CD40. As in Fig. 2a, except that the B cell preparations were activated by cross-linking their surface IgM and CD40 without addition of LPS. (g) Quantified mean fluorescence intensities for GFP expression in the full set of replicate experiments conducted as in Fig. 2d, presented as mean (±SEM) data for each condition of culture (pO2 of 21, 5, or 1%, with cytokines and retinoic acid for Ig class switch conditions as indicated, and as for Fig. 2a, b).
Extended Data Figure 3
Extended Data Figure 3. HIF stabilization alters B cell survival, proliferation and class switched Ab level
(a) Purified WT B cells were activated and cultured (4 d) with LPS and BAFF in the presence or absence of DMOG, after which frequencies of cells with cleaved caspase 3 or BrdU uptake, as indicated, were measured as in Extended Data Fig. 2 (representative result from one experiment among n=3 independent replicate experiments). (b) Purified WT B cells were activated and cultured in conditions for switching to IgG1, IgG2c, and IgA, as in Fig. 2a, b, but at atmospheric (21%) pO2 in the presence or absence of DMOG, after which the frequencies of surface IgG1, IgG2c and IgA among B220+-gated cells were measured as in Fig. 2 and detailed in the Methods. FACS plots display the surface levels of IgG1, IgG2c, and IgA on B220+-gated cells in one experiment representative of three independent replicates. (c) HIF inhibition impedes the hypoxia-induced alteration of Ab class switch choices. B cells were activated and cultured (4 d) with BAFF, LPS, and the indicated switching condtions as in Fig. 2a (IL-4, IgG1; IFN-γ, IgG2c; retinoic acid, TGF-β, IL-4 and −5, IgA) at pO2 of 21% (normoxia) or 1% (hypoxia) in the presence or absence of the HIF inhibitor Bay 87–2243. FACS plots displaying the surface levels of IgG1, IgG2c, and IgA on B220+-gated cells in one representative result among three independent experiments are shown.
Extended Data Figure 4
Extended Data Figure 4. Hypoxia and PHD inhibition repress T-bet induction
(a, b) B cells from WT mice were activated and cultured in LPS, BAFF, and IL-4 or IFNγ for 4 days under normoxic and hypoxic conditions (a) or cultured with and without DMOG at pO2 of 21% (b). Shown are results of immunoblots using anti-T-bet Ab along with actin as a loading control. Data are one representative result from among three independent experiments. (c) HIF-dependent regulation of T-bet expression by pVHL. B cells from WT or conditionally deleted Vhl and Vhl; Hif1a; Epas1 (Vhl, and V;H1;H2, respectively) cKO mice were activated and cultured (4 d) in LPS and BAFF in the presence or absence of IFN-γ, as indicated. Results of one representative immunoblot (from among three independent experiments) probed for HIF1α, T-bet and actin are shown. (d) HIF superinduction by pVHL depletion in B cells at 1% pO2. WT and B cells after conditional Vhl f/f deletion were activated, cultured in 1% pO2 as in Extended Data Fig. 1a, and analyzed by flow cytometry after processing together for indirect immunofluorescent staining of intracellular HIF-1α as in Fig. 1a and Extended Data Fig. 1a. Numbers denote the mean fluorescent intensity of the B cells of each type. (e) Flow cytometric data from one representative experiment as in Fig. 3e, in which B cells were transduced with MIT, MIG, MIT-T-bet or pMx-GFP-AID retrovectors, and cultured with BAFF and LPS ± IFN-γ in the presence or absence of DMOG. The frequencies of surface IgG2c+ events among B220+ cells analyzed 4 d after transduction are shown, with flow data from one experiment of three independent experiments.
Extended Data Figure 5
Extended Data Figure 5. VHL regulates Ag-specific Ab production
(a) Schematic outline of adoptive transfer experiments. B cells purified from tamoxifen-treated WT, Vhlf/f, or Vhl f/f; Hif1a f/f; Epas1 f/f CreERT2+ mice were transferred into recipients after mixing with CD4+ T cells (polyclonal : Ag-specific = 4:1). Recipients were analyzed after primary (10) immunization or, for memory responses, after the 10 and a recall immunization. (b) As in Fig. 3a, except B cells from WT or conditionally deleted Vhl cKO mice were mixed with CD4+ OT-II TCR transgenic T cells, transferred into Ig CH allotype-disparate recipient mice, followed by immunization with NP-ovalbumin and harvest 3 wk after primary immunization. Donor- ([b] allotype) and recipient-derived ([a] allotype) NP-specific IgM and IgG1 levels in the sera were analyzed by ELISA. The mean (±SEM) absorbance data averaging independent samples [n=8 (WT) and 7 (Vhl cKO)] obtained in two separate transfer experiments (measured on the same ELISA plate) are shown. (c, d) As in Fig. 3a, WT or Vhl Δ/Δ (Vhl cKO) B cells were mixed with WT CD4+ T lymphocytes (a 4:1 mixture of polyclonal and OVA-specific OT-II cells), and transferred into Rag0 recipients that were then immunized with NP-ovalbumin, and analyzed for NP-specific Ab levels 3 wk after primary (10) immunization (c) or, for memory response, 9 wk after the 10 and 1 wk after a recall immunization (panel d). [n= 5 independent recipients per genotype in two independent experiments.] (c) Mean (±SEM) ELISA data for all-affinity IgM anti-NP from the same samples as Fig. 3b are shown. (d) Impaired immune memory follows interference with B cells’ hypoxia response system. Terminal sera obtained from the recipient mice (Fig. 3a) 1 wk after recall immunization were analyzed by ELISA for all-affinity anti-NP Ab of the indicated isotypes at the same time as the 10 response samples (Fig. 3a; Extended Data Fig. 5c).
Extended Data Figure 6
Extended Data Figure 6. HIF-dependent regulation of antigen-specific B cell population and antibody response by pVHL
(a, b) As in Fig. 3, WT, Vhl Δ/Δ (“Vhl cKO”), or Vhl Δ/Δ Hif1a Δ/Δ Epas1 Δ/Δ (“V;H1;H2 cKO”) B cells were mixed with WT CD4+ T lymphocytes (a 4:1 mixture of polyclonal and OVA-specific OT-II cells), transferred into Rag0 recipients that were then immunized with NP-ovalbumin and analyzed for NP-specific Ab levels after primary (10) immunization as in Fig. 3b, c. Using the same mice and samples as for Fig. 3b, c, cells in spleen secreting IgG2c anti-NP were quantified by ELISpot and averaged as frequencies of Ab-secreting cells (ASC) in the sample (a). Mean (±SEM) frequencies for all samples (n=9 each) are shown. (b) Anti-NP IgA levels in the sera of the samples used in Fig. 3b were quantified by ELISA. (c, d) VHL regulation of Ag-specific GC and memory B cells is HIF-dependent. As in Fig. 3b, c, WT, pVHL-depleted (Vhl Δ/Δ , Vhl cKO), or pVHL, HIF-1α, HIF-2α-depleted (Vhl Δ/Δ Hif1a Δ/Δ Epas1 Δ/Δ, “V;H1;H2 cKO”) B cells were mixed with CD4+ T cells (4: 1 polyclonal: OVA-specific), transferred into Rag0 mice, immunized with NP-SRBC along with NP-OVA, boosted with NP-OVA at 3 wk after primary immunization, and analyzed at 1 wk after the boost. Shown are the mean (±SEM) frequencies or numbers of Ag (NP)-binding B cells of GC- (IgD GL7+) (c), and early memory (IgD GL7 CD38hi) phenotypes (d) derived from each donor population and recovered in the recipient mice, as determined by enumeration and flow cytometric phenotyping with fluor-conjugated NP.
Extended Data Figure 7
Extended Data Figure 7. Hypoxia interrupts impairs an activation-induced feed-forward loop in which mTORC1 increases leucine uptake by B cells
(a) PHD inhibition attenuates mTORC1 activity. WT B cells were activated with αIgM and cultured (2 d) in BAFF, rested 20 h in the presence or absence of DMOG, and then re-stimulated (20 min) with αIgM. Shown are immunoblots probed with anti-HIF1α, anti-p-S6K, anti-p-S6, and anti-S6 Ab along with anti-actin as a loading control. Data are the results from one representative experiment among three independent replicates. (b–f) Hypoxia and HIF stabilization reduce leucine uptake and mTORC1 activation. (b, c) Reduced leucine uptake (b) and Slc7a5 mRNA encoding the large neutral a.a. transporter LAT1 (c) with inhibition of PHD proteins or mTOR. WT cells were analyzed after culture in 1% O2 or at pO2 of 21%, in presence of vehicle, PHD inhibitor (DMOG), or mTORC1 inhibitor (Rapa) as indicated. (b) Mean (±SEM) B cell uptake of leucine, in n=3 independent experiments. (c) Mean (±SEM) relative mRNA level, normalized to actin (n=3 independent experiments). (d, e) Activated B cells of the indicated genotypes were assayed for leucine uptake (d) and induction of the Slc7a5 gene encoding a large neutral a.a. transporter (e). (d) Mean (± SEM) leucine uptake by the cultured cells, normalized in each independent experiment (n=3) to activated WT cells. (e) VHL loss leads to HIF-dependent attenuation of Slc7a5 mRNA levels. WT or cKO B cells of the indicated genotypes were activated and cultured at 21% O2 as in Fig. 3d. Mean (± SEM) qPCR results normalized first to actin for level within a sample, and then to the WT control in each independent experiment (n=3). (f) Leucine stimulates mTORC1 activity in activated B cells. Activated WT B cells, divided and cultured overnight in medium lacking or sufficient for the indicated a.a., were restimulated and analyzed as in Fig. 4a, b.
Extended Data Figure 8
Extended Data Figure 8. Hypoxia promotes AMPK activity and induction of the mTORC1 inhibitor REDD1 without repressing mTORC2
(a) B cells were activated and grown (2 d) in LPS and BAFF at the indicated pO2 and in the presence or absence of IFN-γ as indicated. ATP concentrations in equal numbers of cells were then assayed. In each of three replicate experiments with similar results, the [ATP] measured for cells at conventional (21%) pO2 without IFN-γ was set as 1, and the mean (±SEM) levels in each sample relative to this reference are shown for three biological replicates. (b) Immunoblot results after probing membranes with anti-p-ACC, anti-p-AMPK(T172), and actin are shown for one representative experiment. Numbers indicate the level of signal for cells cultured in hypoxia or DMOG as compared to the reference value of the sample cultured in conventional (21%) pO2, after normalization of each sample according to its loading. (c) Results of a representative qRT2-PCR experiment measuring Redd1 mRNA in WT B cells (activated and cultured as in panel b), with each sample first normalized to Actin mRNA and then to vehicle-treated cells. (d, e) Effect of VHL, hypoxia, and DMOG on Akt phosphorylation in B cells. (d) B cells were activated with anti−IgM and BAFF, cultured (2 d) and rested (20 h) under conditions of hypoxia, or normoxia in the presence or absence of DMOG, after which cells were re-stimulated (20 min) with anti−IgM. (e) As in (d), B cells from WT or conditionally deleted Vhl cKO mice were activated with anti−IgM in the presence of BAFF, cultured (2 d) and rested (20 h), after which cells were re-stimulated (20 min) with anti−IgM. Shown are results of immunoblots probed with antibodies directed against p-Akt (T308), p-Akt (S473), and Akt. Numbers show the quantitation of signal relative to B cells that were not restimulated, after adjustment of each sample for loading as determined by total Akt. Data shown are from one representative experiment among three independent replicates.
Extended Data Figure 9
Extended Data Figure 9. mTORC1 regulates expansion of Ag-specific B cells and Ab class spectrum
(a) Results of immunoblots using anti-Raptor, and anti-p-S6 along with anti-S6 Ab as a loading control. B cells (WT or haploinsufficient for Raptor) were activated with F(ab’)2 anti−IgM and BAFF, cultured (2 d) and rested (20 h), after which cells were re-stimulated (20 min) with F(ab’)2 anti−IgM. Data are from one representative experiment among three independent replicates. (b) Recipient Ab controls for effect of mTORC1 on class-switched Ab responses. As in Fig. 4c, WT or Raptor-haploinsufficent B cells (from heterozygous mice that were ROSA26-CreERT2, Rptor f/+ and converted to Δ/+ by tamoxifen injections) were mixed with CD4+ OTII TCR transgenic T cells, transferred into Ig CH allotype-disparate recipient mice, immunized with NP-OVA, and harvested at 3 wk after primary immunization. Donor- ([b] allotype) (in Fig. 4) or recipient-derived ([a] allotype) NP-specific IgG1 and IgG2c levels in the sera were analyzed by ELISA. Mean (±SEM) absorbance data averaging samples [n=9 (WT) vs. 8 (Rptor +/Δ)] obtained in three separate experiments (measured on the same ELISA plate). (c–e) WT or Rptor Δ/+ B cells were mixed with CD4+ T cells (polyclonal : OVA-specific = 4: 1) and transferred into Rag0 mice and immunized with NP-OVA. Shown are the recoveries of Ag (NP)-binding WT vs Rptor Δ/+ B cells of GC-phenotype (B220+ GL7+ IgD) (c) and early memory (B220+ CD38+ GL7 IgD) (d). (e) Generation of Ag-specific IgG2c-secreting cells depends on mTORC1. Mean (±SEM) results of ELISpot assays quantitating NP-binding IgG2c (b allotype) Ab-secreting cells (ASC) from the experiments in Fig. 4c, d, and Extended Data Fig. 9b, quantified as described in Extended Data Fig. 6a.
Extended Data Figure 10
Extended Data Figure 10. mTORC1 is rate-limiting for AID expression and switching to IgG2c
(a) A division-independent mechanism dependent on mTORC1 quantity in B cell switching to IgG2c. Flow cytometric data in the B cell gate, displaying CFSE partitioning (fluorescein emission intensities) versus the IgG2c, were all from one experiment representative of three independent biological replicates. WT or Rptor Δ/+ B cells were stained with CFSE and cultured with LPS, BAFF and IFN-γ, and analyzed by flow cytometry. (b) WT or Rptor Δ/+ B cells were cultured (2 d) with LPS, BAFF, and IFN-γ. Mean (±SEM) levels of mRNA encoded by the Aidca (left) and Tbx21 (right) genes measured in three independent replicate experiments by qRT2-PCR normalized to actin in the sample and then to the level in WT cells (set as relative level of 1). (c) Immunoblots probed for Raptor, T-bet, and actin, as indicated, using B cells as in (b). [representative of n=3 independent experiments] (d) mTOR promotes switching to IgG by division- independent mechanisms. As in panel a, but CFSE-stained WT B cells were activated and cultured for 4 days with LPS, BAFF and IFN-γ in the presence or absence of rapamycin vs vehicle. (e, f) mTORC1 regulation of AID level in collaboration with T-bet determines efficient switching to IgG2c. B cells were transduced with MIT, MIG, MIT-T-bet or pMx-GFP-AID retrovectors, and cultured with BAFF and LPS ± IFN-γ in the presence or absence of rapamycin (5 nM). (e) Representative flow data, from one experiment among three independent replicates, derived as in Extended Data Fig. 4e. (f) Mean (±SEM) frequencies of surface IgG2c+ events among B220+ cells analyzed 4 d after transduction are shown (n=3 independent experiments).
Figure 1
Figure 1. Hypoxia in GC Light Zones
(a) Flow cytometry of HIF-1α in GC-phenotype B cells (GL7+ B220+ gate) from SRBC-immunized mice, and in the GL7 B220+ gate, compared to controls [rIgG1 instead of primary anti-HIF Ab; Extended Data Fig. 1a, Hif1a Δ B cells stained with anti-HIF-1α]. (b) Immune fluorescent staining of HIF-1α (left) or controls (right) (as in Fig. 1a) in GC (GL7+ IgD) and surrounding follicles (IgD+ GL7), and mean (±SEM) quantified HIF-1α signals within GCs compared to the GL7 follicular cells. Extended Data Fig. 1b, Hif1a Δ B cells stained with anti-HIF-1α. (c–e) GC hypoxia. Adducts, IgD, and GL7 were stained after immunized mice were injected with EF5, pimonidazole, or PBS. (c) Anti-pimonidazole staining of spleen sections [representative of 24 GC in 9 sections from 3 independent experiments, quantified in Extended Data Fig. 1c]. (d) Bar graphs with mean (±SEM) quantified EF5 signals (Extended Data Fig. 1d) within GC compared to the GL7 follicles, as in Fig. 1b. (m= 19 GC from n= 5 mice each condition, PBS and EF5; x=3 independent experiments). (e) A representative flow cytometry result (n = 3 experiments) with anti-EF5 staining of spleen cells after intravital injection with EF5 or PBS, as in (c, d), gated as in (a). (f) Hypoxia maps mostly to the light zone. Spleen sections as in (e), stained for CD35, GL7, and EF5, and mean (±SEM) anti-EF5 in CD35+ and CD35- regions, quantified as in Fig. 1d. (g) Flow cytometric measurements of S-phase (BrdU+) GC B cells that were either hypoxic (EF5hi) or not (EF5lo), from mice as in (e) after BrdU injection. (h) Mean (±SEM) data for n= 7 samples in two independent experiments. (i) Mean (±SEM) fractions of cleaved caspase 3-positive (CC3+) GCB cells gated as in (g), but stained for activated caspase 3.
Figure 2
Figure 2. Hypoxia regulates B cell survival, proliferation, and class switching
(a) O2 modulates the spectrum of Ab isotypes. Surface IgG1, IgG2c and IgA on B220+-gated cells, measured by flow cytometry after activation of purified B cells culture at pO2 of 21% (“normoxia”), 5%, or 1% (“hypoxia”) using conditions promoting IgG1, IgG2c, or IgA. Flow cytometry data from one representative experiment along with bar graphs showing aggregate results of cell numbers and switch efficiencies (n=4 for 5%, n=7 for 1, 21% pO2). (b) Flow cytometry of surface IgG2c (right panels) on B cells gated by division number (left panels) after activation of CellTrace Violet (CTV)-stained B cells and culture with IFN-γ as in (a). Inset numbers (bold font) denote the % of switched B cells at indicated division numbers in this analysis; mean (±SEM) values from the independent replicate experiments (n=3) are italicized. Shaded overlay: CTV fluorescence of undivided cells cultured only in BAFF. (c, d) AID regulated by oxygen sufficiency. (c) Aicda mRNA was quantitated in B cells activated and cultured as in (a), or in the presence or absence of PHD inhibitor DMOG. (d) Relative AID expression, measured as GFP fluorescence in AID-GFP transgenic B cells stained with CellTrace Violet, activated and cultured in the conditions of (a, b)]. Representative GFP fluorescence versus divisions for B220+ cells [mean (±SEM) quantified data from four independent replicate analyses are in Extended Data Fig. 2g]. (e, f) Hypoxia and PHD inhibition reduce T-bet and Iγ2c germ line transcript (GLT) induction, but not Rora or Iα. Iγ2c (e) and Tbx21 (f) mRNA measured after B cell cultures in IgG2c conditions; Iα GLT (e) and Rora (f) mRNA in B cells cultured for IgA switching [B.L.D., below limit of detection]. (e, f) mean (±SEM) data (n=3–4 expts).
Figure 3
Figure 3. B cell-intrinsic role of pVHL in Ab response qualities
(a–c) In adoptive transfer experiments [schematic diagram, Extended Data Fig. 5a], B cells purified from tamoxifen-treated mice were transferred into recipients after mixing with CD4+ T cells (polyclonal : Ag-specific = 4:1). Recipients were analyzed after primary (10) immunization or, for memory responses [Extended Data Fig. 5d], after the 10 and a recall immunization. (a, b) VHL reduction causes HIF-dependent alterations in Ab responses. (a) Primary NP-specific IgG2c Ab response in Rag0 recipients of WT or Vhl f/f, CreERT2 B cells from tamoxifen-treated donor mice. (n=5 recipients of each genotype, distributed evenly between two independent replicate experiments. Other Ab isotypes are in Extended Data Fig. 5. (b) High- (NP2), or all-affinity (NP20) anti-NP Ab of the indicated isotypes in sera from immunized recipients, measured by ELISA. Each dot represents one mouse (n=9 of each genotype [WT, Vhl Δ/Δ (Vhl cKO), or Vhl Δ/Δ Hif1a Δ/Δ Epas1 Δ/Δ (V;H1;H2 cKO)], distributed evenly among 3 independent experiments); horizontal lines denote the mean values. (c) HIF-dependent reduction of Ag-specific B cell populations. Flow cytometry results scoring NP-binding B cells of GC (B220+ GL7+ IgD) and early memory (B220+ CD38+ IgM+ GL7 IgD) phenotypes. One representative result from the same mice and experiments as (b). [Extended Data Fig. 6c, d, mean (±SEM) values]. (d) VHL in B cells promotes Aicda and Tbx21 expression. WT and Vhl Δ/Δ B cells were activated, cultured, and analyzed as in Fig. 2c. (e) B cells transduced with MIT, MIG, MIT-T-bet or pMx-GFP-AID retrovectors were cultured with BAFF and LPS ± IFN-γ in the presence or absence of DMOG. Mean (±SEM) frequencies of surface IgG2c+ events among B220+ cells analyzed 4 d after transduction, with flow data from one experiment in Extended Data Fig. 4e (n=3 independent experiments).
Figure 4
Figure 4. mTORC1 activity in B cells regulates Ab qualities but is attenuated by hypoxia
(a) Immunoblots of lysates prepared from activated B cells cultured overnight at 21% or 1% pO2, before (−) and after (+) re-stimulation with anti-IgM. (b) Immunoblots of B cell extracts as in Fig. 4a, using WT and conditionally pVHL-depleted cells with either normal (Vhl cKO) or deficient (V;H1;H2 cKO) HIF expression. (c, d) Raptor promotes generation of high-affinity Ab and switch to IgG. IgHb (donor B cell-derived)-allotype anti-NP Ab were measured after immunization of (mice IgHa allotype) that had received WT or Rptor +/Δ B cells transfers. Mean (± SEM) ELISA results for all-affinity anti-NP IgG in primary response sera from recipient mice [n=9 (WT) vs. 8 (Rptor +/Δ)], captured on NP20 (c), and high-affinity Ab (IgM, 1:100; IgG1, 1:50) captured on NP2 (d). [IgG2c was undetectable, as in (c)]. (e, f) mTORC1 promotes AID expression. GFP in B220+-gated cells in flow cytometry after B cells were cultured (4 d) with LPS, BAFF, and IL-4 or IFN-γ as indicated. (e) Rptor +/+ or Δ/+ AID-GFP transgenic mice. (f) Rptor +/+ AID-GFP cells cultured in rapamycin (10 nM) or vehicle.

References

    1. Victora GD, Nussenzweig MC. Germinal centers. Annu Rev Immunol. 2012;30:429–457. - PubMed
    1. Shlomchik MJ, Weisel F. Germinal center selection and the development of memory B and plasma cells. Immunol Rev. 2012;247:52–63. - PubMed
    1. Xu Z, Zan H, Pone EJ, Mai T, Casali P. Immunoglobulin class-switch DNA recombination: induction, targeting and beyond. Nat Rev Immunol. 2012;12:517–531. - PMC - PubMed
    1. Stavnezer J, Guikema JE, Schrader CE. Mechanism and regulation of class switch recombination. Annu Rev Immunol. 2008;26:261–292. - PMC - PubMed
    1. Cui G, et al. IL-7-Induced Glycerol Transport and TAG Synthesis Promotes Memory CD8+ T Cell Longevity. Cell. 2015;161:750–761. - PMC - PubMed

MeSH terms