

Temporal Patterns in the Abundance of a Critically Endangered Marsupial Relates to Disturbance by Roads and Agriculture
- PMID: 27501320
- PMCID: PMC4976897
- DOI: 10.1371/journal.pone.0160790
Temporal Patterns in the Abundance of a Critically Endangered Marsupial Relates to Disturbance by Roads and Agriculture
Abstract
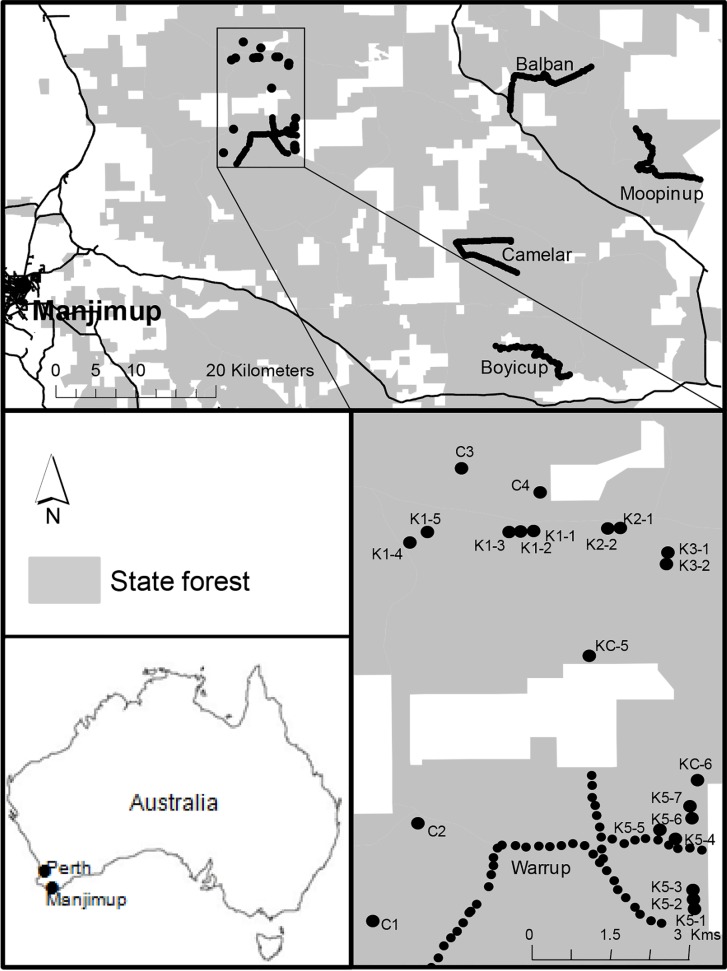
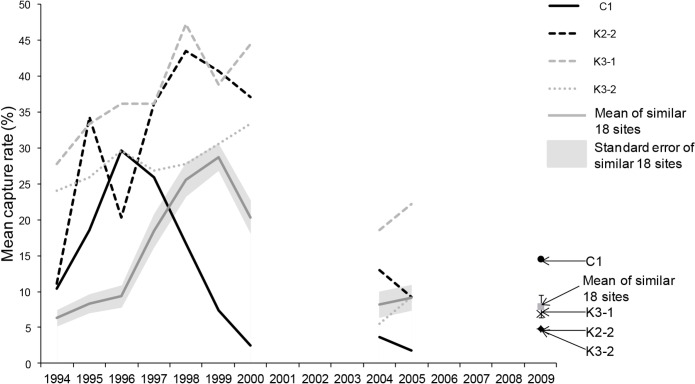
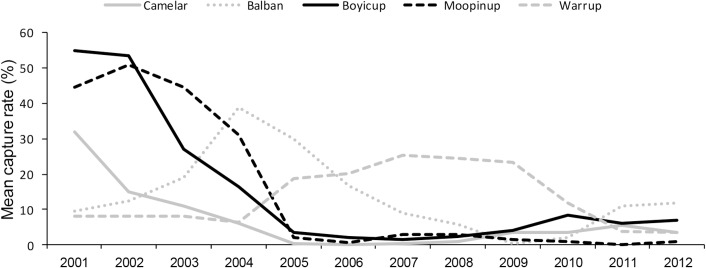
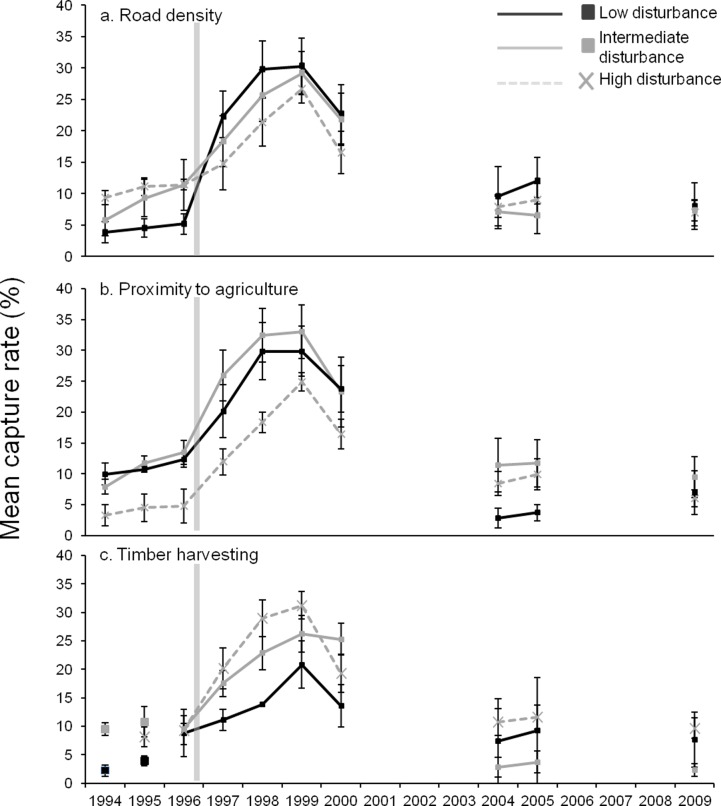
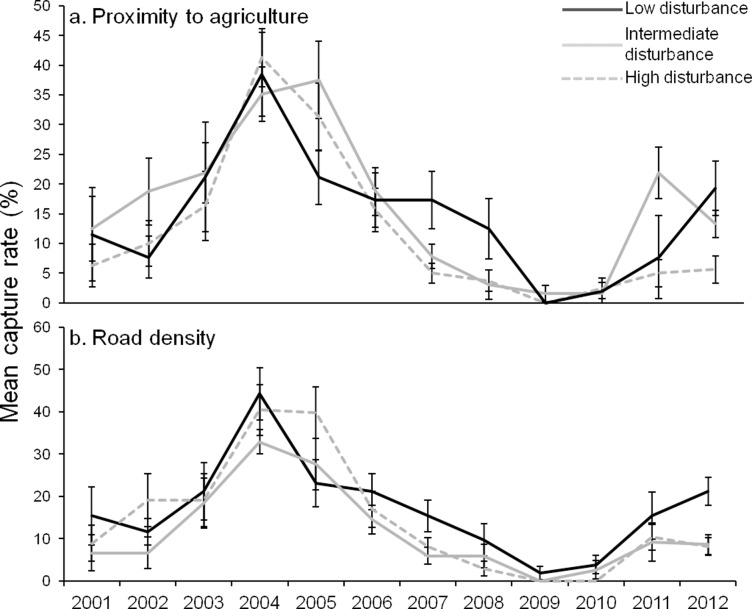
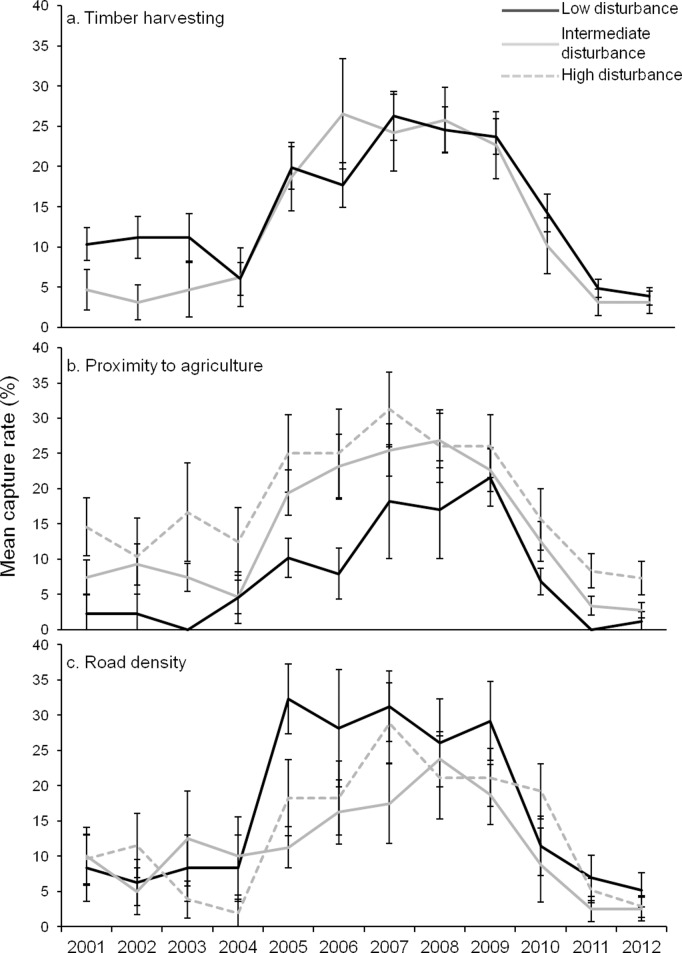
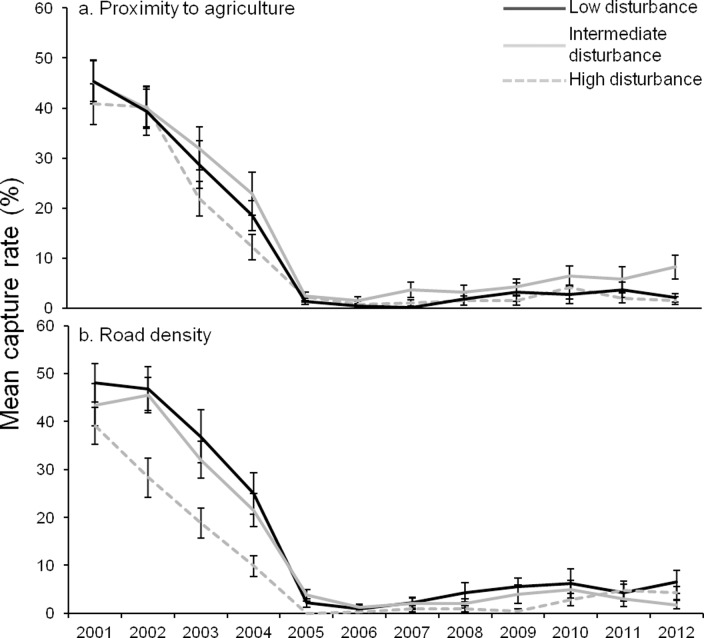
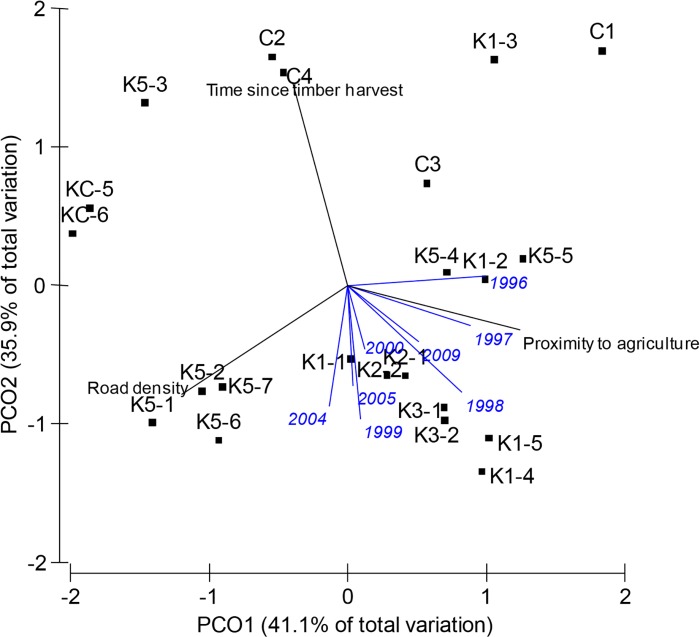
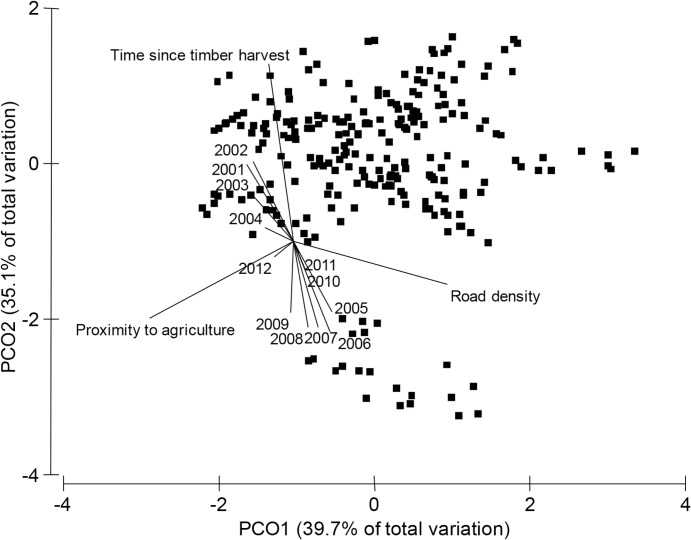
The aim of this study was to investigate how landscape disturbance associated with roads, agriculture and forestry influenced temporal patterns in woylie (Bettongia penicillata) abundance before, during and after periods of rapid population change. Data were collected from an area of approximately 140,000 ha of forest within the Upper Warren region in south-western Australia. Woylie abundance was measured using cage trapping at 22 grid and five transect locations with varying degrees of landscape disturbance between 1994 and 2012. We found evidence that the distribution and abundance of woylies over time appears to be related to the degree of fragmentation by roads and proximity to agriculture. Sites furthest from agriculture supported a greater abundance of woylies and had slower rates of population decline. Sites with fewer roads had a greater abundance of woylies generally and a greater rate of increase in abundance after the implementation of invasive predator control. The results of this study suggest that landscape disturbance is less important at peak population densities, but during times of environmental and population change, sites less dissected by roads and agriculture better support woylie populations. This may be due to the role these factors play in increasing the vulnerability of woylies to introduced predators, population fragmentation, weed species invasion, mortality from road collisions or a reduction in available habitat. Strategies that reduce the impact of disturbance on woylie populations could include the rationalisation of forest tracks and consolidation of contiguous habitat through the acquisition of private property. Reducing the impact of disturbance in the Upper Warren region could improve the resilience of this critically important woylie population during future environmental change.
Conflict of interest statement
Figures
Similar articles
-
Temporal and spatial dynamics of trypanosomes infecting the brush-tailed bettong (Bettongia penicillata): a cautionary note of disease-induced population decline.Parasit Vectors. 2014 Apr 7;7:169. doi: 10.1186/1756-3305-7-169. Parasit Vectors. 2014. PMID: 24708757 Free PMC article.
-
Evaluating Stress Physiology and Parasite Infection Parameters in the Translocation of Critically Endangered Woylies (Bettongia penicillata).Ecohealth. 2017 Mar;14(Suppl 1):128-138. doi: 10.1007/s10393-017-1214-4. Epub 2017 Feb 17. Ecohealth. 2017. PMID: 28213652
-
Identification of novel Babesia and Theileria genotypes in the endangered marsupials, the woylie (Bettongia penicillata ogilbyi) and boodie (Bettongia lesueur).Exp Parasitol. 2012 May;131(1):25-30. doi: 10.1016/j.exppara.2012.02.021. Epub 2012 Mar 10. Exp Parasitol. 2012. PMID: 22433913
-
Trypanosomes in a declining species of threatened Australian marsupial, the brush-tailed bettong Bettongia penicillata (Marsupialia: Potoroidae).Parasitology. 2008 Sep;135(11):1329-35. doi: 10.1017/S0031182008004824. Epub 2008 Aug 28. Parasitology. 2008. PMID: 18752704
-
Effects of road networks on bird populations.Conserv Biol. 2011 Apr;25(2):241-9. doi: 10.1111/j.1523-1739.2010.01635.x. Epub 2011 Feb 1. Conserv Biol. 2011. PMID: 21284729 Review.
References
-
- Jones JA, Swanson FJ, Wemple BC, Snyder KU. Effects of roads on hydrology, geomorphology, and disturbance patches in stream networks. Conserv Biol. 2000; 14(1): 76–85.
-
- Bennett A. Roads, roadsides and wildlife conservation: a review. Nature conservation 2: the role of corridors. 1991: 99–117.
-
- Rogers P. Disturbance ecology and forest management: a review of the literature Ogden, Utah: US Department of Agriculture, Forest Service, Intermountain Research Station; 1996.
-
- Wayne AF, Maxwell M, Ward CG, Vellios CV, Ward BG, Liddelow GL, et al. Importance of getting the numbers right: quantifying the rapid and substantial decline of an abundant marsupial, Bettongia penicillata. Wildl Res. 2013; 40(3): 169–83.
-
- Li Y, Lancaster ML, Cooper SJ, Taylor AC, Carthew SM. Population structure and gene flow in the endangered southern brown bandicoot (Isoodon obesulus obesulus) across a fragmented landscape. Conserv Genet. 2015; 16(2): 331–45.
MeSH terms
LinkOut - more resources
Full Text Sources
Other Literature Sources
