

Psychophysical Tracking Method to Measure Taste Preferences in Children and Adults
- PMID: 27501332
- PMCID: PMC6445264
- DOI: 10.3791/54163
Psychophysical Tracking Method to Measure Taste Preferences in Children and Adults
Abstract
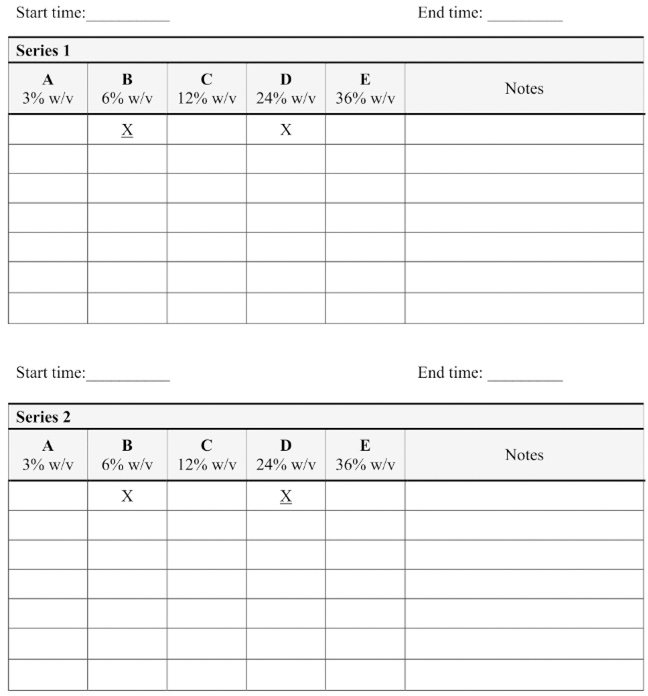
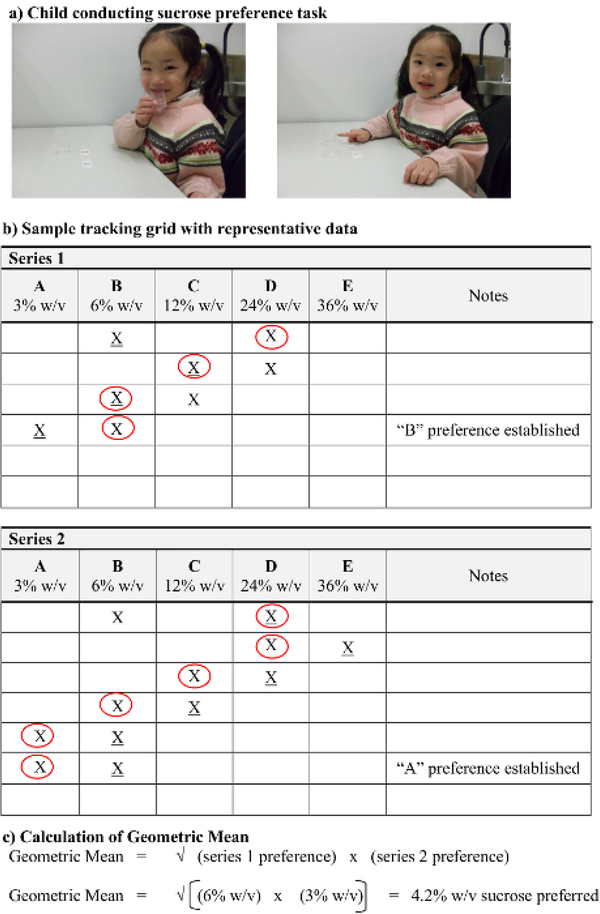
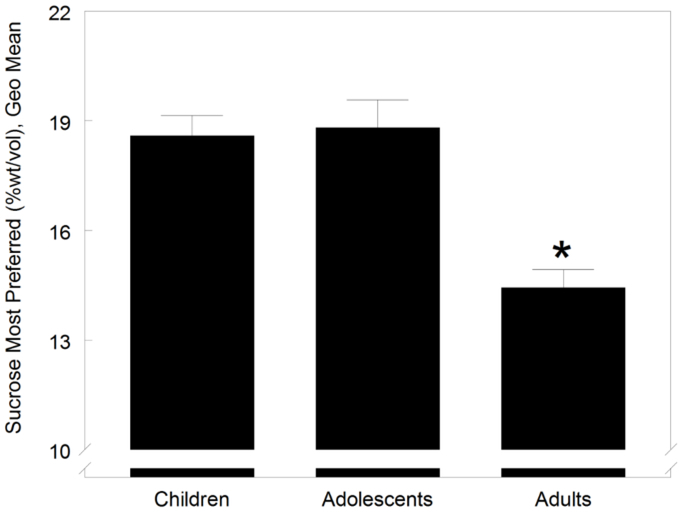
The Monell two-series, forced-choice, paired-comparison tracking method provides a reliable measure of sweet taste preferences from childhood to adulthood. The method, which is identical for children, adolescents, and adults, is of short duration (< 15 min), does not rely on sustained attention or place demands on memory (which would yield spurious age differences), and minimizes the impact of language development, making this method amenable to the cognitive limitations of pediatric populations. In this whole-mouth tasting method, subjects are asked to taste (without swallowing) pairs of solutions of different sucrose concentrations and to point to the solution they prefer. Each subsequent pair contains the participant's preceding preferred concentration and an adjacent stimulus concentration. The procedure continues until the subject chooses either a given concentration of sucrose when paired with both a higher and a lower concentration, or the highest or lowest concentration two consecutive times. Subjects are prevented from reaching response criteria on the basis of first or second position bias by the two-series design of the method, which counterbalances the order of solution presentation within each pair between the series (the weaker concentration is presented first in Series 1, second in Series 2). The geometric mean of the two sucrose concentrations chosen in Series 1 and 2 is an estimate of the participant's most preferred level of sucrose. Sucrose preference as determined with this laboratory-based measure has been shown to be associated with preference for sugars in foods and beverages and with taste receptor genotype, family history of alcoholism, and race/ethnicity, as well as depressive symptomatology among pediatric populations. The method has real-world relevance and has been applied to determine most preferred level of other tastes (e.g., salt), making it a valuable psychophysical tool.
Conflict of interest statement
Disclosures
The authors declare they have no competing financial interests.
Figures
Similar articles
-
Genetic and environmental determinants of bitter perception and sweet preferences.Pediatrics. 2005 Feb;115(2):e216-22. doi: 10.1542/peds.2004-1582. Pediatrics. 2005. PMID: 15687429 Free PMC article.
-
Evaluation of the Monell forced-choice, paired-comparison tracking procedure for determining sweet taste preferences across the lifespan.Chem Senses. 2011 May;36(4):345-55. doi: 10.1093/chemse/bjq134. Epub 2011 Jan 12. Chem Senses. 2011. PMID: 21227904 Free PMC article.
-
Preferences for salty and sweet tastes are elevated and related to each other during childhood.PLoS One. 2014 Mar 17;9(3):e92201. doi: 10.1371/journal.pone.0092201. eCollection 2014. PLoS One. 2014. PMID: 24637844 Free PMC article. Clinical Trial.
-
Psychophysical Tracking Method to Assess Taste Detection Thresholds in Children, Adolescents, and Adults: The Taste Detection Threshold (TDT) Test.J Vis Exp. 2021 Apr 21;(170):10.3791/62384. doi: 10.3791/62384. J Vis Exp. 2021. PMID: 33970129 Free PMC article.
-
Genetic variation in taste perception: does it have a role in healthy eating?Proc Nutr Soc. 2011 Feb;70(1):135-43. doi: 10.1017/S0029665110003976. Epub 2010 Nov 22. Proc Nutr Soc. 2011. PMID: 21092367 Review.
Cited by
-
Sweet taste preference on snack choice, added sugars intake, and diet quality- a pilot study.BMC Nutr. 2025 May 13;11(1):94. doi: 10.1186/s40795-025-01076-4. BMC Nutr. 2025. PMID: 40361248 Free PMC article.
-
No significant salt or sweet taste preference or sensitivity differences following ad libitum consumption of ultra-processed and unprocessed diets: a randomized controlled pilot study.Chem Senses. 2023 Jan 1;48:bjad007. doi: 10.1093/chemse/bjad007. Chem Senses. 2023. PMID: 36897799 Free PMC article. Clinical Trial.
-
Characterizing Individual Differences in Sweet Taste Hedonics: Test Methods, Locations, and Stimuli.Nutrients. 2022 Jan 15;14(2):370. doi: 10.3390/nu14020370. Nutrients. 2022. PMID: 35057551 Free PMC article.
-
Exposure to a slightly sweet lipid-based nutrient supplement during early life does not increase the level of sweet taste most preferred among 4- to 6-year-old Ghanaian children: follow-up of a randomized controlled trial.Am J Clin Nutr. 2019 Apr 1;109(4):1224-1232. doi: 10.1093/ajcn/nqy352. Am J Clin Nutr. 2019. PMID: 30915467 Free PMC article. Clinical Trial.
-
A systematic review of the biological mediators of fat taste and smell.Physiol Rev. 2023 Jan 1;103(1):855-918. doi: 10.1152/physrev.00061.2021. Epub 2022 Sep 15. Physiol Rev. 2023. PMID: 36409650 Free PMC article.
References
-
- Desor JA, Maller O, Turner RE Preference for sweet in humans: infants, children and adults In Taste and development: the genesis of sweet preference. ed Weiffenbach JM, 161–172, US Government Printing Office, (1977).
-
- Mennella JA Taste and smell In Pediatric Neurology: Principles and Practice. eds Swaiman KF, Ashwall S, & Ferriero D, Ch. 9, 135–149, CV Mosby Company, (2006).
-
- Birch LL, Anzman-Frasca S Learning to prefer the familiar in obesogenic environments. Nestle Nutr Workshop Ser Pediatr Program. 68 187–196; discussion 196–189 (2011). - PubMed
Publication types
MeSH terms
Substances
Grants and funding
LinkOut - more resources
Full Text Sources
Other Literature Sources
Medical
