. 2016 Oct;12(10):802-809.
doi: 10.1038/nchembio.2145. Epub 2016 Aug 8.

FRET binding antenna reports spatiotemporal dynamics of GDI-Cdc42 GTPase interactions

Affiliations

FRET binding antenna reports spatiotemporal dynamics of GDI-Cdc42 GTPase interactions

Louis Hodgson et al. Nat Chem Biol. 2016 Oct.

Abstract

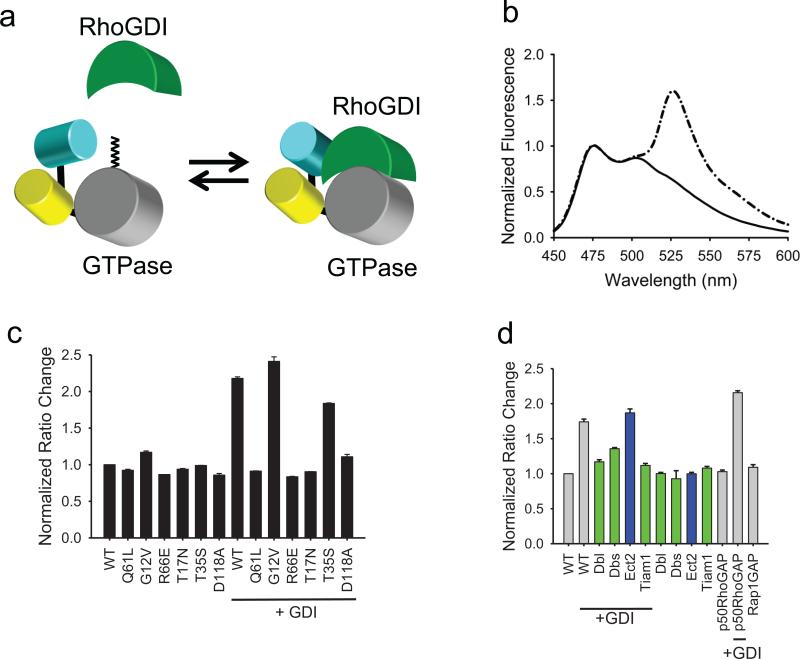
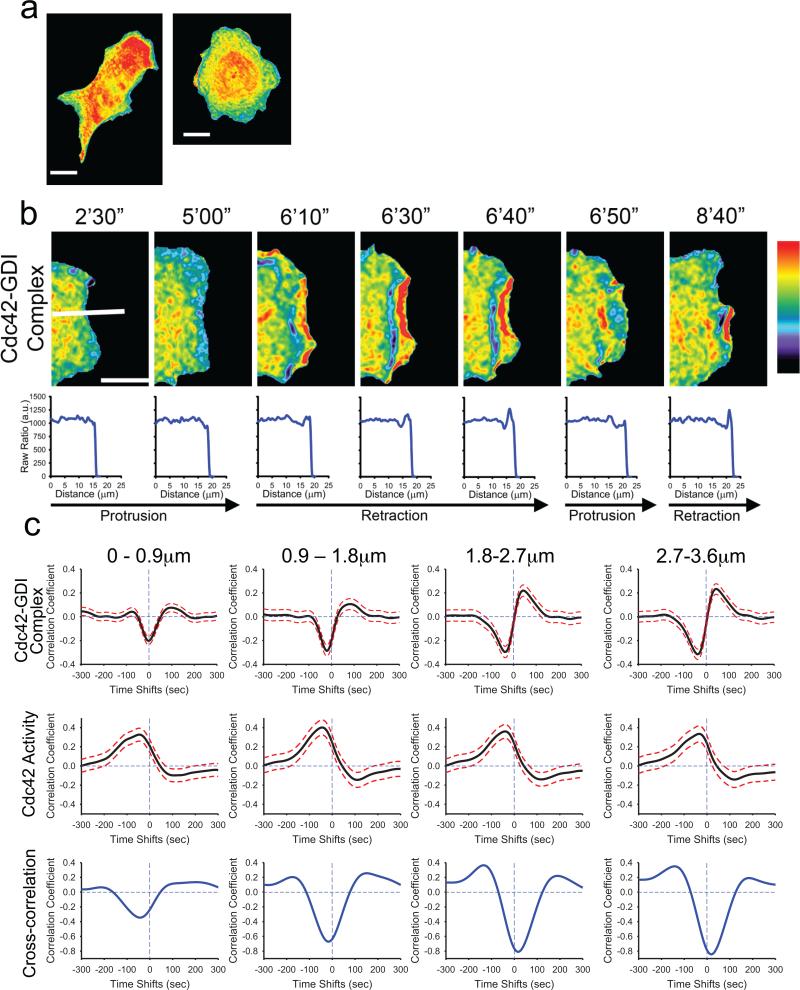
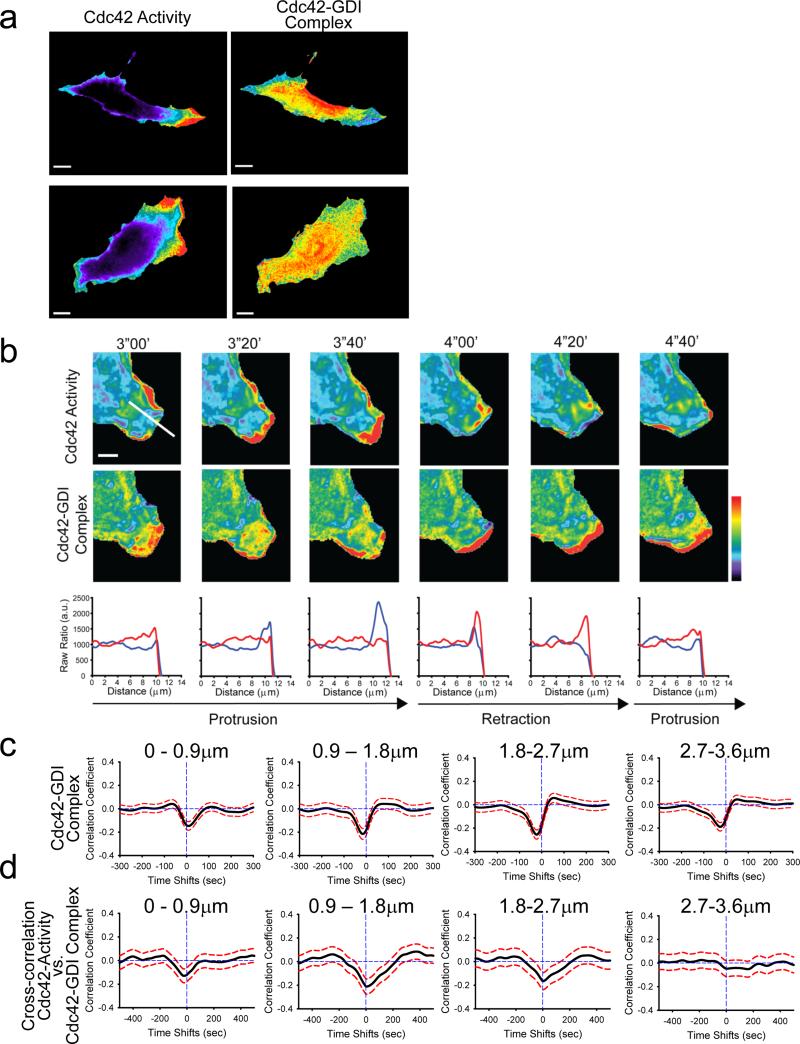
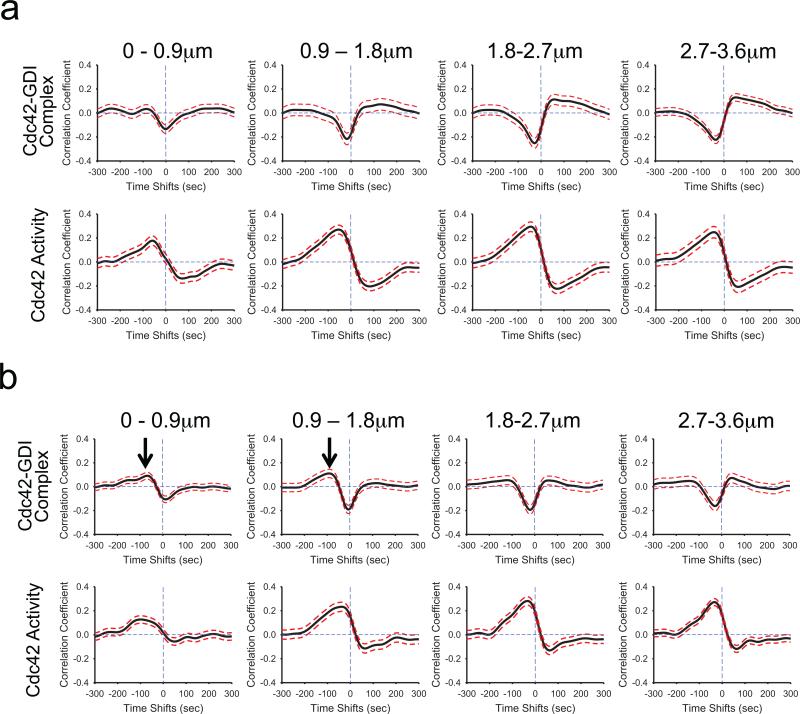
Guanine-nucleotide dissociation inhibitors (GDIs) are negative regulators of Rho family GTPases that sequester the GTPases away from the membrane. Here we ask how GDI-Cdc42 interaction regulates localized Cdc42 activation for cell motility. The sensitivity of cells to overexpression of Rho family pathway components led us to a new biosensor, GDI.Cdc42 FLARE, in which Cdc42 is modified with a fluorescence resonance energy transfer (FRET) 'binding antenna' that selectively reports Cdc42 binding to endogenous GDIs. Similar antennae could also report GDI-Rac1 and GDI-RhoA interaction. Through computational multiplexing and simultaneous imaging, we determined the spatiotemporal dynamics of GDI-Cdc42 interaction and Cdc42 activation during cell protrusion and retraction. This revealed remarkably tight coordination of GTPase release and activation on a time scale of 10 s, suggesting that GDI-Cdc42 interactions are a critical component of the spatiotemporal regulation of Cdc42 activity, and not merely a mechanism for global sequestration of an inactivated pool of signaling molecules.


Figures

Fig.1
Fig.1
Design and validation of GDI.Cdc42 FLARE, a genetically encoded biosensor that reports localization of Cdc42-GDI complexes. a, The FRET of a “binding antenna” on Cdc42 is altered when Cdc42 binds endogenous GDI. b, A representative, normalized emission spectra of GDI.Cdc42 FLARE in HEK 293T cells (excitation 433 nm; normalized at the 474 nm emission peak). Solid line, wild-type biosensor; dash-dotted line, wild-type biosensor plus excess GDI. c, Normalized FRET/CFP emission ratios of GDI.Cdc42 FLARE mutants, expressed with and without excess GDI. d, Normalized FRET/CFP emission ratios of wildtype GDI.Cdc42 FLARE with co-expressed GEFs or GAPs, in the presence or absence of excess GDI. Green bars indicate Cdc42-interacting GEFs. Blue bars indicate GEFs that do not interact with Cdc42. For (b)–(d), Results are the mean of three independent measurements. Error bars represent ±SEM.
Fig.2
Fig.2
Cdc42-GDI complex localization in living cells. a, MEFs expressing the GDI.Cdc42 FLARE biosensor. Note the relatively uniform distribution of Cdc42-GDI complex except at the cell edges. b, Localization of GDI-Cdc42 at a cell edge undergoing protrusion/retraction cycles. Below each image is the fluorescence ratio measured along the white line shown in the first image GDI-Cdc42 complex is reduced at the cell edge during protrusion and increased during retraction. c, TOP: Correlation of Cdc42-GDI localization and edge velocity, measured using the GDI.Cdc42 FLARE biosensor. Correlation curves are computed from n = 704 individual windows in 8 cells (see Supplementary Fig. 6). MIDDLE: Correlation of Cdc42 activity and edge velocity measured in the wild-type MEFs using the MeroCBD biosensor. Correlation curves are computed from n = 420 individual windows in 7 cells. BOTTOM: Cross-correlation of the correlation curves shown in the top and middle rows. Panels (a) and (b) pseudocolor range: 1.0 = black; 1.4 = red. White bar indicates 10 μm.
Fig.3
Fig.3
Relationship between Cdc42 activation and GDI-Cdc42 localization monitored in the same cell. a, MEFs expressing the T35S mutant version of the GDI.Cdc42 FLARE biosensor and injected with the modified meroCBD biosensor. Left column: Cdc42 activity, Right Column: GDI-Cdc42 localization. (Pseudocolor scales: for Cdc42, Black=1.0, Red=7.46 (top cell), 2.82 (bottom cell); for GDI-Cdc42: Black=1.0, Red=1.51 (top cell), 1.97 (bottom cell). Bar = 20 μm). b, Cdc42 activation (TOP) and Cdc42-GDI localization (MIDDLE) in the same cell over time. (Pseudocolor scales: Cdc42 1.0–2.3, Cdc42-GDI 1.0–1.53. Bar = 5 μm). BOTTOM: Profile of Cdc42 activation (blue) and GDI-Cdc42 (red) along the line shown in the first panel of the top row. c, Correlation of Cdc42-GDI and edge velocity, measured using the T35S mutant of the GDI.Cdc42 FLARE biosensor. Correlation curves are computed from n = 886 individual windows in 7 cells. d, Correlation of Cdc42 activity and Cdc42-GDI monitored in the same cell, using the T35S mutant version of GDI.Cdc42 FLARE and the modified meroCBD. Correlation curves are computed from n = 420 individual windows in 7 cells.
Fig.4
Fig.4
Src-mediated phosphorylation of GDI at Y156 regulates the coordination of Cdc42-GDI localization and Cdc42 activity in regions close to the edge. a, A phosphorylation-deficient mutant of GDI (Y156F) had no effect on the timing of Cdc42 activation or modulation of GDI-Cdc42 localization. TOP: Correlation of Cdc42-GDI and edge velocity, using the T35S mutant of the GDI.Cdc42 FLARE biosensor expressed in cells containing Y156F GDI. Correlation curves are computed from n = 902 individual windows in 11 cells. BOTTOM: Correlation of Cdc42 activity and edge velocity using the MeroCBD biosensor in cells containing Y156F GDI. Correlation curves are computed from n = 373 individual windows from 5 cells. b, A phosphomimetic mutant of GDI (Y156E) produced positive correlation with edge velocity at negative time lags (i.e. after protrusion onset) similar to those of the correlation maxima of Cdc42 activity with edge velocity in regions close to the edge (0–1.8 μm; Black arrows). TOP: Cross-correlation of Cdc42-GDI and edge velocity using the T35S mutant of the GDI.Cdc42 FLARE biosensor expressed in cells containing the Y156E mutant GDI. Correlation curves are computed from n = 979 individual windows from 11 cells. Black arrows in regions 0–1.8 μm from the edge indicate the appearance of a positive cross correlation peak in GDI-Cdc42 complex localization. BOTTOM: Cross-correlation of Cdc42 activity and edge velocity, using the MeroCBD biosensor in cells containing GDI Y156E. Correlation curves are computed from n = 491 individual windows in 4 cells.

References

    1. Jaffe AB, Hall A. Rho GT Pases: biochemistry and biology. Annu Rev Cell Dev Biol. 2005;21:247–69. - PubMed
    1. Garcia-Mata R, Boulter E, Burridge K. The 'invisible hand': regulation of RHO GTPases by RHOGDIs. Nat Rev Mol Cell Biol. 2011;12:493–504. - PMC - PubMed
    1. Lawson CD, Burridge K. The on-off relationship of Rho and Rac during integrin-mediated adhesion and cell migration. Small GTPases. 2014;5:e27958. - PMC - PubMed
    1. Machacek M, et al. Coordination of Rho GTPase activities during cell protrusion. Nature. 2009;461:99–103. - PMC - PubMed
    1. Pertz O, Hodgson L, Klemke RL, Hahn KM. Spatiotemporal dynamics of RhoA activity in migrating cells. Nature. 2006;440:1069–72. - PubMed

Publication types

MeSH terms

Substances