

Measurement of the accurate mass of a 50 MDa infectious virus
- PMID: 27501430
- PMCID: PMC5137368
- DOI: 10.1002/rcm.7673
Measurement of the accurate mass of a 50 MDa infectious virus
Abstract
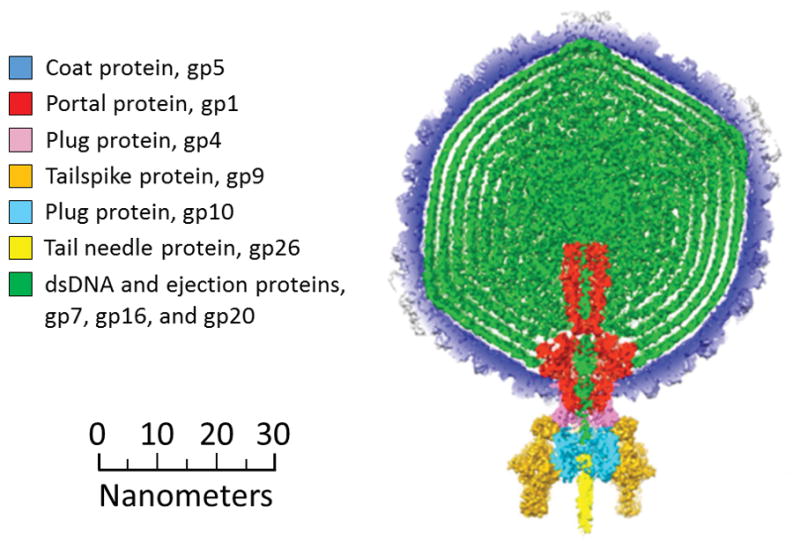
Rationale: Bacteriophage P22 is believed to contain a total of 521 copies of 9 different proteins and a 41,724 base pair genome. Despite its enormous size and complexity, phage P22 can be electrosprayed, and it remains intact in ultra-high vacuum where its molar mass distribution has been measured.
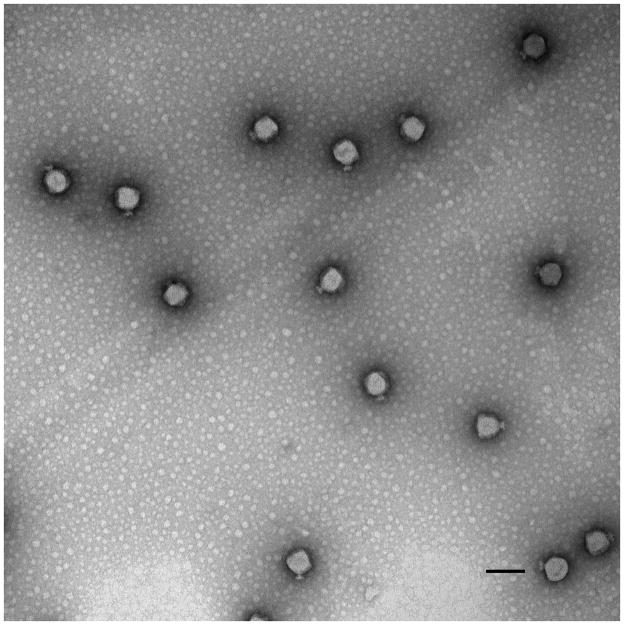
Methods: Phage P22 virions were generated by complementation in Salmonella enterica and purified. They were transferred into 100 mM ammonium acetate and then electrosprayed. The masses of individual virions were determined using charge detection mass spectrometry.
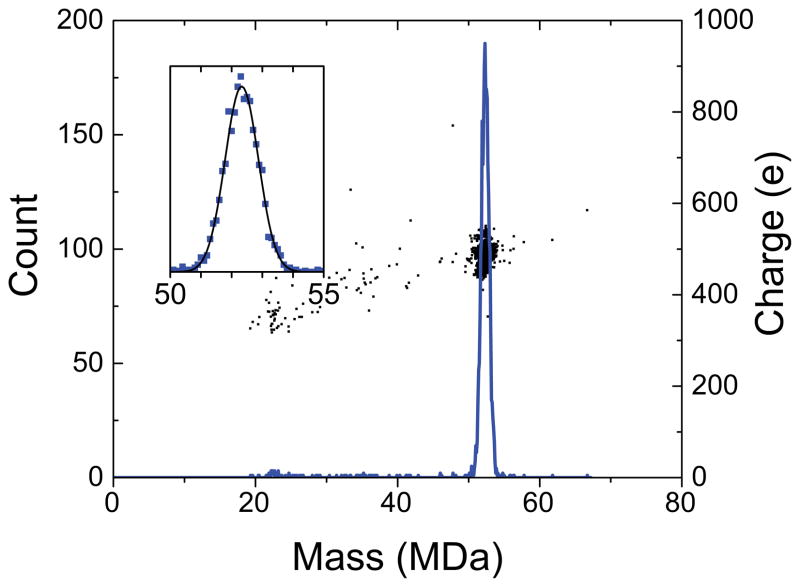
Results: The stoichiometry of the protein components of phage P22 is sufficiently well known that the theoretical molar mass can be determined to within a narrow range. The measured average molar mass of phage P22, 52,180 ± 59 kDa, is consistent with the theoretical molar mass and supports the proposed stoichiometry of the components. The intrinsic width of the phage P22 mass distribution can be accounted for by the distribution of DNA packaged by the headful mechanism.
Conclusions: At over 50 MDa, phage P22 is the largest object with a well-defined molar mass to be analyzed by mass spectrometry. The narrow measured mass distribution indicates that the virions survive the transition into the gas phase intact. Copyright © 2016 John Wiley & Sons, Ltd.
Copyright © 2016 John Wiley & Sons, Ltd.
Figures
References
-
- Ganem B, Li YT, Henion JD. Observation of noncovalent enzyme-substrate and enzyme-product complexes by ion-spray mass spectrometry. J Am Chem Soc. 1991;113:7818.
-
- Light-Wahl KJ, Schwartz BL, Smith RD. Observation of the noncovalent quaternary associations of proteins by electrospray ionization. J Am Chem Soc. 1994;116:5271. - PubMed
-
- Loo JA. Observation of large subunit protein complexes by electrospray ionization mass spectrometry. J Mass Spectrom. 1995;30:180.
-
- Rostom AA, Robinson CV. Detection of the intact GroEL chaperonin assembly by mass spectrometry. J Am Chem Soc. 1999;121:4718.
-
- Wang Y, Schubert M, Ingendoh A, Franzen J. Analysis of non-covalent protein complexes up to 290 kDa using electrospray ionization and ion trap mass spectrometry. Rapid Commun Mass Spectrom. 2000;14:12. - PubMed
Publication types
MeSH terms
Substances
Grants and funding
LinkOut - more resources
Full Text Sources
Other Literature Sources