

Local adaptation of a bacterium is as important as its presence in structuring a natural microbial community
- PMID: 27501868
- PMCID: PMC4980492
- DOI: 10.1038/ncomms12453
Local adaptation of a bacterium is as important as its presence in structuring a natural microbial community
Abstract
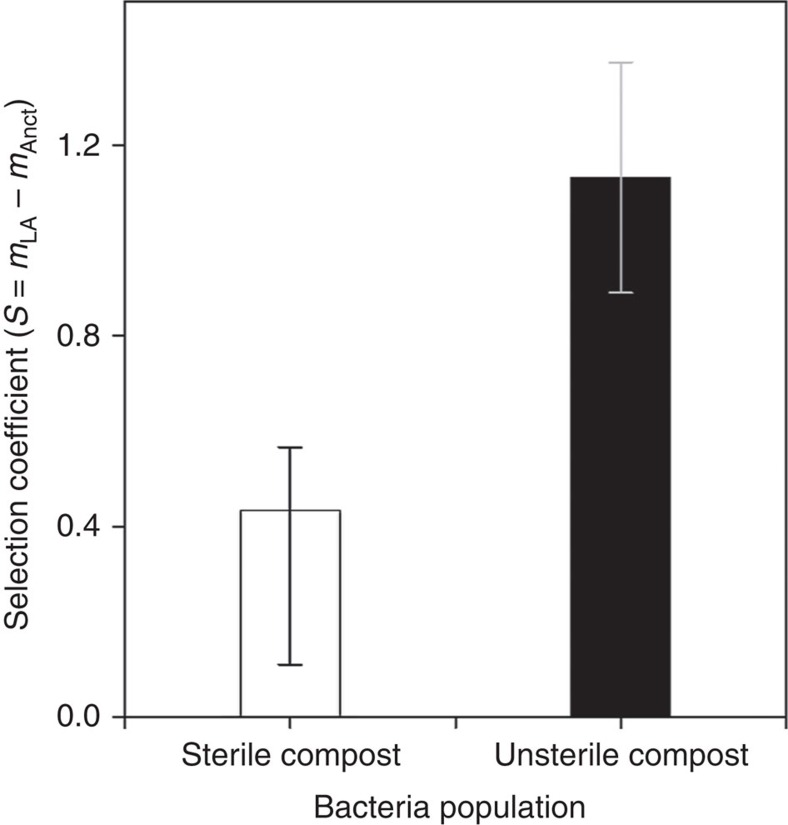
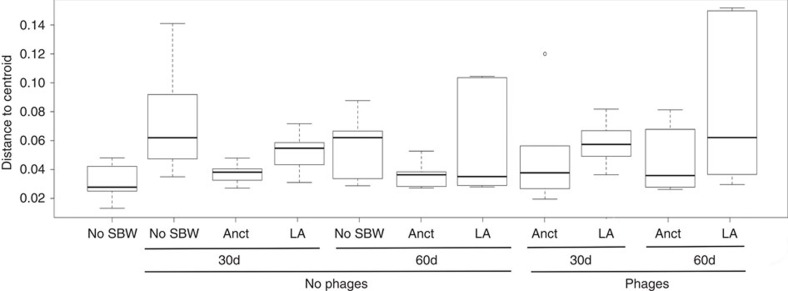
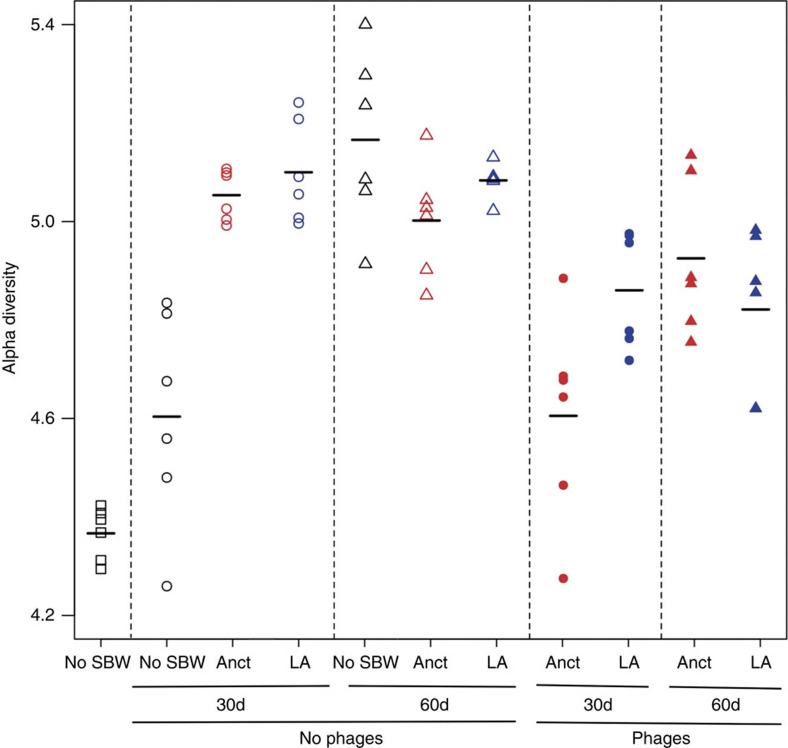
Local adaptation of a species can affect community composition, yet the importance of local adaptation compared with species presence per se is unknown. Here we determine how a compost bacterial community exposed to elevated temperature changes over 2 months as a result of the presence of a focal bacterium, Pseudomonas fluorescens SBW25, that had been pre-adapted or not to the compost for 48 days. The effect of local adaptation on community composition is as great as the effect of species presence per se, with these results robust to the presence of an additional strong selection pressure: an SBW25-specific virus. These findings suggest that evolution occurring over ecological time scales can be a key driver of the structure of natural microbial communities, particularly in situations where some species have an evolutionary head start following large perturbations, such as exposure to antibiotics or crop planting and harvesting.
Figures
Similar articles
-
Rapid decline of adaptation of Pseudomonas fluorescens to soil biotic environment.Biol Lett. 2022 Mar;18(3):20210593. doi: 10.1098/rsbl.2021.0593. Epub 2022 Mar 9. Biol Lett. 2022. PMID: 35259940 Free PMC article.
-
Specific adaptation to strong competitors can offset the negative effects of population size reductions.Proc Biol Sci. 2018 Mar 28;285(1875):20180007. doi: 10.1098/rspb.2018.0007. Proc Biol Sci. 2018. PMID: 29593112 Free PMC article.
-
Real-time microbial adaptive diversification in soil.Ecol Lett. 2013 May;16(5):650-5. doi: 10.1111/ele.12093. Epub 2013 Feb 26. Ecol Lett. 2013. PMID: 23438288
-
Adaptive radiation of Pseudomonas fluorescens SBW25 in experimental microcosms provides an understanding of the evolutionary ecology and molecular biology of A-L interface biofilm formation.FEMS Microbiol Lett. 2017 Jul 3;364(12). doi: 10.1093/femsle/fnx109. FEMS Microbiol Lett. 2017. PMID: 28535292 Review.
-
Interplay between ecological communities and evolution: review of feedbacks from microevolutionary to macroevolutionary scales.Ann N Y Acad Sci. 2008;1133:87-125. doi: 10.1196/annals.1438.003. Ann N Y Acad Sci. 2008. PMID: 18559817 Review.
Cited by
-
Mutualism at the leading edge: insights into the eco-evolutionary dynamics of host-symbiont communities during range expansion.J Math Biol. 2024 Feb 2;88(2):24. doi: 10.1007/s00285-023-02037-w. J Math Biol. 2024. PMID: 38308102
-
Rapid decline of adaptation of Pseudomonas fluorescens to soil biotic environment.Biol Lett. 2022 Mar;18(3):20210593. doi: 10.1098/rsbl.2021.0593. Epub 2022 Mar 9. Biol Lett. 2022. PMID: 35259940 Free PMC article.
-
Biodiversity-function relationships in methanogenic communities.Mol Ecol. 2018 Nov;27(22):4641-4651. doi: 10.1111/mec.14895. Epub 2018 Nov 22. Mol Ecol. 2018. PMID: 30307662 Free PMC article.
-
MetaCarvel: linking assembly graph motifs to biological variants.Genome Biol. 2019 Aug 26;20(1):174. doi: 10.1186/s13059-019-1791-3. Genome Biol. 2019. PMID: 31451112 Free PMC article.
-
Anthropogenic remediation of heavy metals selects against natural microbial remediation.Proc Biol Sci. 2019 Jun 26;286(1905):20190804. doi: 10.1098/rspb.2019.0804. Epub 2019 Jun 19. Proc Biol Sci. 2019. PMID: 31213187 Free PMC article.
References
-
- Norberg J., Urban M. C., Vellend M., Klausmeier C. A. & Loeuille N. Eco-evolutionary responses of biodiversity to climate change. Nat. Clim. Chang. 2, 747–751 (2012).
-
- Antonovics J. Plant population biology at the crossroads. Input from population genetics. Syst. Bot. 1, 234–245 (1976).
-
- Schoener T. W. The newest synthesis: understanding the interplay of evolutionary and ecological dynamics. Science 331, 426–429 (2011). - PubMed
-
- Hairston N. G., Ellner S. P., Geber M. A., Yoshida T. & Fox J. A. Rapid evolution and the convergence of ecological and evolutionary time. Ecol. Lett. 8, 1114–1127 (2005).
Publication types
MeSH terms
LinkOut - more resources
Full Text Sources
Other Literature Sources
