Imaging-genomics reveals driving pathways of MRI derived volumetric tumor phenotype features in Glioblastoma
- PMID: 27502180
- PMCID: PMC4977720
- DOI: 10.1186/s12885-016-2659-5
Imaging-genomics reveals driving pathways of MRI derived volumetric tumor phenotype features in Glioblastoma
Abstract
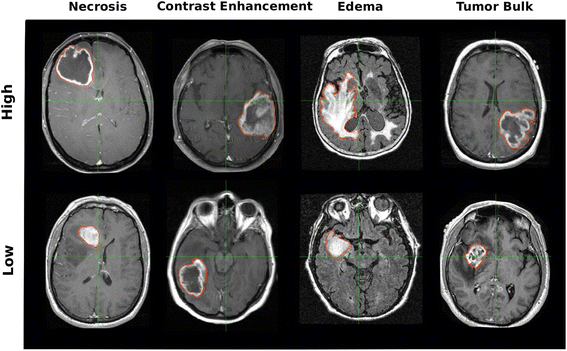
Background: Glioblastoma (GBM) tumors exhibit strong phenotypic differences that can be quantified using magnetic resonance imaging (MRI), but the underlying biological drivers of these imaging phenotypes remain largely unknown. An Imaging-Genomics analysis was performed to reveal the mechanistic associations between MRI derived quantitative volumetric tumor phenotype features and molecular pathways.
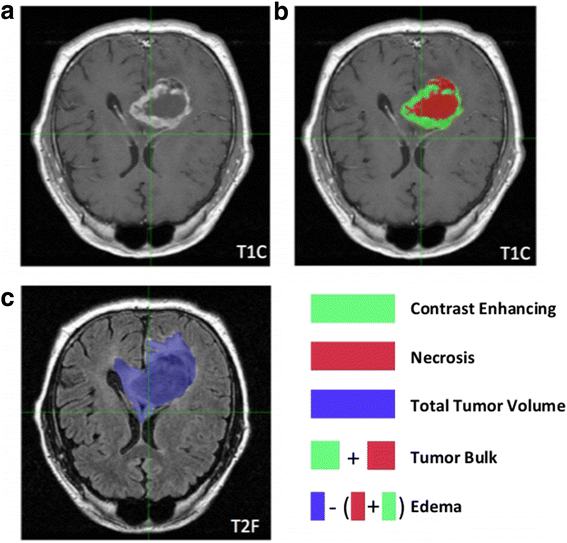
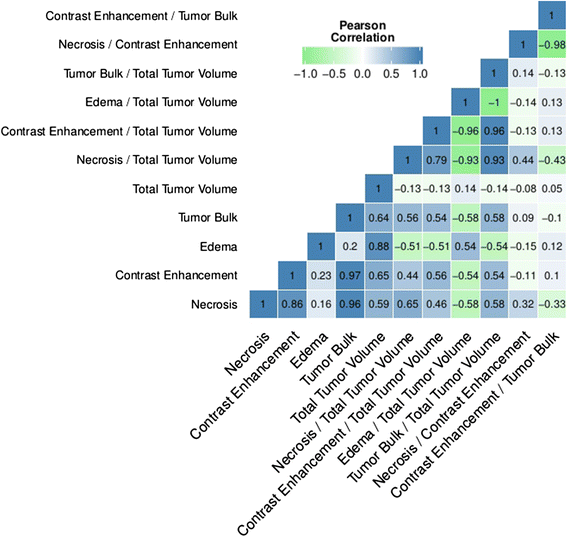
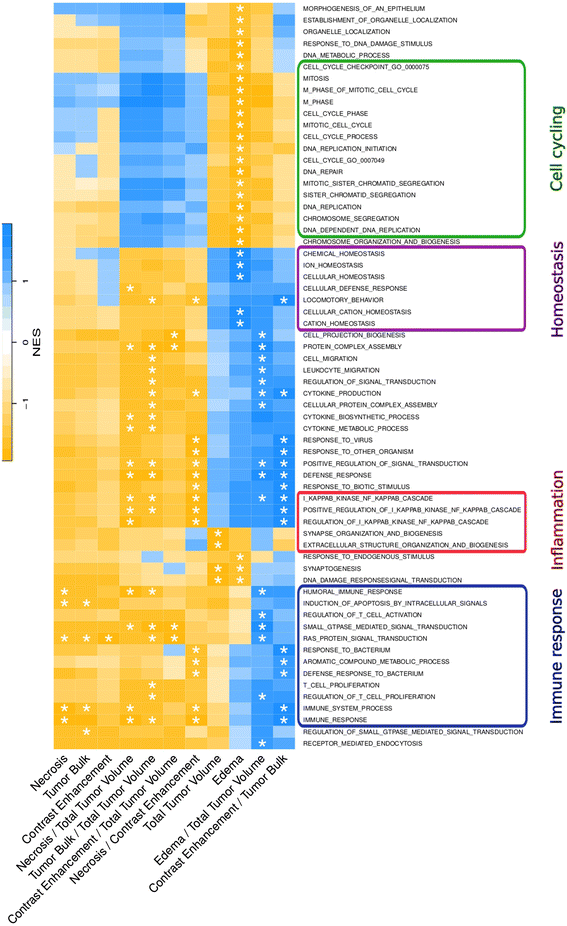
Methods: One hundred fourty one patients with presurgery MRI and survival data were included in our analysis. Volumetric features were defined, including the necrotic core (NE), contrast-enhancement (CE), abnormal tumor volume assessed by post-contrast T1w (tumor bulk or TB), tumor-associated edema based on T2-FLAIR (ED), and total tumor volume (TV), as well as ratios of these tumor components. Based on gene expression where available (n = 91), pathway associations were assessed using a preranked gene set enrichment analysis. These results were put into context of molecular subtypes in GBM and prognostication.
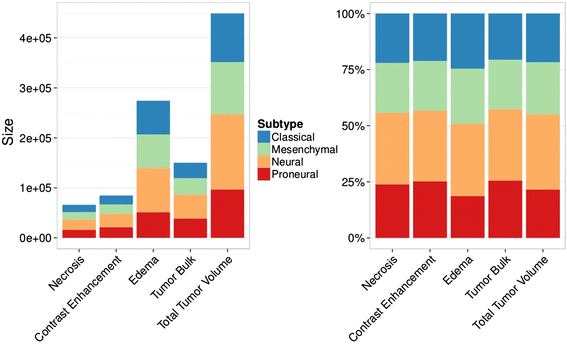
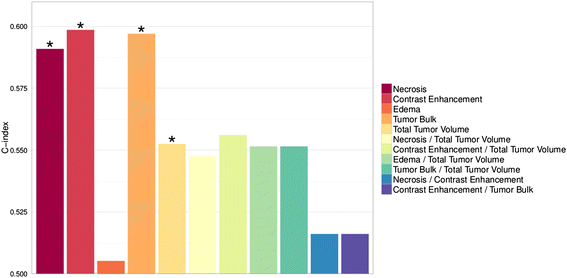
Results: Volumetric features were significantly associated with diverse sets of biological processes (FDR < 0.05). While NE and TB were enriched for immune response pathways and apoptosis, CE was associated with signal transduction and protein folding processes. ED was mainly enriched for homeostasis and cell cycling pathways. ED was also the strongest predictor of molecular GBM subtypes (AUC = 0.61). CE was the strongest predictor of overall survival (C-index = 0.6; Noether test, p = 4x10(-4)).
Conclusion: GBM volumetric features extracted from MRI are significantly enriched for information about the biological state of a tumor that impacts patient outcomes. Clinical decision-support systems could exploit this information to develop personalized treatment strategies on the basis of noninvasive imaging.
Keywords: Glioblastoma; Imaging-genomics; Neuro-imaging; Noninvasive; Pathways; Prediction; Radiation Oncology; Radiomics; Volumetric.
Figures
Similar articles
-
Somatic mutations associated with MRI-derived volumetric features in glioblastoma.Neuroradiology. 2015 Dec;57(12):1227-37. doi: 10.1007/s00234-015-1576-7. Epub 2015 Sep 4. Neuroradiology. 2015. PMID: 26337765 Free PMC article.
-
Radiogenomic-Based Survival Risk Stratification of Tumor Habitat on Gd-T1w MRI Is Associated with Biological Processes in Glioblastoma.Clin Cancer Res. 2020 Apr 15;26(8):1866-1876. doi: 10.1158/1078-0432.CCR-19-2556. Epub 2020 Feb 20. Clin Cancer Res. 2020. PMID: 32079590 Free PMC article.
-
Integrative analysis of diffusion-weighted MRI and genomic data to inform treatment of glioblastoma.J Neurooncol. 2016 Sep;129(2):289-300. doi: 10.1007/s11060-016-2174-1. Epub 2016 Jul 8. J Neurooncol. 2016. PMID: 27393347
-
Imaging genomics of Glioblastoma: state of the art bridge between genomics and neuroradiology.Neuroimaging Clin N Am. 2015 Feb;25(1):141-53. doi: 10.1016/j.nic.2014.09.010. Neuroimaging Clin N Am. 2015. PMID: 25476518 Review.
-
Imaging Genomics in Glioblastoma Multiforme: A Predictive Tool for Patients Prognosis, Survival, and Outcome.Magn Reson Imaging Clin N Am. 2016 Nov;24(4):731-740. doi: 10.1016/j.mric.2016.07.002. Magn Reson Imaging Clin N Am. 2016. PMID: 27742113 Review.
Cited by
-
Defining the biological basis of radiomic phenotypes in lung cancer.Elife. 2017 Jul 21;6:e23421. doi: 10.7554/eLife.23421. Elife. 2017. PMID: 28731408 Free PMC article.
-
A radiomics nomogram prediction for survival of patients with "driver gene-negative" lung adenocarcinomas (LUAD).Radiol Med. 2023 Jun;128(6):714-725. doi: 10.1007/s11547-023-01643-4. Epub 2023 May 23. Radiol Med. 2023. PMID: 37219740 Free PMC article.
-
Radiomic biomarkers of tumor immune biology and immunotherapy response.Clin Transl Radiat Oncol. 2021 Apr 7;28:97-115. doi: 10.1016/j.ctro.2021.03.006. eCollection 2021 May. Clin Transl Radiat Oncol. 2021. PMID: 33937530 Free PMC article. Review.
-
Evolution of Artificial Intelligence-Powered Technologies in Biomedical Research and Healthcare.Adv Biochem Eng Biotechnol. 2022;182:23-60. doi: 10.1007/10_2021_189. Adv Biochem Eng Biotechnol. 2022. PMID: 35262750 Review.
-
Radiomics: the bridge between medical imaging and personalized medicine.Nat Rev Clin Oncol. 2017 Dec;14(12):749-762. doi: 10.1038/nrclinonc.2017.141. Epub 2017 Oct 4. Nat Rev Clin Oncol. 2017. PMID: 28975929 Review.
References
-
- Zhu J-J, Wong ET. Personalized medicine for glioblastoma: current challenges and future opportunities. Curr Mol Med. 2013;13:358–367. - PubMed
-
- Hegi ME, Diserens A-C, Gorlia T, Hamou M-F, de Tribolet N, Weller M, Kros JM, Hainfellner JA, Mason W, Mariani L, Bromberg JEC, Hau P, Mirimanoff RO, Cairncross JG, Janzer RC, Stupp R. MGMT gene silencing and benefit from temozolomide in glioblastoma. N Engl J Med. 2005;352:997–1003. doi: 10.1056/NEJMoa043331. - DOI - PubMed
-
- Drabycz S, Roldán G, de Robles P, Adler D, McIntyre JB, Magliocco AM, Cairncross JG, Mitchell JR. An analysis of image texture, tumor location, and MGMT promoter methylation in glioblastoma using magnetic resonance imaging. Neuroimage. 2010;49:1398–1405. doi: 10.1016/j.neuroimage.2009.09.049. - DOI - PubMed
Publication types
MeSH terms
Grants and funding
LinkOut - more resources
Full Text Sources
Other Literature Sources
Medical

