

MR perfusion-weighted imaging in the evaluation of high-grade gliomas after treatment: a systematic review and meta-analysis
- PMID: 27502247
- PMCID: PMC5193025
- DOI: 10.1093/neuonc/now148
MR perfusion-weighted imaging in the evaluation of high-grade gliomas after treatment: a systematic review and meta-analysis
Abstract
Background: Distinction between tumor and treatment related changes is crucial for clinical management of patients with high-grade gliomas. Our purpose was to evaluate whether dynamic susceptibility contrast-enhanced (DSC) and dynamic contrast enhanced (DCE) perfusion-weighted imaging (PWI) metrics can effectively differentiate between recurrent tumor and posttreatment changes within the enhancing signal abnormality on conventional MRI.
Methods: A comprehensive literature search was performed for studies evaluating PWI-based differentiation of recurrent tumor and posttreatment changes in patients with high-grade gliomas (World Health Organization grades III and IV). Only studies published in the "temozolomide era" beginning in 2005 were included. Summary estimates of diagnostic accuracy were obtained by using a random-effects model.
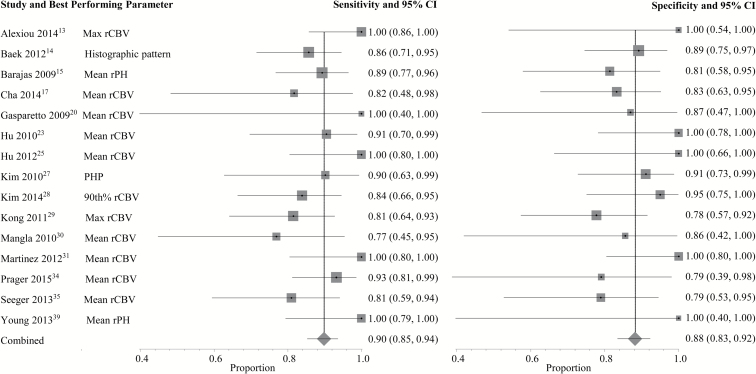
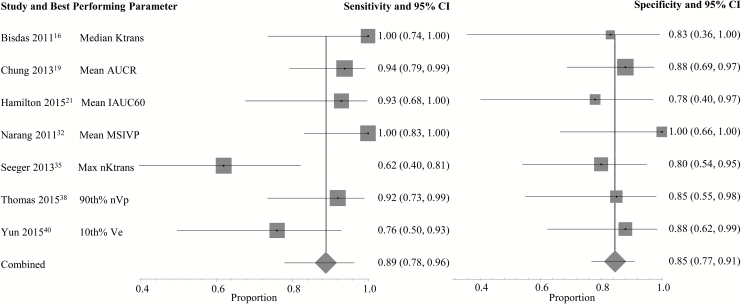
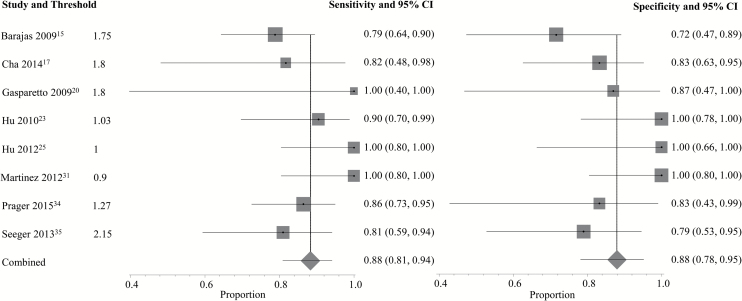
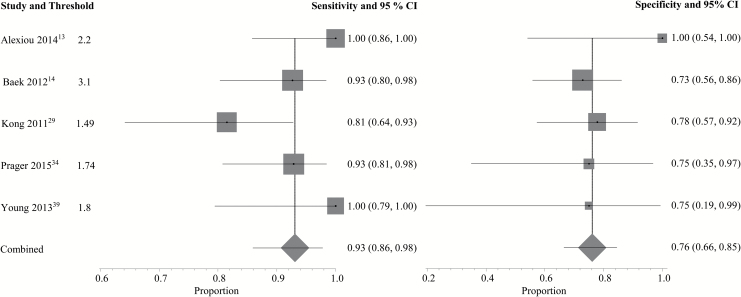
Results: Of 1581 abstracts screened, 28 articles were included. The pooled sensitivities and specificities of each study's best performing parameter were 90% and 88% (95% CI: 0.85-0.94; 0.83-0.92) and 89% and 85% (95% CI: 0.78-0.96; 0.77-0.91) for DSC and DCE, respectively. The pooled sensitivities and specificities for detecting tumor recurrence using the 2 most commonly evaluated parameters, mean relative cerebral blood volume (rCBV) (threshold range, 0.9-2.15) and maximum rCBV (threshold range, 1.49-3.1), were 88% and 88% (95% CI: 0.81-0.94; 0.78-0.95) and 93% and 76% (95% CI: 0.86-0.98; 0.66-0.85), respectively.
Conclusions: PWI-derived thresholds separating viable tumor from treatment changes demonstrate relatively good accuracy in individual studies. However, because of significant variability in optimal reported thresholds and other limitations in the existing body of literature, further investigation and standardization is needed before implementing any particular quantitative PWI strategy across institutions.
Keywords: MR perfusion; gliomas; meta-analysis; pseudoprogression; radiation necrosis.
© The Author(s) 2016. Published by Oxford University Press on behalf of the Society for Neuro-Oncology. All rights reserved. For permissions, please e-mail: journals.permissions@oup.com.
Figures
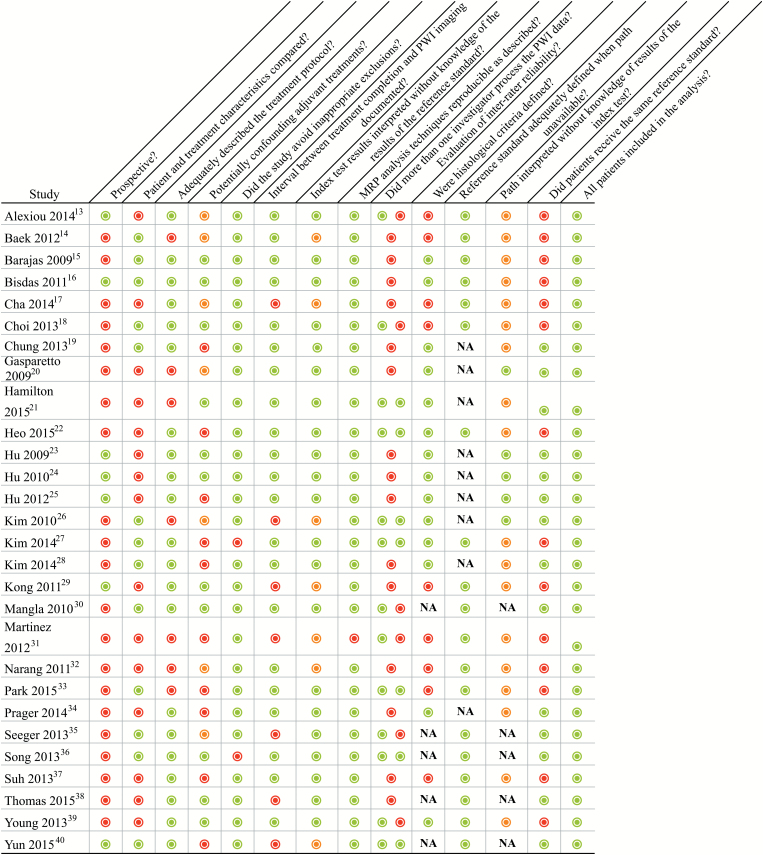
 = yes,
  = no,
= no,  = unclear, NA = not applicable; PWI = perfusion weighted imaging.
References
Publication types
MeSH terms
Substances
Grants and funding
LinkOut - more resources
Full Text Sources
Other Literature Sources
Medical
