. 2017 Jan;19(1):128-137.
doi: 10.1093/neuonc/now135. Epub 2016 Aug 8.

Radiogenomics to characterize regional genetic heterogeneity in glioblastoma

Affiliations

Radiogenomics to characterize regional genetic heterogeneity in glioblastoma

Leland S Hu et al. Neuro Oncol. 2017 Jan.

Abstract

Background: Glioblastoma (GBM) exhibits profound intratumoral genetic heterogeneity. Each tumor comprises multiple genetically distinct clonal populations with different therapeutic sensitivities. This has implications for targeted therapy and genetically informed paradigms. Contrast-enhanced (CE)-MRI and conventional sampling techniques have failed to resolve this heterogeneity, particularly for nonenhancing tumor populations. This study explores the feasibility of using multiparametric MRI and texture analysis to characterize regional genetic heterogeneity throughout MRI-enhancing and nonenhancing tumor segments.

Methods: We collected multiple image-guided biopsies from primary GBM patients throughout regions of enhancement (ENH) and nonenhancing parenchyma (so called brain-around-tumor, [BAT]). For each biopsy, we analyzed DNA copy number variants for core GBM driver genes reported by The Cancer Genome Atlas. We co-registered biopsy locations with MRI and texture maps to correlate regional genetic status with spatially matched imaging measurements. We also built multivariate predictive decision-tree models for each GBM driver gene and validated accuracies using leave-one-out-cross-validation (LOOCV).

Results: We collected 48 biopsies (13 tumors) and identified significant imaging correlations (univariate analysis) for 6 driver genes: EGFR, PDGFRA, PTEN, CDKN2A, RB1, and TP53. Predictive model accuracies (on LOOCV) varied by driver gene of interest. Highest accuracies were observed for PDGFRA (77.1%), EGFR (75%), CDKN2A (87.5%), and RB1 (87.5%), while lowest accuracy was observed in TP53 (37.5%). Models for 4 driver genes (EGFR, RB1, CDKN2A, and PTEN) showed higher accuracy in BAT samples (n = 16) compared with those from ENH segments (n = 32).

Conclusion: MRI and texture analysis can help characterize regional genetic heterogeneity, which offers potential diagnostic value under the paradigm of individualized oncology.

Keywords: genetic; glioblastoma; heterogeneity; radiogenomics; texture.


Figures

Fig 1.
Fig 1.
Copy number variant (CNV) profiles for 48 glioblastoma (GBM) tumor samples from 13 patients. Listed are the tissue samples by patient (eg, A,B,C … ) and sample number (eg, 1,2,3 … ). Samples are also demarcated by tumor segment of origin (ENH vs BAT). Red boxes denote amplification, dark blue boxes denote homozygous deletions, light blue boxes denote heterozygous deletions, and yellow boxes denote wild-type status (ie, diploid genome) for respective CNV gene aberrations (listed at the bottom of the x-axis).
Fig 2.
Fig 2.
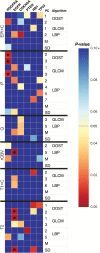
Heat map showing P values for significant imaging correlations with copy number variant (CNV) status. Univariate analysis compared CNV status (aberrant vs diploid/wild-type) with MRI-texture features. CNVs are listed as columns (top). Image features are listed as rows by MRI contrast (left axis) (eg, EPI + C, P, etc) and corresponding texture algorithm (right axis) (ie, DOST, GLCM, LBP). The principal components (PC) that demonstrated statistically significant or trending correlations are listed and labeled numerically (ie, 1,2,3 etc.). Mean (M) and standard deviation (SD) are also listed. Color map shows the P values by a 2-sample t test. Yellow-to-red colors indicate P values ≤.05, while blue signifies Pvalues >.05. DOST = discrete-orthonormal-Stockwell-transform; GLCM = gray-level-co-occurrence matrix; LBP = local-binary-product. Asterisks (*) denote correlations with false discovery rate (FDR) <5%.
Fig 3.
Fig 3.
Decision-tree model for PDGFRA copy number variant (CNV) status. (A) Tree model classification for PDGFRA amplification was developed through multivariate analysis of CNV status, multiparametric MRI, and texture analysis. The combination of P-DOST and EPI + C-DOST MRI-texture features classifies PDGFRA amplified (Amp) and wild-type (WT) specimens, with parentheses denoting (total # classified/# incorrectly classified) specimens at each branch point. Leave-one-out-cross-validation (LOOCV) confirmed 77.1% model accuracy. P = isotropic diffusion; EPI + C = T2*W signal loss; DOST = discrete orthonormal Stockwell transform; PC3, PC2 derived from principal component analysis (PCA). (B, C) Shown are the locations of 2 stereotactic biopsies (Bx#1,Bx#2) on CE-MRI. DNA CNVs demonstrated amplification (Amp,Bx#1) and diploid/wild-type status (WT,Bx#2). (C) Color map overlay shows regions (ROIs) of predicted PDGFRA amplification (red voxels) using tree model classification. AUC, area under curve.

References

    1. Brennan CW, Verhaak RG, McKenna A et al. . The somatic genomic landscape of glioblastoma. Cell. 2013;155 (2):462–477. - PMC - PubMed
    1. Bonavia R, Inda MM, Cavenee WK, Furnari FB. Heterogeneity maintenance in glioblastoma: a social network. Cancer Res. 2011;71 (12):4055–4060. - PMC - PubMed
    1. Ene CI, Fine HA. Many tumors in one: a daunting therapeutic prospect. Cancer Cell. 2011;20 (6):695–697. - PubMed
    1. Marusyk A, Almendro V, Polyak K. Intra-tumour heterogeneity: a looking glass for cancer? Nat Rev Cancer. 2012;12 (5):323–334. - PubMed
    1. Barajas RF Jr, Hodgson JG, Chang JS et al. . Glioblastoma multiforme regional genetic and cellular expression patterns: influence on anatomic and physiologic MR imaging. Radiology. 2010;254 (2):564–576. - PMC - PubMed

Publication types

Substances