. 2016 Sep 19;371(1703):20150319.
doi: 10.1098/rstb.2015.0319.

The underestimated biodiversity of tropical grassy biomes

Affiliations

The underestimated biodiversity of tropical grassy biomes

Brett P Murphy et al. Philos Trans R Soc Lond B Biol Sci. .

Abstract

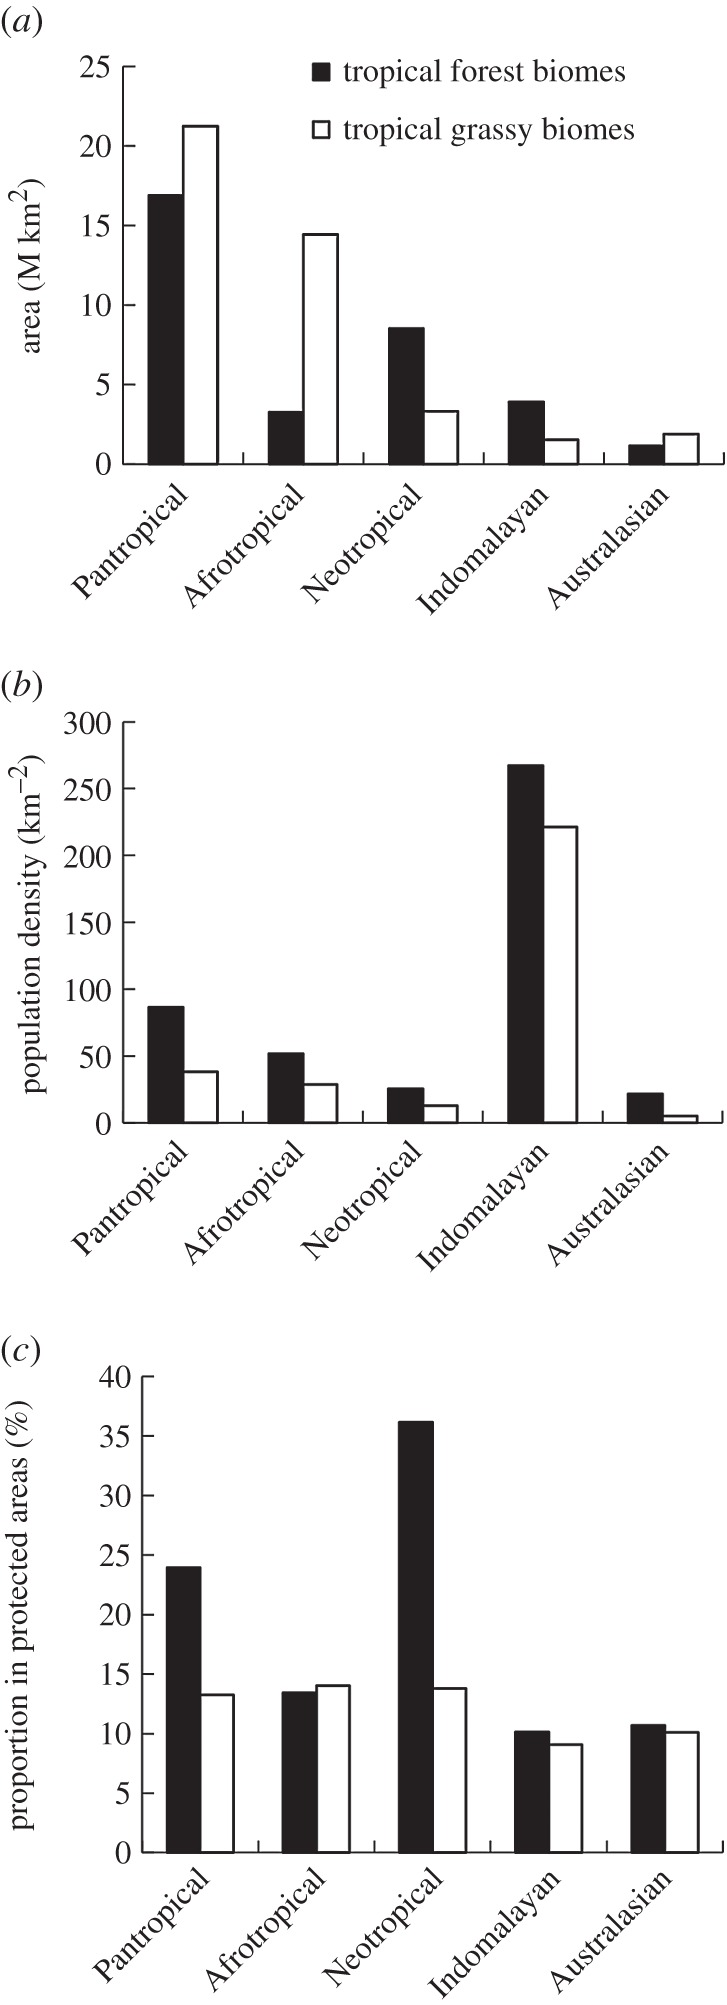
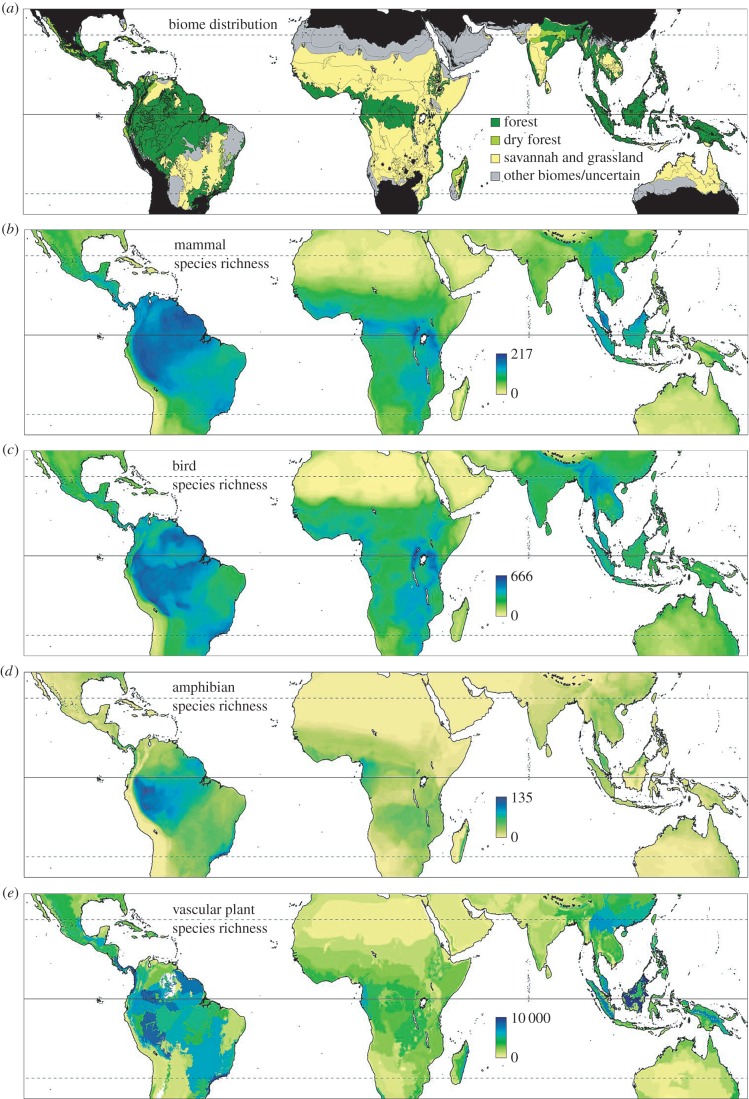
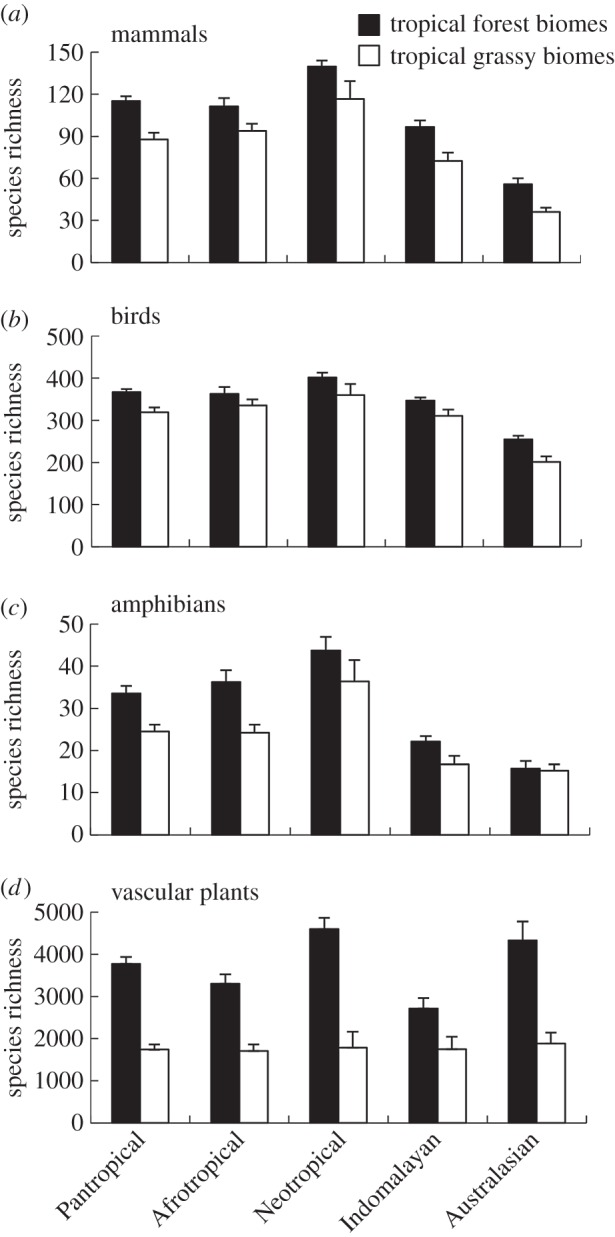
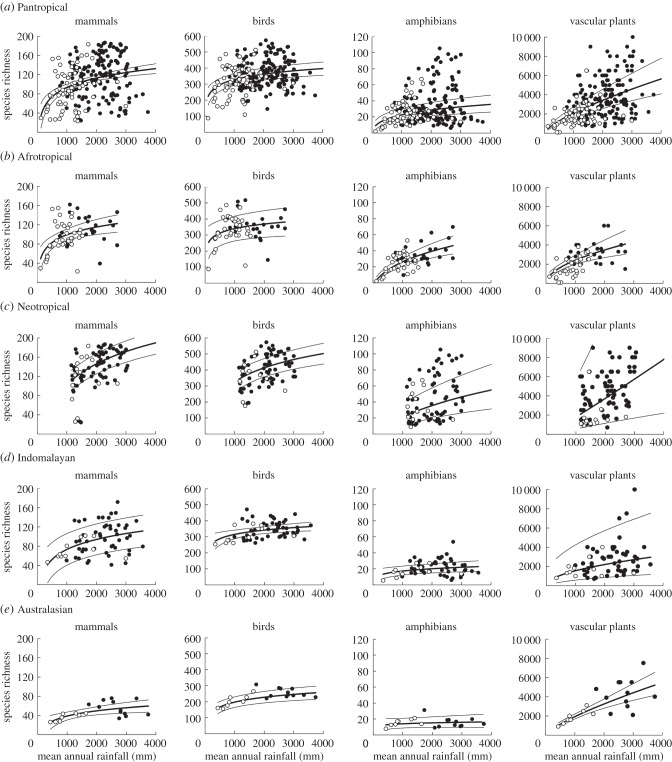
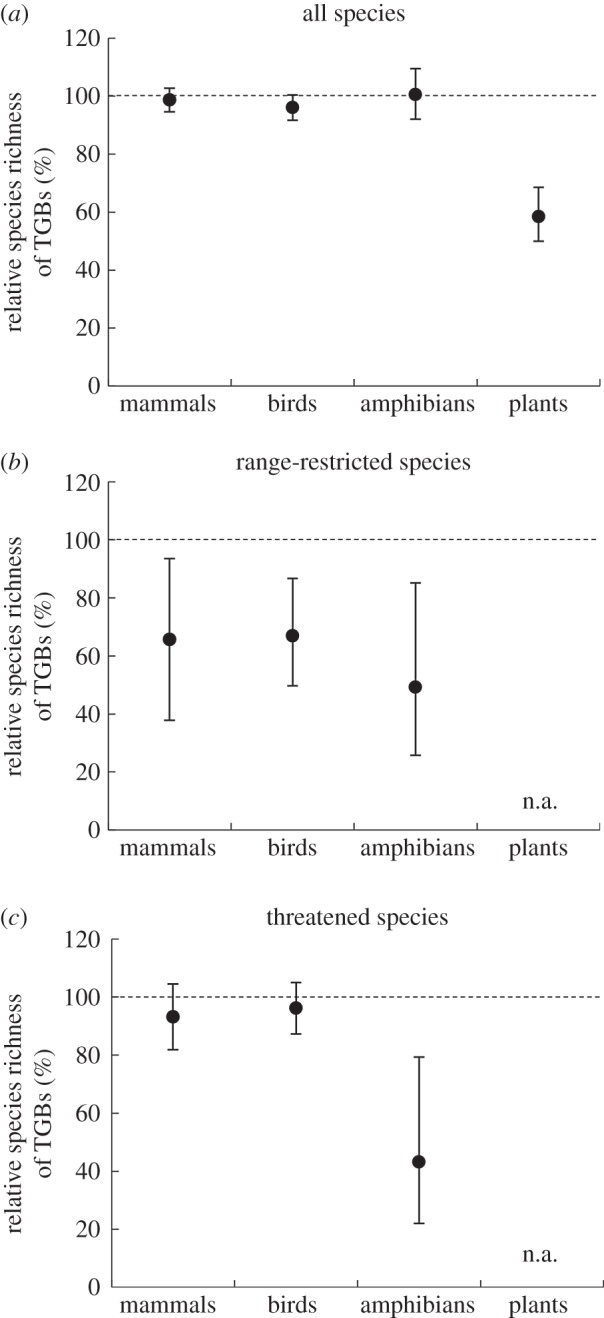
For decades, there has been enormous scientific interest in tropical savannahs and grasslands, fuelled by the recognition that they are a dynamic and potentially unstable biome, requiring periodic disturbance for their maintenance. However, that scientific interest has not translated into widespread appreciation of, and concern about threats to, their biodiversity. In terms of biodiversity, grassy biomes are considered poor cousins of the other dominant biome of the tropics-forests. Simple notions of grassy biomes being species-poor cannot be supported; for some key taxa, such as vascular plants, this may be valid, but for others it is not. Here, we use an analysis of existing data to demonstrate that high-rainfall tropical grassy biomes (TGBs) have vertebrate species richness comparable with that of forests, despite having lower plant diversity. The Neotropics stand out in terms of both overall vertebrate species richness and number of range-restricted vertebrate species in TGBs. Given high rates of land-cover conversion in Neotropical grassy biomes, they should be a high priority for conservation and greater inclusion in protected areas. Fire needs to be actively maintained in these systems, and in many cases re-introduced after decades of inappropriate fire exclusion. The relative intactness of TGBs in Africa and Australia make them the least vulnerable to biodiversity loss in the immediate future. We argue that, like forests, TGBs should be recognized as a critical-but increasingly threatened-store of global biodiversity.This article is part of the themed issue 'Tropical grassy biomes: linking ecology, human use and conservation'.

Keywords: biodiversity conservation; diversity; grassland; rainforest; tropical forest; tropical savannah.


Figures

Figure 1.
Figure 1.
The (a) land area, (b) population density and (c) proportional inclusion in protected areas, of tropical forest and grassy biomes. These are shown separately for the entire tropics (Pantropical), and the four biogeographic realms [1] which dominate the tropics. Population density is based on [2]; protected areas are from [3]. Because of their limited area at a pantropical scale, the Nearctic and Oceanian realms were omitted. The realms are shown in decreasing order of total area in the tropics. In (a), mean population density for each ecoregion was derived from [2]. In (c), protected area data were obtained from the World Database on Protected Areas [4], following the methods of [5]. Protected area estimates include all IUCN Protected Area Management Categories (I–VI) as well as areas not designated with an IUCN category.
Figure 2.
Figure 2.
(a) The broad distribution of forest, dry forest and grassy biomes in tropical climate zones, defined here as having minimum monthly temperature greater than or equal to 15°C. Areas outside the tropical climate zones are shaded black. The biome map is generally based on the ‘ecoregions’ of Olson et al. [41]—with each ecoregion allocated a dominant biome (see the electronic supplementary material, appendix S1). Boundaries between ecoregions are indicated by fine black lines. Variation in the species richness of mammals, birds, amphibians and vascular plants throughout the land areas of the tropics are shown in panels (be). The vertebrate species richness data relate to total mean species richness for 10 × 10 km cells, and are from Jenkins et al. [5]. The plant data relate to species richness of each ecoregion, and are from Kier et al. [35]. In (e), there are two white patches in South America, where plant richness data were not available. The solid black line indicates the Equator and the dashed lines indicate the Tropic of Cancer and Tropic of Capricorn.
Figure 3.
Figure 3.
Comparison of species richness between tropical forest and TGBs in each biogeographic realm, for key vertebrate groups: (a) mammals, (b) birds and (c) amphibians, as well as (d) vascular plants. The means are calculated from the values for each tropical ecoregion. The error bars indicate standard error of the mean (of ecoregions).
Figure 4.
Figure 4.
The relationship between mean species richness and mean annual rainfall, for key vertebrate groups (mammals, birds and amphibians) as well as vascular plants, shown for (a) the whole tropics (pantropical), and (be) separately for each tropical biogeographic realm. Each data point represents either the mean of 10 × 10 km cells (for vertebrates) or the total (for plants) species richness for an ecoregion. The open circles indicate TGBs, and the filled circles indicate forest biomes.
Figure 5.
Figure 5.
(ac) Relative species richness of TGBs (expressed as a proportion of species richness of tropical forests), for key vertebrate groups (mammals, birds and amphibians) and vascular plants, accounting for differences in rainfall and latitude. The model predictions assume a mean annual rainfall of 1640 mm and latitude of 10.5° (the median of the tropical ecoregions in our dataset), using the global models from our analysis (vertebrate species richness ∼ realm × [log(rainfall) + latitude] + TGB; plant species richness ∼ log(area) × realm × [log(rainfall) + latitude] + TGB). The error bars indicate 95% confidence intervals of the predictions.

References

    1. Udvardy M. 1975. A classification of the biogeographical provinces of the world. Morges, Switzerland: International Union for Conservation of Nature.
    1. Center for International Earth Science Information Network - CIESIN - Columbia University, a.C.I.d.A.T.-C. 2005. Gridded Population of the World, Version 3 (GPWv3): Population Density Grid. Palisades, NY: NASA Socioeconomic Data and Applications Center.
    1. World Conservation Union and UNEP World Conservation Monitoring Centre. 2016. World database on protected areas. Cambridge, UK: UNEP World Conservation Monitoring Centre.
    1. IUCN and UNEP-WCMC. 2016. The world database on protected areas (WDPA). Cambridge, UK: UNEP World Conservation Monitoring Centre.
    1. Jenkins CN, Pimm SL, Joppa LN. 2013. Global patterns of terrestrial vertebrate diversity and conservation. Proc. Natl Acad. Sci. USA 110, E2602–E2610. ( 10.1073/pnas.1302251110) - DOI - PMC - PubMed

Publication types

LinkOut - more resources