. 2016 Aug 8;17(1):55.
doi: 10.1186/s12868-016-0287-2.

Olfactory perception of chemically diverse molecules

Affiliations

Olfactory perception of chemically diverse molecules

Andreas Keller et al. BMC Neurosci. .

Abstract

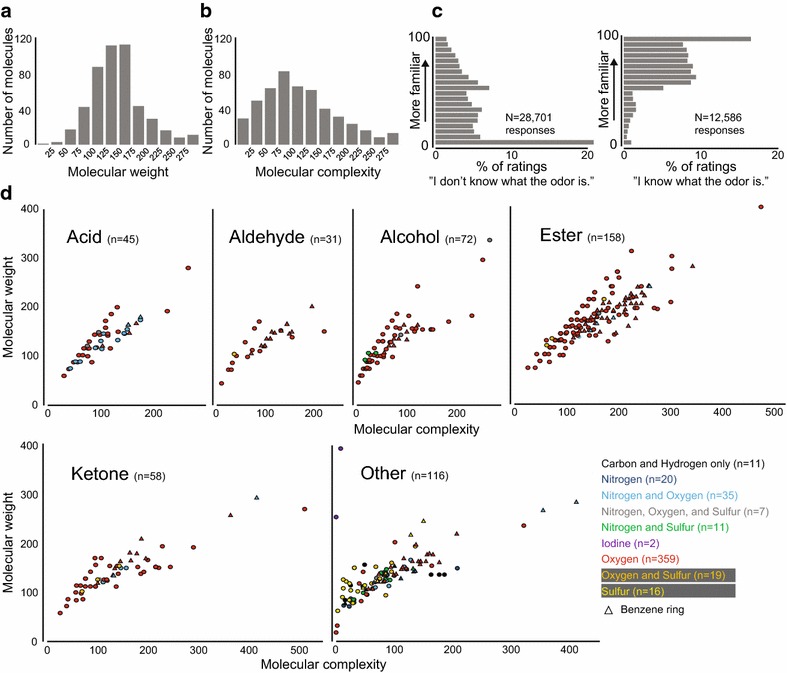
Background: Understanding the relationship between a stimulus and how it is perceived reveals fundamental principles about the mechanisms of sensory perception. While this stimulus-percept problem is mostly understood for color vision and tone perception, it is not currently possible to predict how a given molecule smells. While there has been some progress in predicting the pleasantness and intensity of an odorant, perceptual data for a larger number of diverse molecules are needed to improve current predictions. Towards this goal, we tested the olfactory perception of 480 structurally and perceptually diverse molecules at two concentrations using a panel of 55 healthy human subjects.

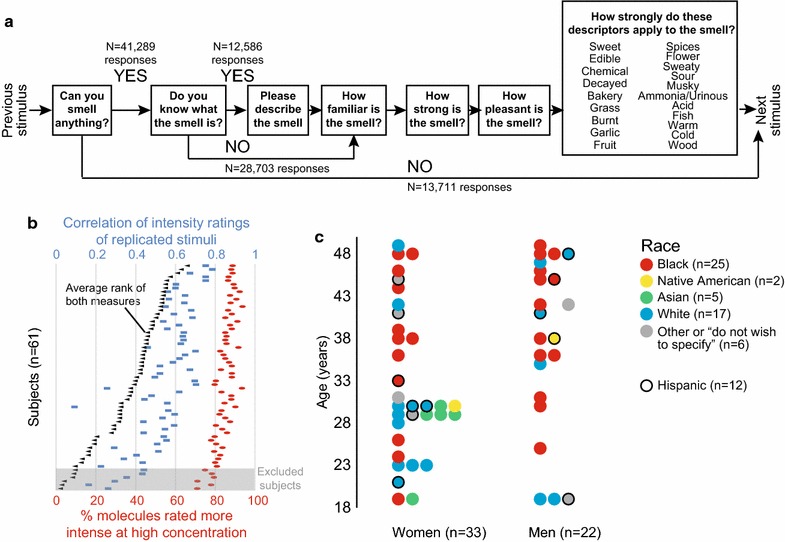
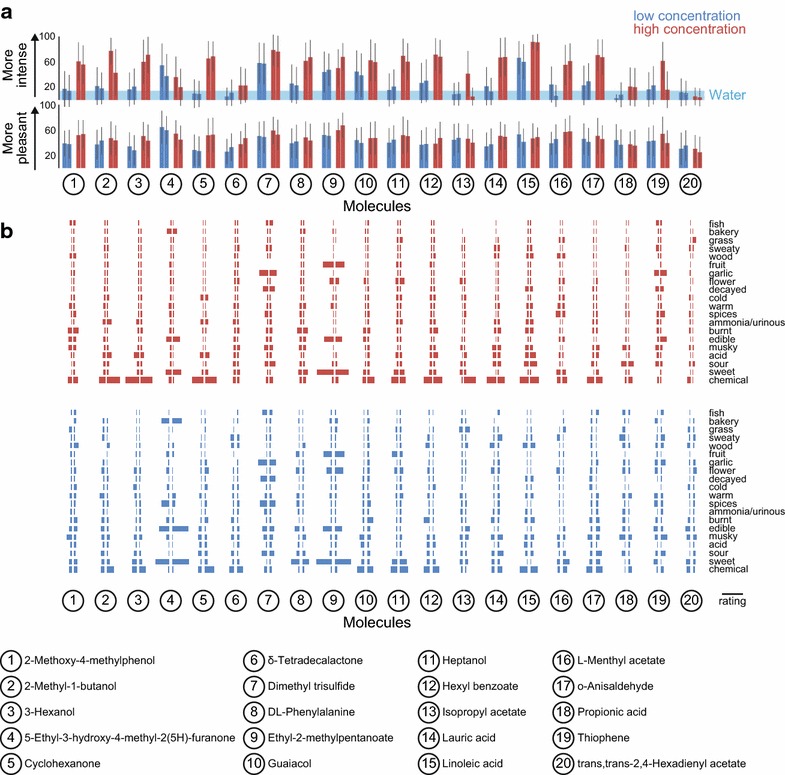
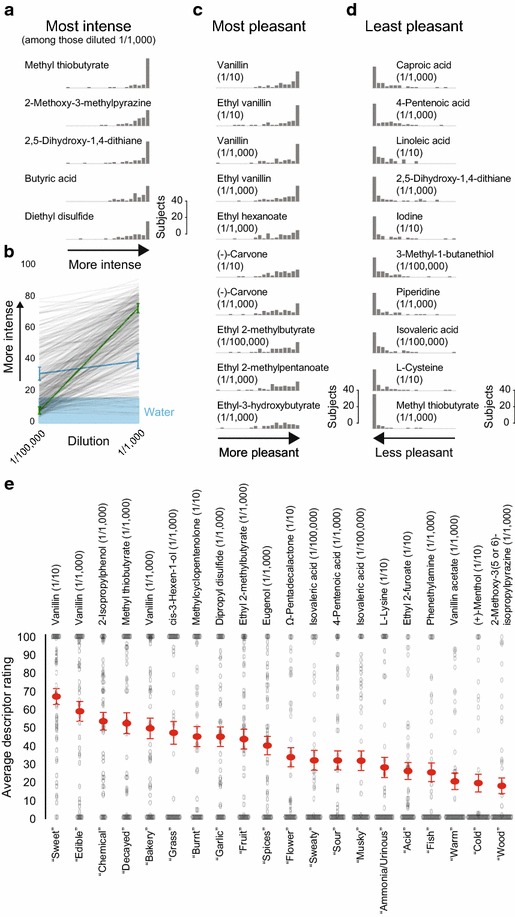
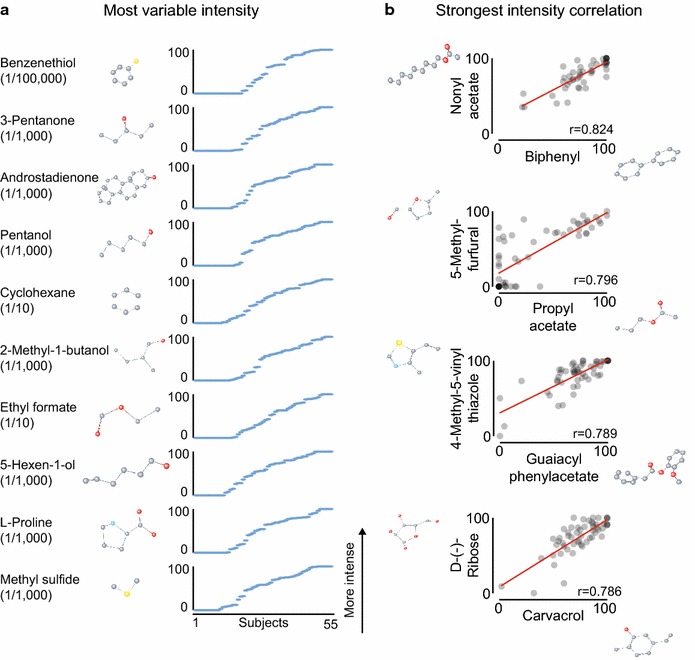
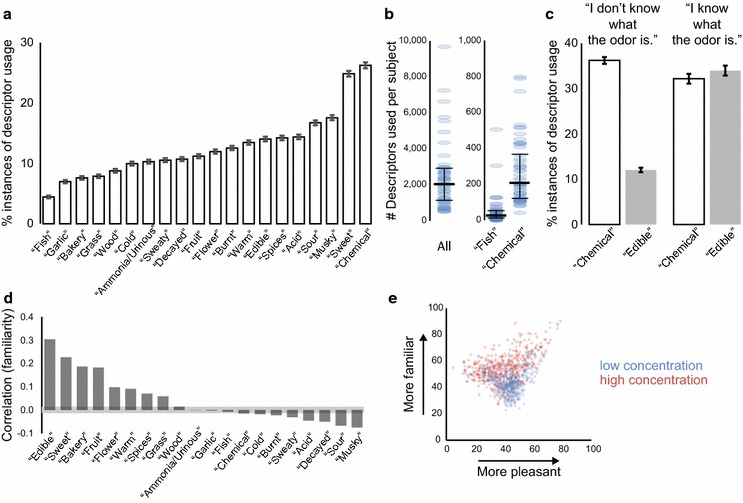
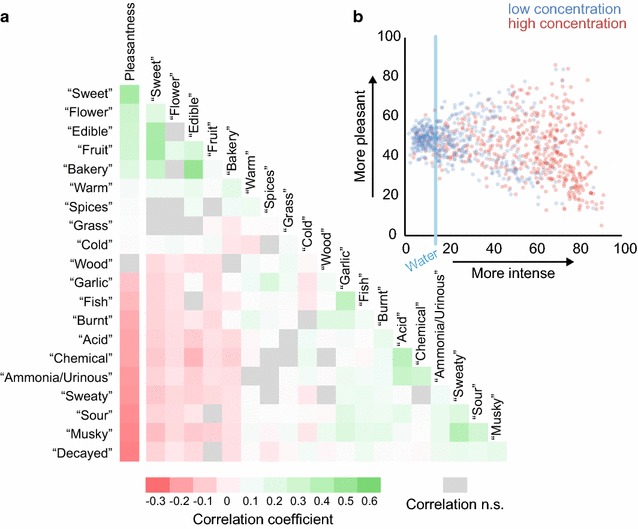
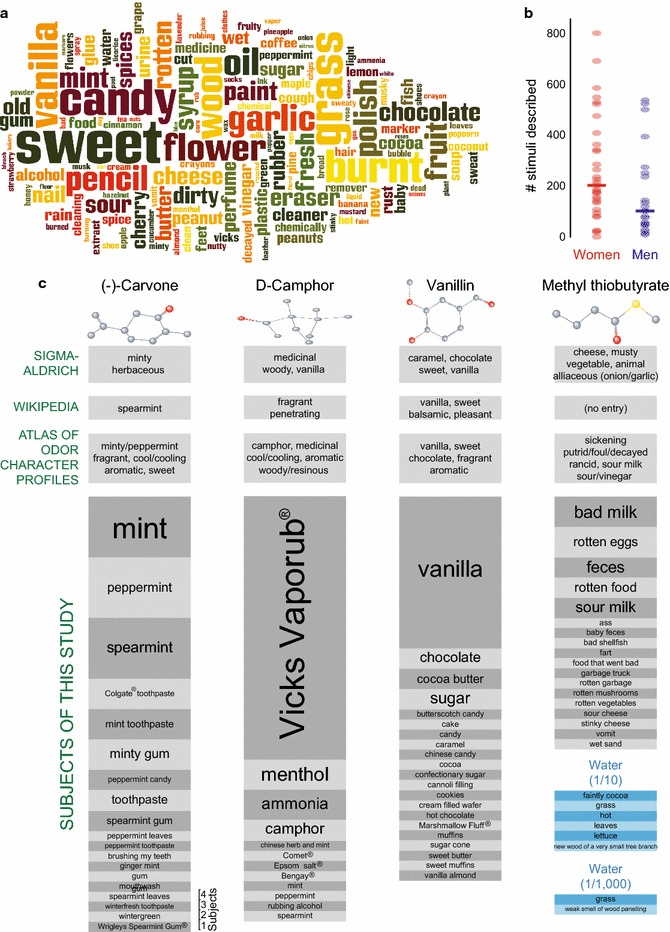
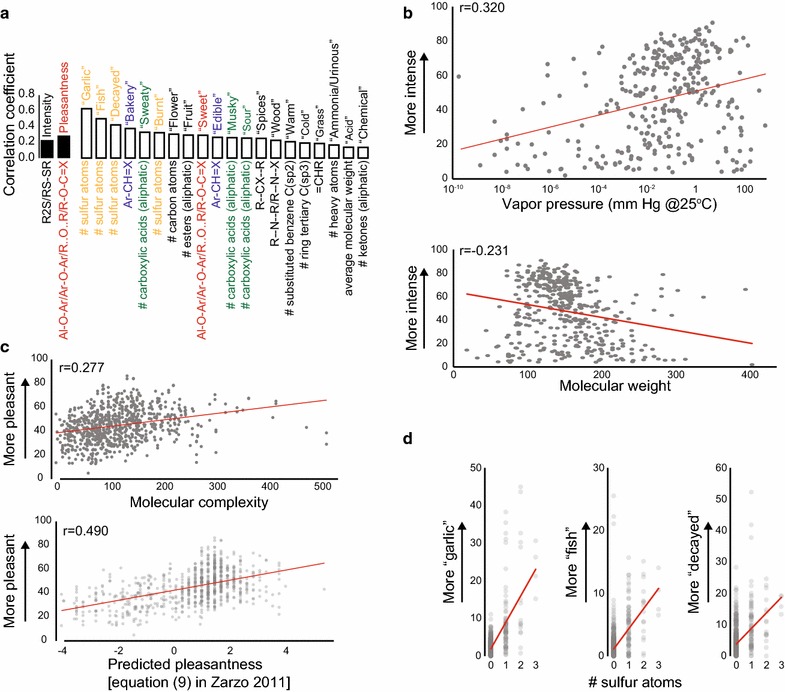
Results: For each stimulus, we collected data on perceived intensity, pleasantness, and familiarity. In addition, subjects were asked to apply 20 semantic odor quality descriptors to these stimuli, and were offered the option to describe the smell in their own words. Using this dataset, we replicated several previous correlations between molecular features of the stimulus and olfactory perception. The number of sulfur atoms in a molecule was correlated with the odor quality descriptors "garlic," "fish," and "decayed," and large and structurally complex molecules were perceived to be more pleasant. We discovered a number of correlations in intensity perception between molecules. We show that familiarity had a strong effect on the ability of subjects to describe a smell. Many subjects used commercial products to describe familiar odorants, highlighting the role of prior experience in verbal reports of olfactory perception. Nonspecific descriptors like "chemical" were applied frequently to unfamiliar odorants, and unfamiliar odorants were generally rated as neither pleasant nor unpleasant.

Conclusions: We present a very large psychophysical dataset and use this to correlate molecular features of a stimulus to olfactory percept. Our work reveals robust correlations between molecular features and perceptual qualities, and highlights the dominant role of familiarity and experience in assigning verbal descriptors to odorants.

Keywords: Cheminformatics; Odor descriptors; Olfaction; Perceptual familiarity; Perceptual variability; Psychophysics; Structure-odor-relationship.


Figures

Fig. 1
Fig. 1
Molecules. a, b Molecular weight (a) and molecular complexity (b) of the molecules used in this study. c Histograms of familiarity ratings (0–100, binned in 20 units of 5) for stimuli that subjects identified as unknown (left) or known (right). N denotes the total number of responses across all stimuli and all subjects. d Molecular weight and molecular complexity parsed by chemical functionality
Fig. 2
Fig. 2
Subjects. a Sequence of prompts for each stimulus. N denotes the total number of responses across all stimuli and all subjects. b General olfactory performance of the 61 subjects who completed the study. Six subjects with the lowest rank in replicability of intensity ratings were excluded from further analysis. c Age, gender, and self-reported race and ethnicity of the 55 evaluated subjects
Fig. 3
Fig. 3
Repeated stimuli a Ratings for intensity (top) and pleasantness (bottom) for the 40 stimuli (20 molecules at two concentrations) each presented twice (mean ± S.D.). The intensity rating of water (14.44) is indicated by the blue shading. b Ratings of descriptors for high (top) and low (bottom) concentrations of 20 molecules each presented twice. Average ratings of descriptors for first (left-facing bar plot) and second (right-facing bar plot) presentations. Scale bar: rating of 50 on a scale of 0 to 100
Fig. 4
Fig. 4
Perception of stimuli. a Histograms of intensity ratings for the five most intense of 437 stimuli presented at 1/1000 dilution (most intense on top). b Average intensity ratings of 437 molecules presented at 1/1000 and 1/100,000 dilutions, with standard error of the mean shown for two molecules [methyl salicylate (green) and methyl caprylate (blue)]. The intensity rating of water (14.44) is indicated by the blue shading. c, d The ten most pleasant (most pleasant on top) (c) and ten least pleasant of the 1000 stimuli (least pleasant on bottom) (d). e Descriptor rating of the stimuli most representative of each of the 20 descriptors. Individual ratings as well averages and standard errors (in red) are shown. Only the 778 stimuli perceived to be more intense than water (14.44) were included in this analysis. In a, c, d Histograms of subject ratings of intensity a or pleasantness c, d are plotted on a scale from 0–100, binned in 20 units of 5
Fig. 5
Fig. 5
Variability in perception. a The ten stimuli with the most variability in intensity (most variable on top). b The four pairs of all stimuli with the largest correlation between intensity ratings (for each correlation: p < 1E−11). Only the 778 stimuli perceived on average to be more intense than water (14.44) were included in this analysis. In the chemical structures, atoms are colored as follows: carbon (gray), oxygen (red), nitrogen (blue), sulfur (yellow)
Fig. 6
Fig. 6
Descriptor usage and familiarity. a Descriptor usage for all subjects (with 99 % confidence interval indicated). 100 % would correspond to a descriptor assigned to all stimuli by all subjects. b Descriptor usage per subject. Left all descriptors (maximum possible value: 20,000). Right “chemical” and “fish” descriptors (maximum possible value: 1000). Data from 55 individual subjects (blue) and median and first and third quartiles (black). c Descriptor usage for “chemical” and “edible” for all stimuli (99 % confidence interval indicated), with responses divided according to unknown (left: N = 28,703 responses) and known (right: N = 12,586 responses) stimuli. 100 % would correspond to a descriptor assigned to all stimuli by all subjects. d Correlation between familiarity ratings and the ratings of 20 descriptors. The grey area along the x-axis indicates the range of correlations that are not statistically significant (after Bonferroni correction; N = 41,289, p > 0.0025). e Average familiarity and pleasantness ratings for 1000 stimuli
Fig. 7
Fig. 7
Correlations between odor quality descriptors. a Heat map of correlation between pleasantness ratings and the ratings of 20 descriptors. Correlations that are not statistically significant (after Bonferroni correction; N = 41,289, p > 0.000238) are indicated in grey. b Average intensity and pleasantness ratings for 1000 stimuli
Fig. 8
Fig. 8
Subjects’ own words. a A word cloud in which font size represents the frequency with which words describing odor quality were used. b The number of stimuli that each of the 55 subjects described in their own words. Individual data are shown as dots, median as line. c Semantic odor descriptors for (−)-carvone (1/10), D-camphor (1/10), vanillin (1/10), and methyl thiobutyrate (1/1000). Published descriptors from Sigma-Aldrich Flavor and Fragrance Catalogue, Wikipedia, and the five descriptors with the highest applicability from the Dravnieks odor atlas [21] (top) and self-generated descriptors provided by subjects for the same 4 odor stimuli as well as water “diluted” 1/10 or 1/1000 (bottom). In the chemical structures, atoms are colored as follows: carbon (gray), oxygen (red), sulfur (yellow)
Fig. 9
Fig. 9
Predicting perception. a The strongest positive correlations between a molecular feature and intensity, pleasantness, and descriptor ratings. All correlations shown are statistically significant (after Bonferroni correction; p < 0.000235). b Perceived intensity and vapor pressure (top; limited to the 319 molecules with available vapor pressure information) and perceived intensity and molecular weight (bottom) (p < 1E − 05). c Pleasantness and molecular complexity (top), and pleasantness and molecular features computed using Eq. (9) in [4]. Eq. (9) equates perceived pleasantness with −2.62 + 0.23* number of atoms (excluding H) + 1.58* presence of oxygen −1.96* presence of sulfur −2.58* presence of an acid group −1.89* presence of an amine group (bottom) (p < 1E−14). d The number of sulfur atoms and ratings for “garlic” (left), “fish” (middle), and “decayed” (right). In all panels, only stimuli diluted at 1/1000 are included in analysis of intensity so that only stimuli diluted to the same level are compared; and only the 778 stimuli perceived to be more intense than water (14.44) were included in the analysis of pleasantness and odor descriptors

Similar articles

Cited by

References

    1. Boelens H. Structure activity relationships in chemoreception by human olfaction. Trends Pharmacol Sci. 1983;4(10):421–426. doi: 10.1016/0165-6147(83)90475-3. - DOI
    1. Edwards PA, Jurs PC. Correlation of odor intensities with structural properties of odorants. Chem Senses. 1989;14(2):281–291. doi: 10.1093/chemse/14.2.281. - DOI
    1. Mainland JD, Lundström JN, Reisert J, Lowe G. From molecule to mind: an integrative perspective on odor intensity. Trends Neurosci. 2014;37(8):443–454. doi: 10.1016/j.tins.2014.05.005. - DOI - PMC - PubMed
    1. Zarzo M. Hedonic judgments of chemical compounds are correlated with molecular size. Sensors. 2011;11(4):3667–3686. doi: 10.3390/s110403667. - DOI - PMC - PubMed
    1. Kermen F, Chakirian A, Sezille C, Joussain P, Le Goff G, Ziessel A, Chastrette M, Mandairon N, Didier A, Rouby C, et al. Molecular complexity determines the number of olfactory notes and the pleasantness of smells. Sci Reports. 2011;1:206. - PMC - PubMed