

The relative contributions of store-operated and voltage-gated Ca2+ channels to the control of Ca2+ oscillations in airway smooth muscle
- PMID: 27502470
- PMCID: PMC5430232
- DOI: 10.1113/JP272996
The relative contributions of store-operated and voltage-gated Ca2+ channels to the control of Ca2+ oscillations in airway smooth muscle
Abstract
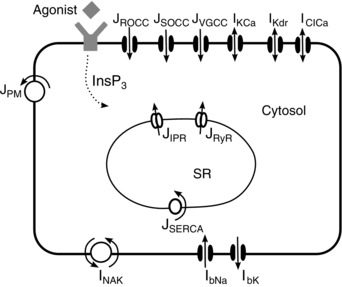
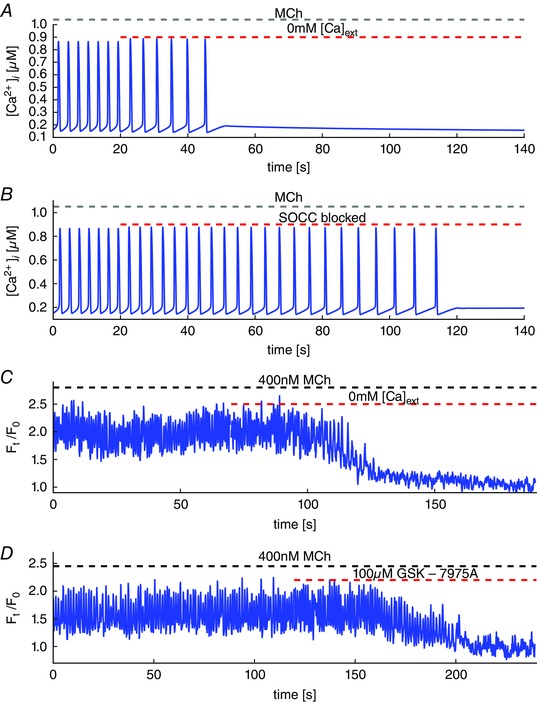
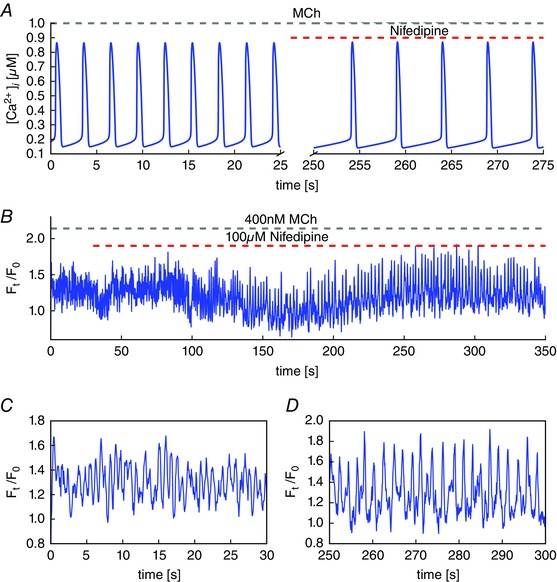
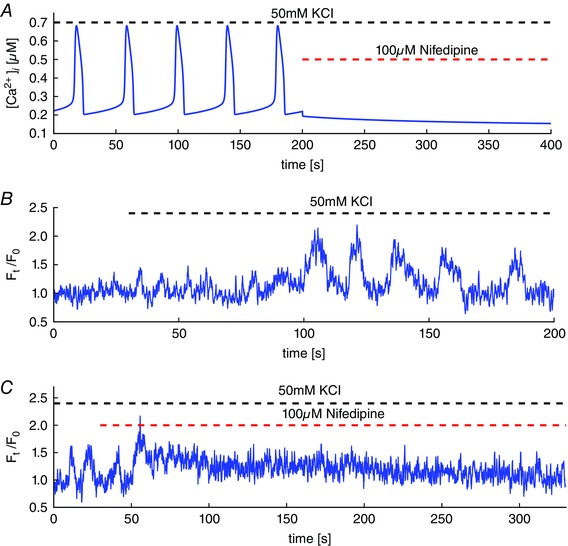
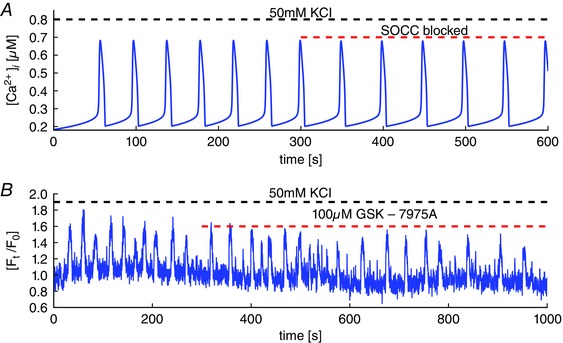
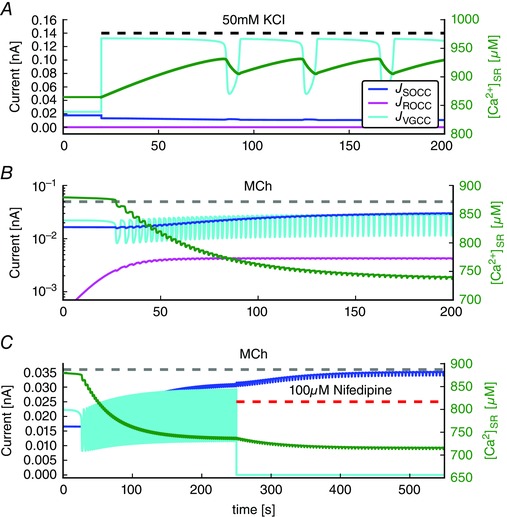
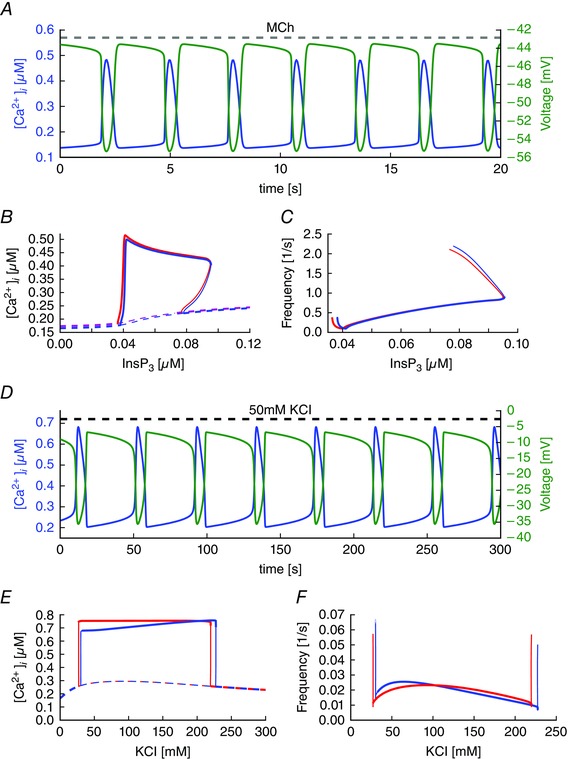
Key points: Agonist-dependent oscillations in the concentration of free cytosolic calcium are a vital mechanism for the control of airway smooth muscle contraction and thus are a critical factor in airway hyper-responsiveness. Using a mathematical model, closely tied to experimental work, we show that the oscillations in membrane potential accompanying the calcium oscillations have no significant effect on the properties of the calcium oscillations. In addition, the model shows that calcium entry through store-operated calcium channels is critical for calcium oscillations, but calcium entry through voltage-gated channels has much less effect. The model predicts that voltage-gated channels are less important than store-operated channels in the control of airway smooth muscle tone.
Abstract: Airway smooth muscle contraction is typically the key mechanism underlying airway hyper-responsiveness, and the strength of muscle contraction is determined by the frequency of oscillations of intracellular calcium (Ca2+ ) concentration. In airway smooth muscle cells, these Ca2+ oscillations are caused by cyclic Ca2+ release from the sarcoplasmic reticulum, although Ca2+ influx via plasma membrane channels is also necessary to sustain the oscillations over longer times. To assess the relative contributions of store-operated and voltage-gated Ca2+ channels to this Ca2+ influx, we generated a comprehensive mathematical model, based on experimental Ca2+ measurements in mouse precision-cut lung slices, to simulate Ca2+ oscillations and changes in membrane potential. Agonist-induced Ca2+ oscillations are accompanied by oscillations in membrane potential, although the membrane potential oscillations are too small to generate large Ca2+ currents through voltage-gated Ca2+ channels, and thus have little effect on the Ca2+ oscillations. Ca2+ entry through voltage-gated channels only becomes important when the cell is depolarized (e.g. by a high external K+ concentration). As a result, agonist-induced Ca2+ oscillations are critically dependent on Ca2+ entry through store-operated channels but do not depend strongly on Ca2+ entry though voltage-gated channels.
Keywords: airways; calcium dynamics; calcium influx; calcium signalling.
© 2016 The Authors. The Journal of Physiology © 2016 The Physiological Society.
Figures
Comment in
-
The effects of Ca2+ buffers on cytosolic Ca2+ signalling.J Physiol. 2017 May 15;595(10):3107-3108. doi: 10.1113/JP273852. Epub 2017 Feb 1. J Physiol. 2017. PMID: 28058721 Free PMC article. No abstract available.
Similar articles
-
Store-operated calcium entry is required for sustained contraction and Ca2+ oscillations of airway smooth muscle.J Physiol. 2017 May 15;595(10):3203-3218. doi: 10.1113/JP272694. Epub 2016 Aug 2. J Physiol. 2017. PMID: 27396568 Free PMC article.
-
Intricate interaction between store-operated calcium entry and calcium-activated chloride channels in pulmonary artery smooth muscle cells.Adv Exp Med Biol. 2010;661:31-55. doi: 10.1007/978-1-60761-500-2_3. Adv Exp Med Biol. 2010. PMID: 20204722
-
Activation of store-operated calcium entry in airway smooth muscle cells: insight from a mathematical model.PLoS One. 2013 Jul 25;8(7):e69598. doi: 10.1371/journal.pone.0069598. Print 2013. PLoS One. 2013. PMID: 23936056 Free PMC article.
-
The developing relationship between receptor-operated and store-operated calcium channels in smooth muscle.Br J Pharmacol. 2002 Jan;135(1):1-13. doi: 10.1038/sj.bjp.0704468. Br J Pharmacol. 2002. PMID: 11786473 Free PMC article. Review.
-
Resting calcium influx in airway smooth muscle.Can J Physiol Pharmacol. 2005 Aug-Sep;83(8-9):717-23. doi: 10.1139/y05-063. Can J Physiol Pharmacol. 2005. PMID: 16333373 Review.
Cited by
-
Ca2+ dynamics in interstitial cells: foundational mechanisms for the motor patterns in the gastrointestinal tract.Physiol Rev. 2024 Jan 1;104(1):329-398. doi: 10.1152/physrev.00036.2022. Epub 2023 Aug 10. Physiol Rev. 2024. PMID: 37561138 Free PMC article. Review.
-
Estrogen receptors differentially regulate intracellular calcium handling in human nonasthmatic and asthmatic airway smooth muscle cells.Am J Physiol Lung Cell Mol Physiol. 2020 Jan 1;318(1):L112-L124. doi: 10.1152/ajplung.00206.2019. Epub 2019 Oct 16. Am J Physiol Lung Cell Mol Physiol. 2020. PMID: 31617730 Free PMC article.
-
Asthma: A Loss of Post-natal Homeostatic Control of Airways Smooth Muscle With Regression Toward a Pre-natal State.Front Pediatr. 2020 Apr 16;8:95. doi: 10.3389/fped.2020.00095. eCollection 2020. Front Pediatr. 2020. PMID: 32373557 Free PMC article. Review.
-
On the dynamical structure of calcium oscillations.Proc Natl Acad Sci U S A. 2017 Feb 14;114(7):1456-1461. doi: 10.1073/pnas.1614613114. Epub 2017 Feb 1. Proc Natl Acad Sci U S A. 2017. PMID: 28154146 Free PMC article.
-
TRIC-A shapes oscillatory Ca2+ signals by interaction with STIM1/Orai1 complexes.PLoS Biol. 2020 Apr 24;18(4):e3000700. doi: 10.1371/journal.pbio.3000700. eCollection 2020 Apr. PLoS Biol. 2020. PMID: 32330125 Free PMC article.
References
-
- Ay B, Iyanoye A, Sieck GC, Prakash YS & Pabelick CM (2006). Cyclic nucleotide regulation of store‐operated Ca2+ influx in airway smooth muscle. Am J Physiol Lung Cell Mol Physiol 290, L278–L283. - PubMed
-
- Ay B, Prakash YS, Pabelick CM & Sieck GC (2004). Store‐operated Ca2+ entry in porcine airway smooth muscle. Am J Physiol Lung Cell Mol Physiol 286, L909–L917. - PubMed
-
- Bers DM (2002). Cardiac excitation–contraction coupling. Nature 415, 198–205. - PubMed
-
- Billington CK, Hall IP & Nelson CP (2014). Mechanisms underlying Ca2+ store refilling in airway smooth muscle In Calcium Signaling In Airway Smooth Muscle Cells, pp. 177–193. Springer, Cham, Switzerland.
Publication types
MeSH terms
Substances
LinkOut - more resources
Full Text Sources
Other Literature Sources
Research Materials
Miscellaneous