

Modeling central metabolism and energy biosynthesis across microbial life
- PMID: 27502787
- PMCID: PMC4977884
- DOI: 10.1186/s12864-016-2887-8
Modeling central metabolism and energy biosynthesis across microbial life
Abstract
Background: Automatically generated bacterial metabolic models, and even some curated models, lack accuracy in predicting energy yields due to poor representation of key pathways in energy biosynthesis and the electron transport chain (ETC). Further compounding the problem, complex interlinking pathways in genome-scale metabolic models, and the need for extensive gapfilling to support complex biomass reactions, often results in predicting unrealistic yields or unrealistic physiological flux profiles.
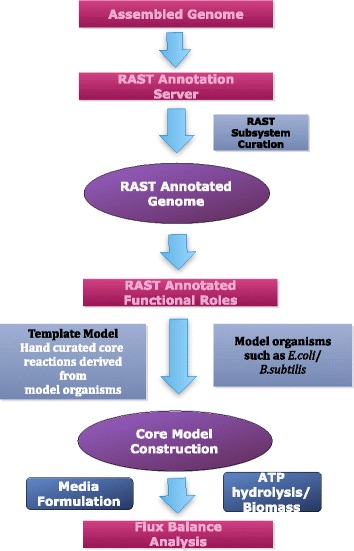
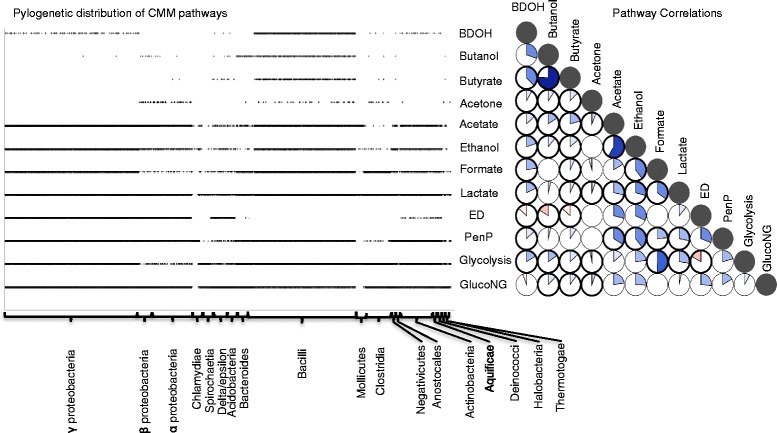
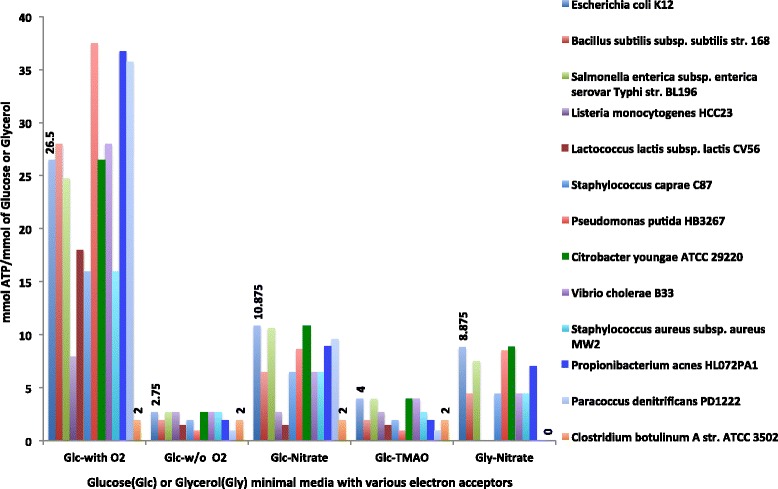
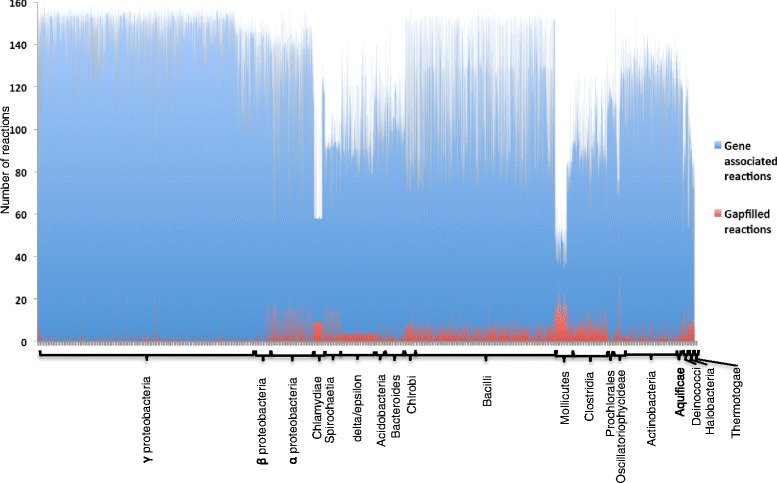
Results: To overcome this challenge, we developed methods and tools ( http://coremodels.mcs.anl.gov ) to build high quality core metabolic models (CMM) representing accurate energy biosynthesis based on a well studied, phylogenetically diverse set of model organisms. We compare these models to explore the variability of core pathways across all microbial life, and by analyzing the ability of our core models to synthesize ATP and essential biomass precursors, we evaluate the extent to which the core metabolic pathways and functional ETCs are known for all microbes. 6,600 (80 %) of our models were found to have some type of aerobic ETC, whereas 5,100 (62 %) have an anaerobic ETC, and 1,279 (15 %) do not have any ETC. Using our manually curated ETC and energy biosynthesis pathways with no gapfilling at all, we predict accurate ATP yields for nearly 5586 (70 %) of the models under aerobic and anaerobic growth conditions. This study revealed gaps in our knowledge of the central pathways that result in 2,495 (30 %) CMMs being unable to produce ATP under any of the tested conditions. We then established a methodology for the systematic identification and correction of inconsistent annotations using core metabolic models coupled with phylogenetic analysis.
Conclusions: We predict accurate energy yields based on our improved annotations in energy biosynthesis pathways and the implementation of diverse ETC reactions across the microbial tree of life. We highlighted missing annotations that were essential to energy biosynthesis in our models. We examine the diversity of these pathways across all microbial life and enable the scientific community to explore the analyses generated from this large-scale analysis of over 8000 microbial genomes.
Figures
Similar articles
-
Reconstruction and Analysis of Central Metabolism in Microbes.Methods Mol Biol. 2018;1716:111-129. doi: 10.1007/978-1-4939-7528-0_5. Methods Mol Biol. 2018. PMID: 29222751
-
Combining multiple functional annotation tools increases coverage of metabolic annotation.BMC Genomics. 2018 Dec 19;19(1):948. doi: 10.1186/s12864-018-5221-9. BMC Genomics. 2018. PMID: 30567498 Free PMC article.
-
High-throughput comparison, functional annotation, and metabolic modeling of plant genomes using the PlantSEED resource.Proc Natl Acad Sci U S A. 2014 Jul 1;111(26):9645-50. doi: 10.1073/pnas.1401329111. Epub 2014 Jun 9. Proc Natl Acad Sci U S A. 2014. PMID: 24927599 Free PMC article.
-
Addressing uncertainty in genome-scale metabolic model reconstruction and analysis.Genome Biol. 2021 Feb 18;22(1):64. doi: 10.1186/s13059-021-02289-z. Genome Biol. 2021. PMID: 33602294 Free PMC article. Review.
-
Energy coupling in Saccharomyces cerevisiae: selected opportunities for metabolic engineering.FEMS Yeast Res. 2012 Jun;12(4):387-97. doi: 10.1111/j.1567-1364.2012.00799.x. Epub 2012 Apr 2. FEMS Yeast Res. 2012. PMID: 22404754 Review.
Cited by
-
Unveiling the Microbiome Landscape: A Metagenomic Study of Bacterial Diversity, Antibiotic Resistance, and Virulence Factors in the Sediments of the River Ganga, India.Antibiotics (Basel). 2023 Dec 14;12(12):1735. doi: 10.3390/antibiotics12121735. Antibiotics (Basel). 2023. PMID: 38136769 Free PMC article.
-
Architect: A tool for aiding the reconstruction of high-quality metabolic models through improved enzyme annotation.PLoS Comput Biol. 2022 Sep 8;18(9):e1010452. doi: 10.1371/journal.pcbi.1010452. eCollection 2022 Sep. PLoS Comput Biol. 2022. PMID: 36074804 Free PMC article.
-
Microbial central carbon metabolism in a tidal freshwater marsh and an upland mixed conifer soil under oxic and anoxic conditions.Appl Environ Microbiol. 2024 Jun 18;90(6):e0072424. doi: 10.1128/aem.00724-24. Epub 2024 May 21. Appl Environ Microbiol. 2024. PMID: 38771053 Free PMC article.
-
Bio-Inspired Silver Nanoparticles Impose Metabolic and Epigenetic Toxicity to Saccharomyces cerevisiae.Front Pharmacol. 2019 Sep 12;10:1016. doi: 10.3389/fphar.2019.01016. eCollection 2019. Front Pharmacol. 2019. PMID: 31572189 Free PMC article.
-
Designing Metabolic Division of Labor in Microbial Communities.mSystems. 2019 Apr 9;4(2):e00263-18. doi: 10.1128/mSystems.00263-18. eCollection 2019 Mar-Apr. mSystems. 2019. PMID: 30984871 Free PMC article.
References
-
- Gottschalk G. Bacterial metabolism. New York: Springer; 1988.
Publication types
MeSH terms
Substances
Associated data
LinkOut - more resources
Full Text Sources
Other Literature Sources
