. 2016 Aug 22;213(9):1741-57.
doi: 10.1084/jem.20151095. Epub 2016 Aug 8.

An activated form of ADAM10 is tumor selective and regulates cancer stem-like cells and tumor growth

Affiliations

An activated form of ADAM10 is tumor selective and regulates cancer stem-like cells and tumor growth

Lakmali Atapattu et al. J Exp Med. .

Abstract

The transmembrane metalloprotease ADAM10 sheds a range of cell surface proteins, including ligands and receptors of the Notch, Eph, and erbB families, thereby activating signaling pathways critical for tumor initiation and maintenance. ADAM10 is thus a promising therapeutic target. Although widely expressed, its activity is normally tightly regulated. We now report prevalence of an active form of ADAM10 in tumors compared with normal tissues, in mouse models and humans, identified by our conformation-specific antibody mAb 8C7. Structure/function experiments indicate mAb 8C7 binds an active conformation dependent on disulfide isomerization and oxidative conditions, common in tumors. Moreover, this active ADAM10 form marks cancer stem-like cells with active Notch signaling, known to mediate chemoresistance. Importantly, specific targeting of active ADAM10 with 8C7 inhibits Notch activity and tumor growth in mouse models, particularly regrowth after chemotherapy. Our results indicate targeted inhibition of active ADAM10 as a potential therapy for ADAM10-dependent tumor development and drug resistance.


Figures

Figure 1.
Figure 1.
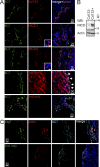
Anti-ADAM10 mAb 8C7 preferentially binds ADAM10 in tumors. (A) Immunofluorescent confocal microscopy of LIM1215 xenograft tumor sections from mice preinjected with Alexa-labeled 8C7 or IgG control (100 µg, 48 h prior) and rhodamine-lectin (15 min prior). 8C7 binding (green) is strongest near blood vessels (labeled by rhodamine lectin, red) and the tumor rim (marked by dotted lines). Hoechst stain shows nuclei (blue). (B) Fluorescence microscopy of tumor and tissue sections from mice preinjected 48 h prior with 100 µg Alexa-labeled 8C7 or control ADAM10 antibody MAB946 (both antibodies recognize human and mouse ADAM10) or IgG control. (A and B) Scale bars are in micrometers. (C) WB analysis of 8C7-bound ADAM10 recovered by protein A Sepharose from tissue lysates of tumor-bearing mice, injected with 1 mg 8C7 or PBS (top). Bottom panels show overall ADAM10 expression by IP/WB with a control antibody recognizing mouse and human ADAM10 (Abcam pAb 39177) and lysate loading control (GAPDH). HMW ADAM10 is prevalent in tumors. The asterisk indicates a nonspecific band from spleen in both 8C7- and PBS-injected mice. bd c, 8C7-bead–only control. Panels show data representative of three independent experiments.
Figure 2.
Figure 2.
mAb 8C7 preferentially binds an active form of ADAM10 in tumors. (A) Immunoprecipitates with anti-ADAM10 mAbs 8C7 and 4A11, or an isotype-matched IgG control, from lysates of LIM1215 human tumor cells or mouse embryonic fibroblasts (MEFs; irrelevant lane removed, as indicated by black lines). (B) Immunoprecipitates of ADAM10 from human colorectal tumors (tum) or matched normal (norm) tissue samples with 8C7 or control ADAM10 mAb 4A11, Western blotted for ADAM10 (top panel represents longer exposure time). Total lysates were blotted for GAPDH as loading control. Graph shows relative levels of HMW and LMW ADAM10 bands in each sample (mean ± SEM; n = 3; *, P < 0.05 by unpaired two-tailed Student’s t test). (C) The HMW form of ADAM10 is present on the cell surface. Intact LIM1215 cells were incubated with 8C7 or 4A11 at 37°C or under conditions inhibiting endocytosis (on ice or in the presence of 0.4 M sucrose). Cells were washed and lysed, and protein A beads were added to pull down mAb-bound ADAM10. Samples were analyzed by WB with α-ADAM10 pAb. (D) Furin treatment confirms HMW ADAM10 is unprocessed. 8C7 and 4A11 IPs from LIM1215 lysates were treated with a dose range of recombinant Furin for 1 h, and samples were analyzed by WB with an α-ADAM10 pAb and an ADAM10 pro-domain–specific antibody. (E) Activity assays and matching WBs of nonreduced ADAM10 immunoprecipitates from lysates of LIM1215 cells (left) or human CRC tumor tissue (right), using a quenched fluorescent peptide substrate that fluoresces upon cleavage (FRET assay; mean ± SEM; n = 3 experiments; *, P = 0.05; ***, P < 0.001 by unpaired two-tailed Student’s t test). In the left panel, immunoprecipitates were adjusted to have similar levels of ADAM10, and activity is expressed relative to ADAM10 levels (bottom panel, arbitrary units). For the tumor samples (right), IPs were from lysates with equal total protein, and both relative and total activity are shown. (F) Processing does not alter ADAM10 activity. 8C7 IPs from whole cell LIM1215 lysates were treated with recombinant Furin (20 U/ml, 1 h) or left untreated before assay for ADAM10 sheddase activity using a quenched fluorogenic peptide substrate. Activity was determined relative to ADAM10 levels as in E (mean ± SEM; n = 3). (G) Sequential IP of LIM1215 cell lysates with 4A11 and 8C7. Top panel shows WB of ADAM10 recovered from initial precipitations; bottom panels show subsequent precipitations from remaining precleared supernatants as indicated. All data are representative of at least two independent experiments.
Figure 3.
Figure 3.
Crystal structure of the 8C7 F(ab′)2/ADAM10 D+C complex. (A) The heavy chain of the 8C7 mAb is in magenta, and the light chain is in cyan. The disintegrin and cysteine-rich domains of ADAM10 are in green. Disulfide bridges in ADAM10 are drawn as sticks and colored in yellow. Glycosylation moieties are drawn as gray spheres. A calcium ion, bound in the ADAM disintegrin domain, is in blue. There are two copies of the ADAM10 D+C/8C7 F(ab′)2 fragment complex in the asymmetric unit, which are nearly identical with an r.m.s.d. of 0.62 Å for 557 Cα atoms. (B) Two close-up views of the 8C7/ADAM10 interface. The right panel view is a 60-degree rotation from the left panel view. The heavy chain of the 8C7 mAb is in magenta, the light is in cyan, and ADAM10 is in green. The interacting residues are drawn as sticks and labeled on the right panel. The molecular surface of 8C7, which is in contact with ADAM10, is rendered in gray on the right panel. (C) The ADAM10/Mab complex structure highlighting the position of the bound 8C7 relative to the location of the CxxC motif. (D) Close up of the 8C7/ADAM10 interface showing interacting residues (red) in ADAM10, including C639, which forms a disulfide bond (yellow) with C594 of the CxxC motif. A space-filled representation of the 8C7 F(ab′)2 is shown (magenta). The sequence alignment at the bottom shows disulfide bonding observed in our ADAM10 structures (black lines) and an alternate disulfide pattern (blue lines) predicted from experiments on ADAM17 (Düsterhöft et al., 2013). Conserved residues are highlighted in yellow, with cysteines in red boxes.
Figure 4.
Figure 4.
8C7 binding to ADAM10 is dependent on the CxxC motif and redox conditions. (A) Mutation of ADAM10 CxxC motif blocks binding of 8C7 but not control mAb. WT and AxxA mutant hADAM10 were transfected into ADAM10−/− mouse embryonic fibroblasts, and lysates were analyzed by IP with 8C7 and commercial (R&D Systems MAB1427) anti-ADAM10 antibodies and WB. (B) 8C7 binding to ADAM10 is modulated by redox conditions. LIM1215 cells were treated with reductant (DTT), oxidant (H2O2), or EGF or Eph RTK stimulation (with EGF or ephrin-A5 [EfnA5], respectively). ADAM10 was immunoprecipitated from cell lysates with 8C7 or control mAb 4A11 and analyzed by WB. Graph shows mean ± SEM; n = 6 experiments; *, P < 0.05; **, P < 0.01; ***, P < 0.001 by one-sample Student’s t test relative to control. (C) Binding of Alexa-labeled 8C7 and 4A11 to cell surface ADAM10 on LIM1215 cells was assessed by flow cytometry in cells untreated or treated with 100 ng/ml EGF or 1 mM H2O2 for 30 min. Graphs show binding normalized to control cells; mean ± SEM; n = 3 experiments; *, P < 0.05 by one-sample Student’s t test relative to control. (D) 8C7-targeted cells in tumors have high ROS production. Mice with LIM1215 xenografts were injected with 100 µg (6.7 mg/kg) Alexa647-labeled 8C7, tumors were recovered, and 8C7-Alexa647–positive and –negative cells were sorted by FACS. Equal cell numbers were then analyzed for ROS production by Amplex red assay. Graph shows mean ± SEM; n = 4 experiments; **, P = 0.001 by unpaired Student’s t test. (E) PDI treatment exposes labile, disulfide-bonded cysteines. ADAM10 IPs from LIM1215 cell lysates were treated with methyl-PEG12-maleimide (MPM) to block free cysteines and then with PDI (5 µg/ml), or DTT (20 µM) as positive control, followed by MPB. Biotinylation and total ADAM10 levels were detected by WB using streptavidin-HRP and α-ADAM10 antibody, respectively. Untr, untreated with MPB. (F) PDI associates with 8C7-bound ADAM10 in cells. IPs from LIM1215 cell lysates with 8C7, 4A11, or control mAb were Western blotted with antibodies against PDI or ADAM10. (B and F) Black lines indicate that intervening lanes have been spliced out.
Figure 5.
Figure 5.
8C7-recognized, active ADAM10 preferentially marks cancer stem-like cells with active Notch signaling. (A) LIM1215 tumor sections from mice injected once with Alexa647 8C7 (100 µg, sub-therapeutic dose) and rhodamine-lectin were costained with antibodies against the tumor stem cell marker CD133 or against cleaved (active) Notch1 or Notch2 intracellular domains (NICD1,2), or EpCam. Dark blue indicates nuclear stain. Insets show high-magnification images of tumors from control, non–8C7-injected mice showing specificity of NICD staining and colocalization with nuclear stain; inset bars, 10 µm. Arrows indicate colocalization of 8C7 and EpCam staining. (B) Dispersed tumor cells were sorted for CD133 expression by FACS, and lysates from equal numbers of CD133+/− cells were analyzed by WB for active Notch1 (NICD1). (C) Tumor sections from A were costained for Notch ligand Jagged1. Data are representative of at least two independent experiments. (A and C) Scale bars are in micrometers.
Figure 6.
Figure 6.
8C7 inhibits Notch signaling in tumor cells. (A) Protein extracts of LIM1215 tumors from mice (n = 4) treated for 3 wk with PBS (control) or 8C7 or control IgG (67 mg/kg) were analyzed by WB with antibodies against NICD or actin as loading control (# IgG bands). Graph shows quantitation of NICD level relative to Notch1 (n.s., nonsignificant). (B) RNA extracts of LIM1215 tumors from the mice treated as in A were analyzed by real-time PCR for expression of Notch target Hes1 (normalized to averaged control). (C) Tumors from mice (n = 3) treated as in A were stained with anti-NICD1 antibody, and positive nuclei counts from whole tumor sections or regions (∼10/section) of positive staining were quantified. Images show representative areas of positive staining, including around vessel-like structures. Graphs in A–C show mean ± SEM (n = 4); *, P < 0.05; **, P < 0.01 by unpaired two-tailed Student’s t test. (D) Proximal small intestine from vehicle control and 8C7-treated mice (n = 7) was analyzed for expression of Ki67 and NICD (by IHC) and for Olfm4 (by in situ hybridization). (C and D) Scale bars are in micrometers. (E) Quantitative PCR analysis of RNA extracts from small intestine of mice as in D, showing expression (relative to average control) of the indicated markers. (D and E) Graphs show mean ± SEM (n = 7); n.s., nonsignificant by unpaired two-tailed Student’s t test. (F) Tumor cells recovered from LIM1215 tumor xenografts were sorted for negative anti-CD133 staining and maintained in culture. HUVECs were then added for 30 min in the presence of 8C7 (20 or 100 µg/ml), control IgG (100 µg/ml), GSI (10 µM), or vehicle control. Cell lysates were recovered and analyzed by WB as indicated. Black lines indicate that intervening lanes have been spliced out. Graph shows levels of active Notch1 (NICD1) relative to control (mean ± SEM; **, P < 0.01 by unpaired two-tailed Student’s t test [8C7 vs. control IgG]; n = 3 experiments). (G) 8C7 inhibits Notch-dependent lymphoma cell proliferation. Co-cultures of lymphoma cells isolated from Eμ-Myc mice (red) and E4ORF1-transduced HUVECs expressing Jagged1 (ECs, green) were grown in serum-free conditions in the presence of 5 µg/ml 8C7 or control IgG for 5 d and counted over time. Lymphoma cells cultured alone serve as control for dependence on ECs (red line; n = 3). Bar, 50 µm.
Figure 7.
Figure 7.
8C7 inhibits growth of LIM1215 tumors in mice. (A–C) Mice bearing LIM1215 human tumors were treated with 8C7 mAb (33 or 67 mg/kg) or PBS control (n = 8). (A) Tumor volumes. (B) Final tumor mass. (C) Final mouse weights. (D) Repeat experiment as in A with 67 mg/kg 8C7 or an isotype-matched control mAb (IgG) shows the specific effect of 8C7 (n = 3). (E) Staining of endothelial cells (α-CD31) shows reduced vascularity in 8C7-treated tumors. (F) TUNEL staining of tumors shows increased apoptosis after 8C7 treatment, especially at the vascularized tumor rim. (E and F) Scale bars are in micrometers. (G) WB analysis of lysates from individual tumors (eight/treatment) shows down-regulation of Notch receptors, EphA2, and MET in 8C7-treated tumors. Graphs show mean ± SEM; *, P < 0.05; **, P < 0.01; ***, P < 0.001 by two-tailed Student’s t test (8C7 vs. PBS). Data are representative of three independent experiments.
Figure 8.
Figure 8.
8C7 inhibits spontaneous tumor growth in gp130F/F knock-in mice. (A) 8C7 immunoprecipitates of ADAM10 from stomach tissues from gp130F/F knock-in mice that develop spontaneous gastrointestinal tumors at 5–6 wk of age. Samples from different parts of the stomach are shown; F, fundus; C, corpus; A, antrum; T, tumor. Note the appearance of HMW ADAM10 at 5–6 wk, but not in WT mice (6 wk). (B) Mice were treated twice/week from 3 wk of age with 8C7 (n = 10), PBS (n = 9), or control IgG (n = 7), using littermates from four individual experiments. Tumor burden, mouse weight, and spleen weight were assessed at 8 wk. Graphs show mean ± SEM. (C) Tumor sections from 8C7- or control IgG–treated mice (n = 4) were analyzed by staining for active notch (NICD1). Graph shows mean ± SEM using 10 images/treatment. Scale bar is in micrometers. (D) RT-PCR analysis of Hes1 in tumors from gp130F/F mice treated with 8C7 or control IgG (mean ± SEM, n = 4) normalized to PBS treated. For all graphs, *, P < 0.05; **, P < 0.01; ***, P < 0.001 by unpaired, two-tailed Student’s t test.
Figure 9.
Figure 9.
8C7 is most effective in combination with chemotherapy. (A) Tumor volumes of LIM1215 tumor xenografts treated with Irinotecan (three injections, arrows) alone (orange), or with continued 8C7 treatment (red, 1 mg), or PBS alone (green). Graph shows mean tumor volumes (with SEM) measured over time (n ≥ 5). (B) Weight of tumors recovered from mice in A. (C) The percentage of CD133+ cells in tumors recovered from mice treated as in A (n ≥ 5) was assessed by FACS with anti-CD133 antibodies. (B and C) Graphs show mean ± SEM; **, P < 0.01 by unpaired two-tailed Student’s t test. Data are representative of three independent experiments.
Figure 10.
Figure 10.
8C7 does not inhibit ADAM10 substrate binding but likely displaces its MP domain. (A) 8C7-bound ADAM10 shows preferential association with Notch receptor substrates. IPs from LIM1215 lysates with 8C7 and 4A11, equalized for ADAM10 levels by WB, were blotted with antibodies against the indicated proteins. Graphs show ratio between coprecipitated proteins and levels of total ADAM10 quantitated by densitometry (mean ± SEM from three independent experiments; *, P < 0.05; **, P < 0.01 by one-sample Student’s t test relative to 4A11 binding). (B) Comparison of 8C7/ADAM10 D+C structure with full-length structures of related snake venom MPs shows similar positioning of MP domains compared with 8C7 binding, indicating likely competition.

References

    1. Anders A., Gilbert S., Garten W., Postina R., and Fahrenholz F.. 2001. Regulation of the alpha-secretase ADAM10 by its prodomain and proprotein convertases. FASEB J. 15:1837–1839. - PubMed
    1. Atapattu L., Saha N., Llerena C., Vail M.E., Scott A.M., Nikolov D.B., Lackmann M., and Janes P.W.. 2012. Antibodies binding the ADAM10 substrate recognition domain inhibit Eph function. J. Cell Sci. 125:6084–6093. 10.1242/jcs.112631 - DOI - PMC - PubMed
    1. Atapattu L., Lackmann M., and Janes P.W.. 2014. The role of proteases in regulating Eph/ephrin signaling. Cell Adh. Migr. 8:294–307. 10.4161/19336918.2014.970026 - DOI - PMC - PubMed
    1. Benham A.M. 2012. The protein disulfide isomerase family: key players in health and disease. Antioxid. Redox Signal. 16:781–789. 10.1089/ars.2011.4439 - DOI - PubMed
    1. Benz C.C., and Yau C.. 2008. Ageing, oxidative stress and cancer: paradigms in parallax. Nat. Rev. Cancer. 8:875–879. 10.1038/nrc2522 - DOI - PMC - PubMed

Publication types