. 2016 Aug 22;213(9):1759-78.
doi: 10.1084/jem.20160368. Epub 2016 Aug 8.

Widespread transneuronal propagation of α-synucleinopathy triggered in olfactory bulb mimics prodromal Parkinson's disease

Affiliations

Widespread transneuronal propagation of α-synucleinopathy triggered in olfactory bulb mimics prodromal Parkinson's disease

Nolwen L Rey et al. J Exp Med. .

Abstract

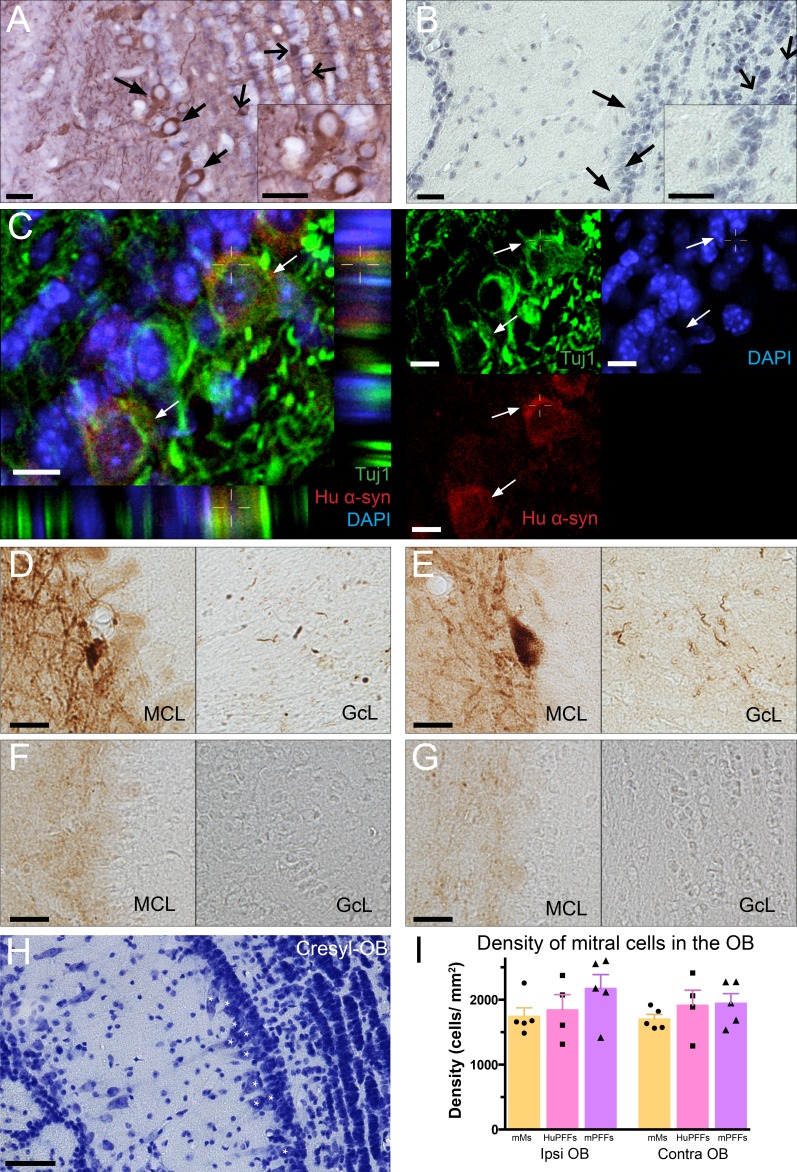
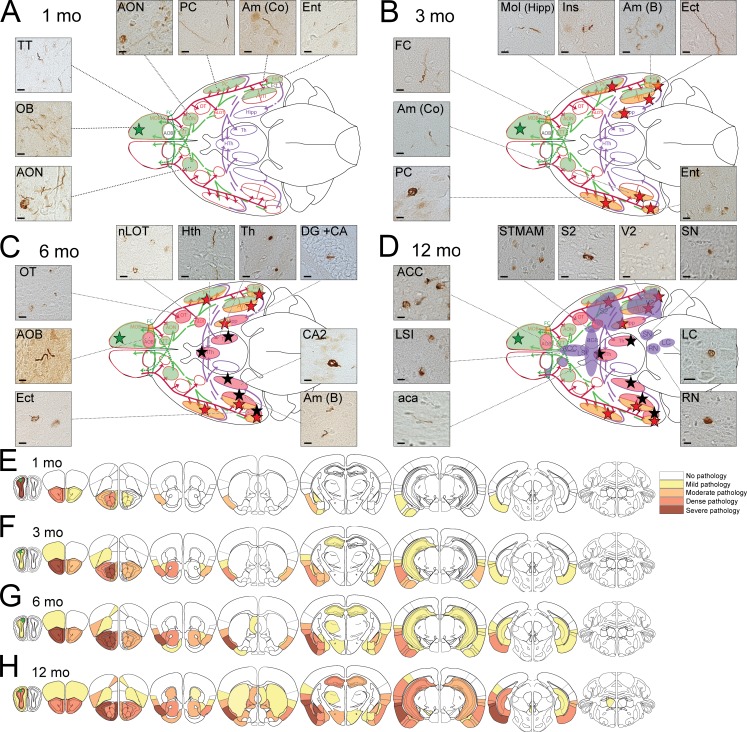
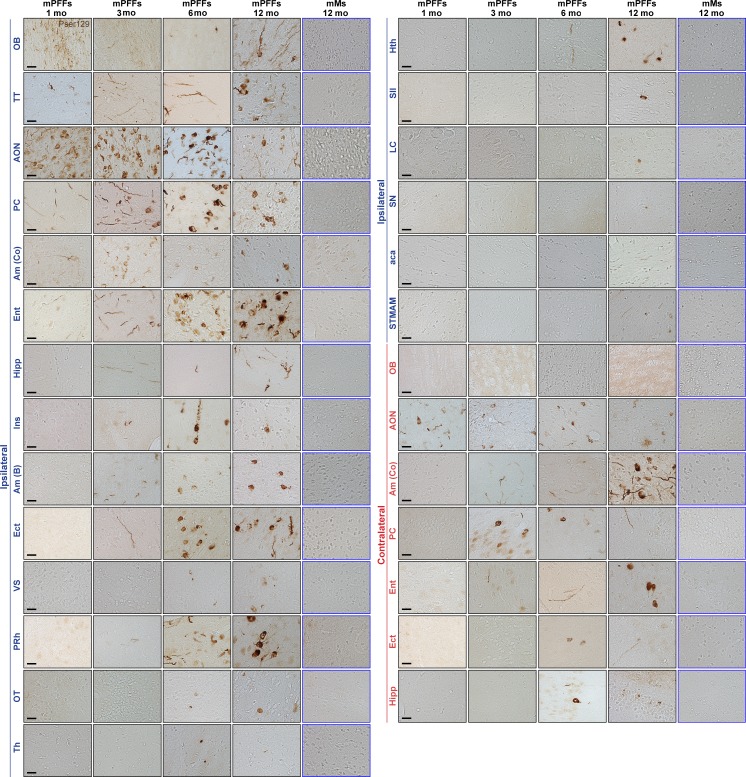
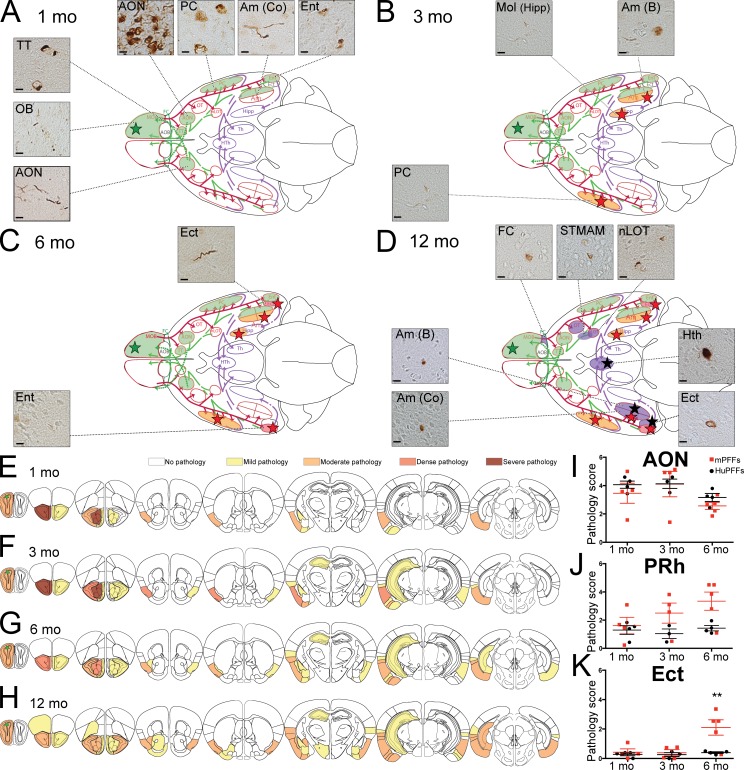
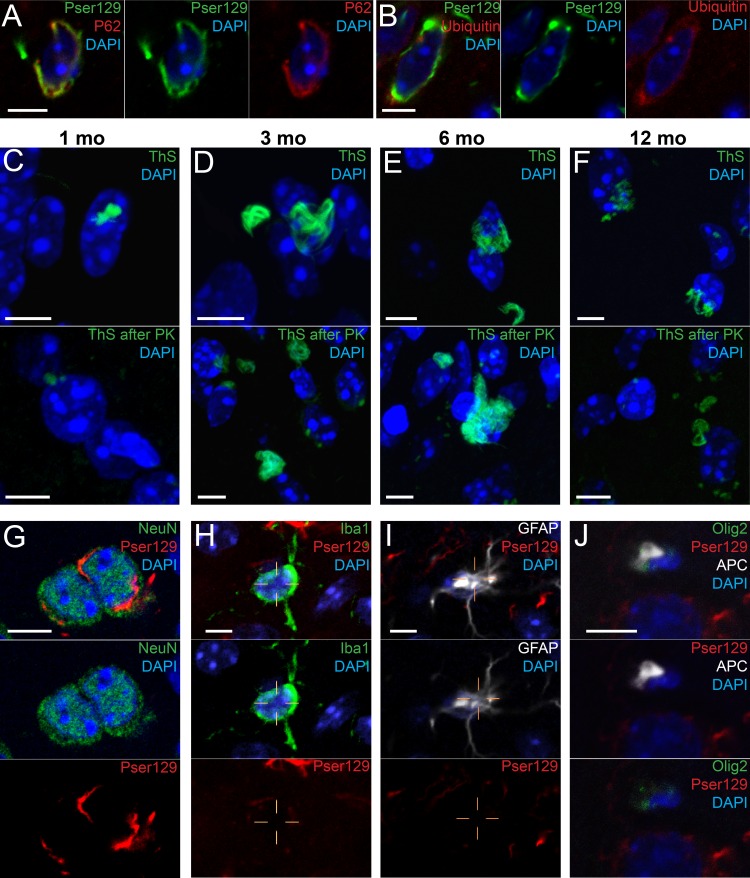
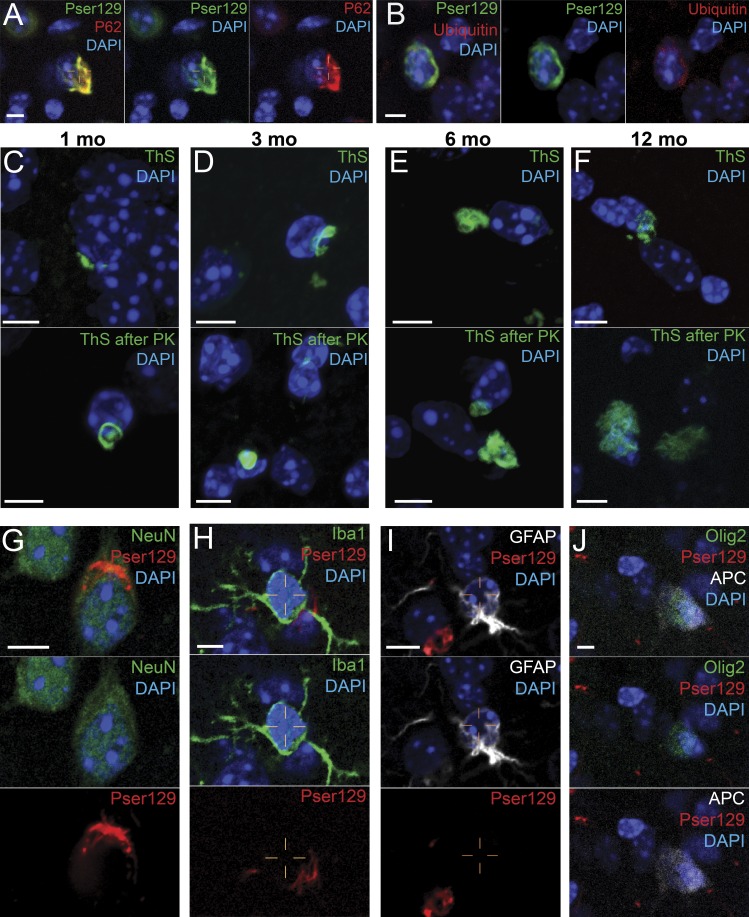
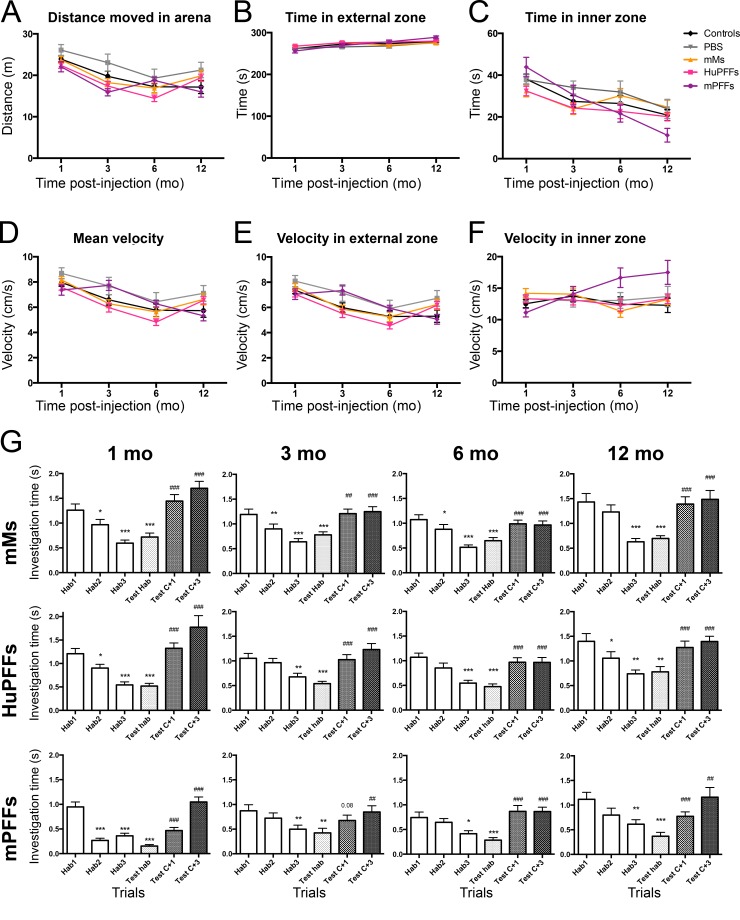
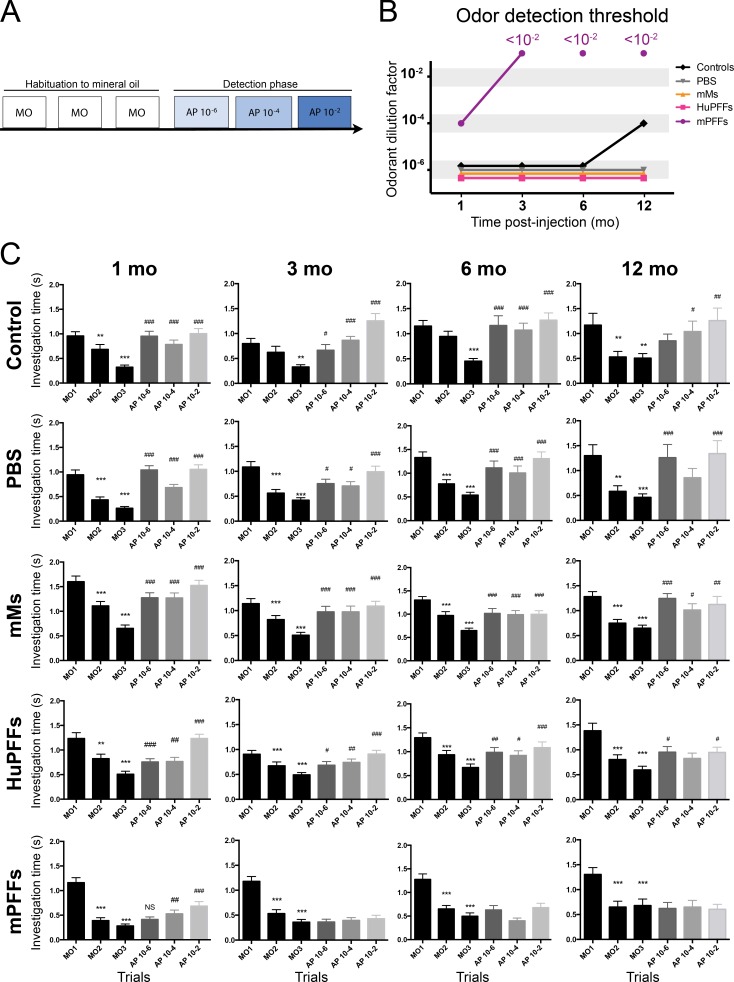
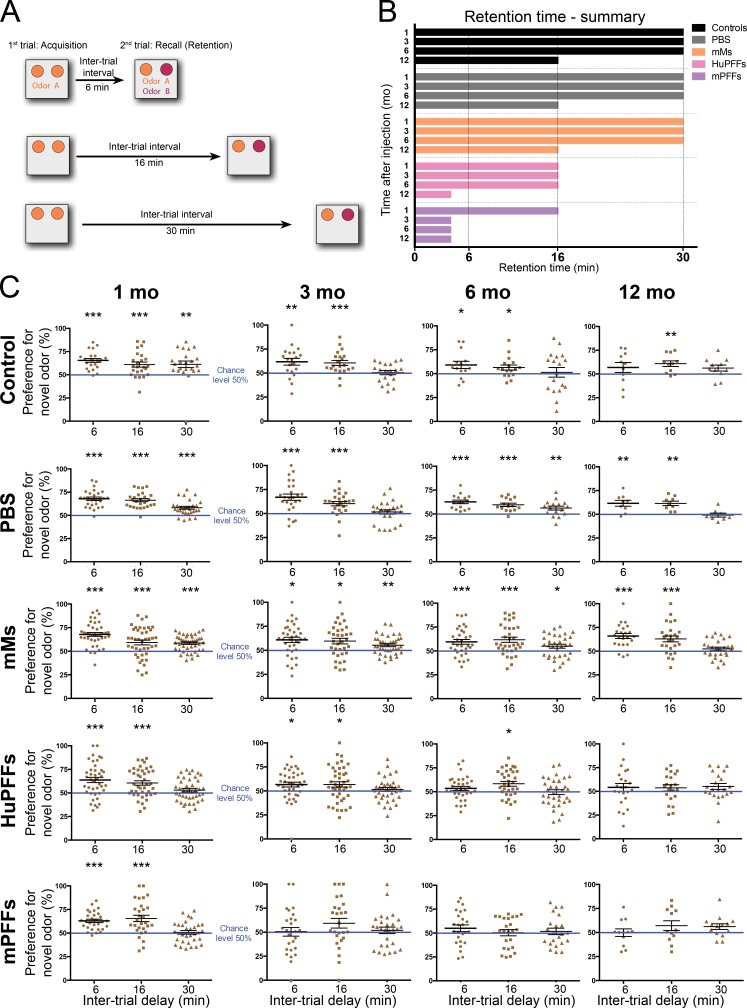
Parkinson's disease (PD) is characterized by the progressive appearance of intraneuronal Lewy aggregates, which are primarily composed of misfolded α-synuclein (α-syn). The aggregates are believed to propagate via neural pathways following a stereotypical pattern, starting in the olfactory bulb (OB) and gut. We hypothesized that injection of fibrillar α-syn into the OB of wild-type mice would recreate the sequential progression of Lewy-like pathology, while triggering olfactory deficits. We demonstrate that injected α-syn fibrils recruit endogenous α-syn into pathological aggregates that spread transneuronally over several months, initially in the olfactory network and later in distant brain regions. The seeded inclusions contain posttranslationally modified α-syn that is Thioflavin S positive, indicative of amyloid fibrils. The spreading α-syn pathology induces progressive and specific olfactory deficits. Thus, we demonstrate that propagating α-syn pathology triggered in the OB is functionally detrimental. Collectively, we have created a mouse model of prodromal PD.


Figures

Figure 1.
Figure 1.
PFFs injected in the OB of WT mice were rapidly taken up by mitral cells and induced α-syn pathology after 1 mo. (A and B) Mitral cells (plain black arrows; cells delineated in B) and granule cells (simple wide black arrows) were positive for human α-syn 1.5 h after injection of HuPFFs in the OB (A), but not in noninjected animals (B). (C) 1.5 h after injection, human α-syn (red) was detected within mitral cells (Tuj1-positive, green DAPI, blue; white arrows). (D–G) α-Syn pathology detected by an antibody directed against α-syn phosphorylated on serine 129 (Pser129) can be observed in mitral cells in the mitral cell layer (MCL) and the granule cell layer (GcL) of OB 1 mo after injection of HuPFFs (D) or mouse PFFs (mPFFs; E), but not after injection of mouse monomers (mMs; F) or PBS (G). (A–G) Histochemical analysis was performed on all animals euthanized 1.5 h after HuPFFs injection in one histochemical experiment (A–C; n = 4 per group), and in six independent histochemical experiments on all animals euthanized 1, 3, 6, and 12 mo after injection of PBS, mMs, HuPFFs, and mPFFs (D–G; n = 4–5 per group). The data shown are from one representative animal. (H) Cresyl staining in the OB from one representative animal. White stars mark mitral cells. (I) Density of mitral cells in the mitral cell layer of the OB (n = 4–5 animals per group, performed on all animals from the 1-, 3-, and 6-mo survival time points; Ipsi, ipsilateral; Contra, contralateral). Data were analyzed by Kruskal–Wallis testing. No significant differences were observed (P = 0.41). Bars: (A and B) 20 µm; (C) 10 µm; (D–G) 20 µm; (H) 50 µm.
Figure 2.
Figure 2.
mPFFs injected in OB caused progressive spreading of α-syn pathology first to olfactory structures, then to connected brain regions. (A–D) Schematic of a ventral brain view. First and second order projections from and to the OB are depicted, respectively, in a red solid line, purple-dashed line, and green-dashed line. Colored regions represent brain structures where mPFFs-induced pathology appears (Pser129) at 1 mo (A, green regions), 3 mo (B, orange regions), 6 mo (C, pink regions), and 12 mo (D, purple regions) after injection. Micrographs show pathology (Pser129) in related brain regions. Location of injection is indicated with a green star. A list of the abbreviations is available as Table S3. The sections were immunostained in eight independent histochemical experiments. Histochemical analysis was performed on all animals from the 1-, 3-, 6-, and 12-mo survival time points; 1 and 3 mo delay, n = 4 mice per group; 6 and 12 mo delay, n = 5 mice per group. (A) At 1 mo delay, pathology was observed in olfactory regions (ipsi AON, PC, Am Co, Ent, TT, OB, and contra AON; Table S3). (B) Pathology was detected in additional brain regions after 3 mo (including ipsi FC, Mol, Am B, Ect, and contra Am Co, PC, and Ent). Regions located one synapse away from the olfactory system are identified with a red star. (C) Pathology was detected in additional brain regions after 6 mo (including ipsi nLOT, hypothalamus, thalamus, Hipp, OT, AOB, and contra CA2, AmB, and Ect). Brain regions located two synapses away from the olfactory system are labeled by a black star. (D) 12 mo after injection, additional brain regions displayed pathology. (E–H) Diagram illustrating the anatomical pattern of α-syn pathology in the brain on coronal sections 1 (E), 3 (F), 6 (G), and 12 mo (H) after injection. Bars: (A–D) 10 µm.
Figure 3.
Figure 3.
Injection of mPFFs in the OB induced widespread α-syn pathology (Pser129) in the brain. Pathology (Pser129) detected in numerous brain regions from 1 to 12 mo after injection of mPFFs in ipsilateral (Ipsi) and contralateral (Contra) structures. Histochemical analysis was performed on all animals from the 1-, 3-, 6-, 12-mo survival time points. The sections were immunostained in eight independent histochemical experiments. n = 4–5 animals per group. The data shown are from representative animals. List of abbreviations is available in Table S3. Bars: 20 µm.
Figure 4.
Figure 4.
HuPFFs inoculated in OB led to slower progressive spreading of α-syn pathology first to olfactory structures, and then to connected brain. (A–D) Schematic of a ventral brain view, depicting the localization of pathology (Pser129) at 1, 3, 6, and 12 mo after huPFFs injections. Micrographs show pathology (Pser129) in related brain regions. (A–E) Histochemical analysis was performed on all animals from the 1-, 3-, 6-, and 12-mo survival time points. The sections were immunostained in eight independent histochemical experiments. 1 and 3 mo delay, n = 4 mice per group; 6 and 12 mo delay, n = 5 mice per group. (A) At 1 mo delay, pathology was observed in olfactory regions (Ipsi AON, Pc, Am Co, Ent, TT, OB, and contra AON). Bar, 10 µm. (B) At 3 mo delay, pathology appeared in a few more ipsilateral (Mol and Am B) and contralateral brain regions (PC). Regions located one synapse away from the olfactory system are identified with a red star. (C) Pathology appeared in two additional brain regions after 6 mo. (D) 12 mo after injection, additional brain regions show pathology; Regions located 2 synapses away from the olfactory system are identified with black stars. (E–H) Diagram illustrating the anatomical pattern of α-syn pathology in the brain on coronal sections, 1 mo (E), 3 mo (F), 6 mo (G), and 12 mo (H) after injection. (I–K) Scoring of Pser129 immunoreactivity (neurites and cell bodies) in the AON (I), the perirhinal (PRh; J), and ectorhinal cortex (Ect; K). Scoring was performed on all animals from the 1-, 3-, 6-months survival time points. Sections were immunostained in eight independent histochemical experiments (1 and 3 mo delay, n = 4 mice per group; 6 mo delay, n = 5 mice per group) and were analyzed by two-way ANOVA, followed by a Tukey post-hoc test. Statistics are provided in Table S4. **, P < 0.05.
Figure 5.
Figure 5.
Inclusions induced by inoculation of mPFFs are positive for markers of Lewy bodies and are present only in neurons. (A–D) Pser129-positive inclusions (green; DAPI in blue) co-localized with p62 (A, red) and ubiquitin (B, red). Inclusions in the AON are also detected by ThS 1 (C), 3 (D), 6 (E), and 12 mo after injection (C–F) and are resistant to Proteinase K treatment (C–F, bottom). (G–J) Pser129-positive inclusions were detected in NeuN-positive cells (neurons; G), but not in Iba-1– (microglial cells; H), GFAP- (astrocytes; I), or Olig2-APC-CC1–positive cells (oligodendrocytes; J) in the AON, 1 mo after injection. Histochemical analysis was performed on all animals from 1 mo delay (A–B and G–J), and all animals from the 1-, 3-, 6-, and 12-mo survival time points (C–F). The sections were immunostained in one single histochemical experiment for each marker used. 1 and 3 mo delay, n = 4 mice per group; 6 and 12 mo delay, n = 5 mice per group). Bars: (A–J) 5 µm.
Figure 6.
Figure 6.
Inclusions induced by inoculation of HuPFFs are positive for markers of Lewy bodies, and are present only in neurons. (A–D) Pser129-positive inclusions (green) in AON co-localize with p62 (A, red) and Ubiquitin (B, red). Inclusions in the AON are also ThS positive 1 (C), 3 (D), 6 (E), and 12 mo (F) after injection, and are resistant to Proteinase K treatment (C–F, bottom). (E–H) Pser129-positive inclusions were present in NeuN-positive cells (neurons, E), but not in Iba-1– (microglial cells, F), GFAP- (astrocytes, G), or Olig2-APC-CC1–positive cells (oligodendrocytes, H) in the AON 1 mo after injection. Histochemical analysis was performed on all animals from 1 mo delay (A–B and G–J), and all animals from the 1-, 3-, 6-, and 12-mo survival time points (C–F). The sections were immunostained in one single histochemical experiment for each marker used (1 and 3 mo delay, n = 4 mice per group; 6 and 12 mo delay, n = 5 mice per group). Bars: (A–J) 5 µm.
Figure 7.
Figure 7.
Changes in the density of microglia after injections of mMs and mPFFs. (A) Microphotographs of Iba-1–immunopositive cells in the anterior olfactory nucleus (AON) of mice injected with PBS, HuPFFs, mMs, and mPFFs at 1 and 3 mo after injection. The data shown are from one representative animal. Bar, 50 µm. (B) Density of Iba1-positive cells (microglia) in the AON at 1 and 3 mo after injection (n = 4–5 animals per group). Histochemical analysis was performed on all animals from 1- and 3-mo survival time points, in two separate histochemical experiments. Data were analyzed by Linear Mixed-effect Model. After multiple testing corrections, no difference between groups was detected. P > 0.05.
Figure 8.
Figure 8.
mPFFs- and HuPFFs-injected mice did not exhibit alteration of locomotion or anxiety level, or deficits in odor discrimination in the open field test. (A) Total distance moved in the area during a 5-min trial. (B and C) Time spent in external zone (B) and in inner zone (C). (D) Mean velocity in the open field. (E–F) Velocity of mice in the external zone (E) and the inner zone (F). Behavioral data were acquired from four independent experiments. No significant differences (P > 0.05; analysis by linear mixed-effect models) were observed between groups and across aging. Number of animals per group (control, mMs, PBS, HuPFFs, and mPFFs, respectively) for 1-mo survival time point: 25, 29, 44, 43, and 33; 3-mo survival time point: 21, 25, 39, 39, and 28; 6-mo survival time point: 18, 17, 32, 36, and 28; and 12-mo survival time point: 11, 9, 29, 25, and 17. (G) Odor discrimination test. Mice were first habituated during a prehabituation trial with MO. Next, mice were exposed to the habituation odor during three successive trials (OHab1, OHab2, and OHab3) and, finally, to three presentations of test odorants (Test OHab, Test C+1, Test C+3) in a random order, separated by a presentation of habituation odor (OHab) between each test odorant. All the mice habituated to the habituation odor during the three first trials and investigated the odors C+1 and C+3 more significantly during the discrimination phase, indicating that they discriminated C+1 and C+3 odorants from the odor of habituation. Thus, no group exhibited a deficit in discrimination at any time point. Behavioral data were acquired from four independent experiments. Numbers of animals per group (control, mMs, PBS, HuPFFs, and mPFFs, respectively) for 1-mo survival time point: 22, 26, 40, 37, and 29; 3-mo survival time point: 16, 21, 33, 35, and 23; 6-mo survival time point: 18, 19, 36, 35, and 21; and 12-mo survival time point: 8, 7, 27, 23, and 14. Habituation and discrimination were analyzed by one-way ANOVA with repeated measures. We then performed multiple comparisons by a Sidak post-hoc test. *, P = 0.05; **, P = 0.01; ***, P = 0.001 for difference from Hab1. ##, P = 0.01; ###, P = 0.001 for difference from Test Hab. Results of the ANOVAs and number of animals per group are provided in Table S4.
Figure 9.
Figure 9.
PFFs-injected mice exhibit a progressive alteration of odor detection. (A) Experimental design of the odor detection test. Mice were exposed to MO for three consecutive trials (habituation), and then to increased concentrations of propionic acid (AP; dilution factor, 10−6, 10−4, or 10−2) during three other trials. (B) Summary of the results of the odor detection test. Dots represent the odorant threshold detected (measured as the dilution factor used), for each animal group at 1, 3, 6, and 12 mo after injection. Whereas control-, PBS-, mMs-, and HuPFFs-injected mice show a low odor threshold (10−2) from 1 to 6 mo after injection; mice injected with mPFFs exhibit a strong deficit of odor detection appearing at 3 mo, with an odor detection threshold higher than the 10−2 dilution. (C) Odor detection results. All mice display habituation across the trials with the odor of habituation (OHab). Control, PBS-, mMs-, and HuPFFs-injected mice investigate significantly more the odorant at the lowest concentration compared with OHab, demonstrating that their odor detection threshold is 10−6. The mice injected with mPFFs show a mild deficit of odor retention already at 1 mo after injection. At 3 mo after injection, all mice except the mPFFs-injected mice detect the lowest concentration (10−6). From this time point, the mPFFs-injected mice exhibit a severe alteration of odor detection (unable to detect the higher concentration used here). The mean exploration time per trial was analyzed by one-way ANOVA with repeated measures across trials for each group and time point. Results of the ANOVAs are provided in Table S4. Behavioral data were acquired from four independent experiments. Number of animals per group (control, PBS, mMs, HuPFFs, and mPFFs, respectively) for 1-mo survival time point: 22, 26, 40, 37, and 29; 3-mo survival time point: 16, 21, 33, 35, and 23; 6-mo survival time point: 18, 19, 36, 35, and 21; and 12-mo survival time point: 8, 7, 27, 23, and 14. We then performed multiple comparisons by Sidak post-hoc tests (more conservative than Fisher LSD post-hoc test). *, P = 0.05; **, P = 0.01; ***, P = 0.001 for difference from MO1. #, P = 0.05; ##, P = 0.01; ###, P = 0.001 for difference from MO3.
Figure 10.
Figure 10.
Mice injected with PFFs develop a progressive alteration of odor retention. (A) Experimental design of the odor retention test. During the first trial (acquisition), mice were exposed to the same odor in two cartridges. After a delay of 6, 16, or 30 min, mice were exposed to the first odor (familiar odor) in one cartridge, and a new scent (novel odor) in the second cartridge during a second trial (recall). (B) Summary of the results of the odor retention test. Bar lengths represent the median duration of odor retention for each group. Control, PBS, and mMs groups show a slight decrease of retention time at 12 mo, which is an effect of normal aging. HuPFFs mice show a deficit of retention at 1 mo, which remains steady until it is exacerbated after 12 mo. mPFFs mice show severe shortening of odor retention already after 3 mo. (C) Odor retention results. Results are expressed as a preference for novel odor versus the familiar odor, at the 3 time points used. mMs mice display a preference for the novel odor above the chance level of 50% at 6, 16, and 30 min inter-trial delays, indicating that the mice could remember the familiar odorant for at least 30 min (retention time) at any time point. HuPFFs and mPFFs mice exhibit a retention time of only 16 min 1 mo after injection. mPFFs mice show a decrease in retention time (<6 min) 3 mo after injection, whereas HuPFFs mice show a further alteration of retention (to <6 min) only 12 mo after injection. Notably, after 3 mo, control and PBS groups show transient inability to recall the novel odor after 30 min, whereas groups injected with mMs perform well. This is probably a result of the relatively small sample sizes in the control and PBS groups. Behavioral data were acquired from four independent experiments. Number of animals per group (control, PBS, mMs, HuPFFs, and mPFFs, respectively) for 1-mo survival time: 22–24, 25–29, 40–42, 41, and 29–32; 3-mo survival time point: 20–21, 25, 36–39, 36–43, and 26–28; 6-mo survival time point: 15–18, 15–16, 33–34, 33–34, and 22–25; and 12-mo survival time point: 11, 8–9, 22–28, 21–23, and 12–14 (numbers vary depending on which retention delay is tested). Mean preference for the novel odor for each group during the recall trial was analyzed by one-sample Student’s t test compared with the chance level of 50% *, P < 0.05; **, P < 0.01; ***, P < 0.001.

Comment in

References

    1. Beach T.G., Adler C.H., Lue L., Sue L.I., Bachalakuri J., Henry-Watson J., Sasse J., Boyer S., Shirohi S., Brooks R., et al. Arizona Parkinson’s Disease Consortium . 2009. Unified staging system for Lewy body disorders: correlation with nigrostriatal degeneration, cognitive impairment and motor dysfunction. Acta Neuropathol. 117:613–634. 10.1007/s00401-009-0538-8 - DOI - PMC - PubMed
    1. Braak H., Del Tredici K., Rüb U., de Vos R.A.I., Jansen Steur E.N.H., and Braak E.. 2003a Staging of brain pathology related to sporadic Parkinson’s disease. Neurobiol. Aging. 24:197–211. 10.1016/S0197-4580(02)00065-9 - DOI - PubMed
    1. Braak H., Rüb U., Gai W.P., and Del Tredici K.. 2003b Idiopathic Parkinson’s disease: possible routes by which vulnerable neuronal types may be subject to neuroinvasion by an unknown pathogen. J Neural Transm (Vienna). 110:517–536. 10.1007/s00702-002-0808-2 - DOI - PubMed
    1. Braak H., Ghebremedhin E., Rüb U., Bratzke H., and Del Tredici K.. 2004. Stages in the development of Parkinson’s disease-related pathology. Cell Tissue Res. 318:121–134. 10.1007/s00441-004-0956-9 - DOI - PubMed
    1. Bruce M., Chree A., McConnell I., Foster J., Pearson G., and Fraser H.. 1994. Transmission of bovine spongiform encephalopathy and scrapie to mice: strain variation and the species barrier. Philos. Trans. R. Soc. Lond. B Biol. Sci. 343:405–411. 10.1098/rstb.1994.0036 - DOI - PubMed

Publication types

Substances