. 2016 Sep 15;197(6):2509-21.
doi: 10.4049/jimmunol.1502659. Epub 2016 Aug 8.

Immunotherapy Expands and Maintains the Function of High-Affinity Tumor-Infiltrating CD8 T Cells In Situ

Affiliations

Immunotherapy Expands and Maintains the Function of High-Affinity Tumor-Infiltrating CD8 T Cells In Situ

Amy E Moran et al. J Immunol. .

Abstract

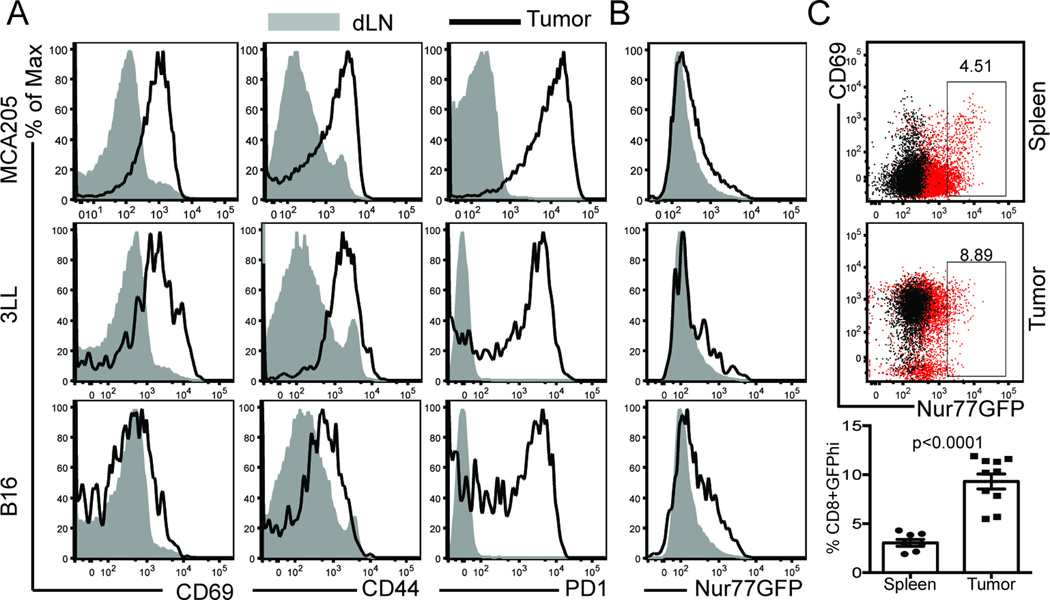
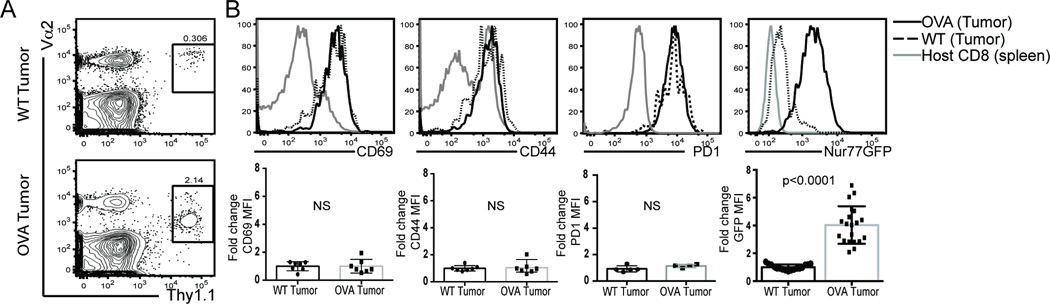
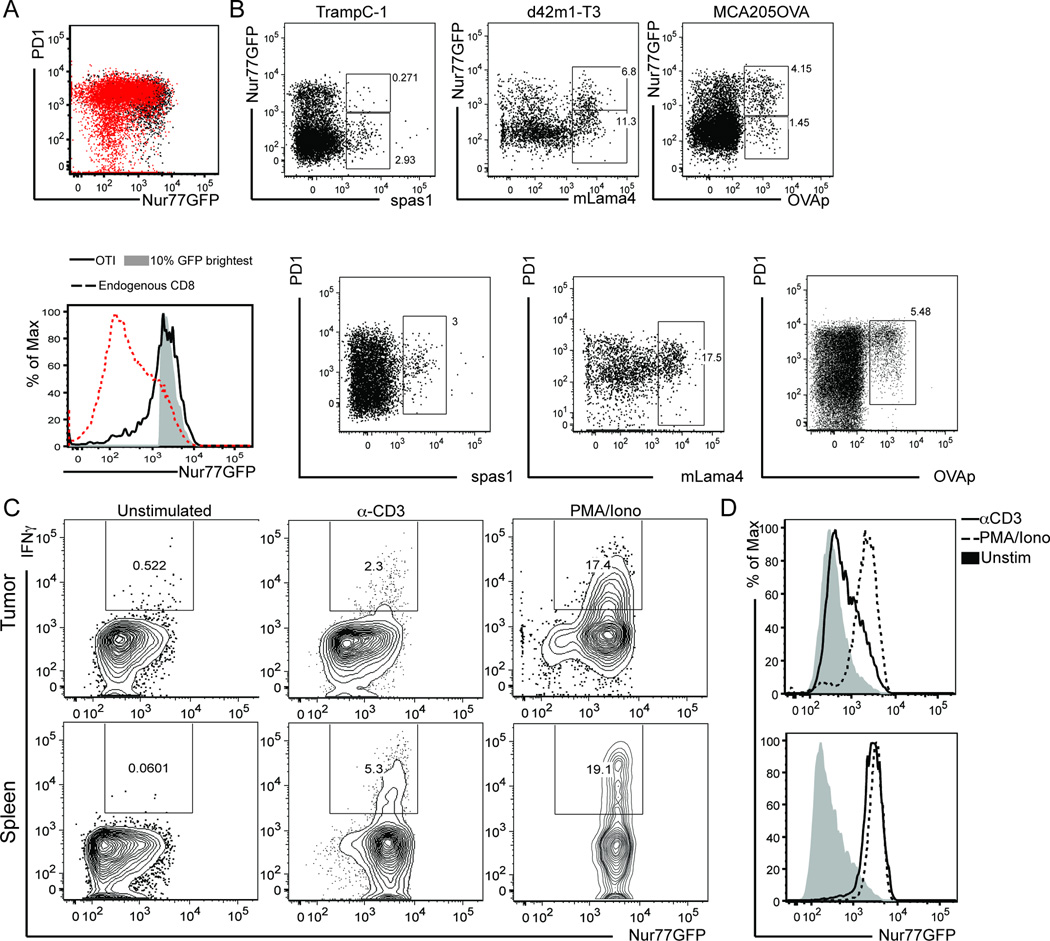
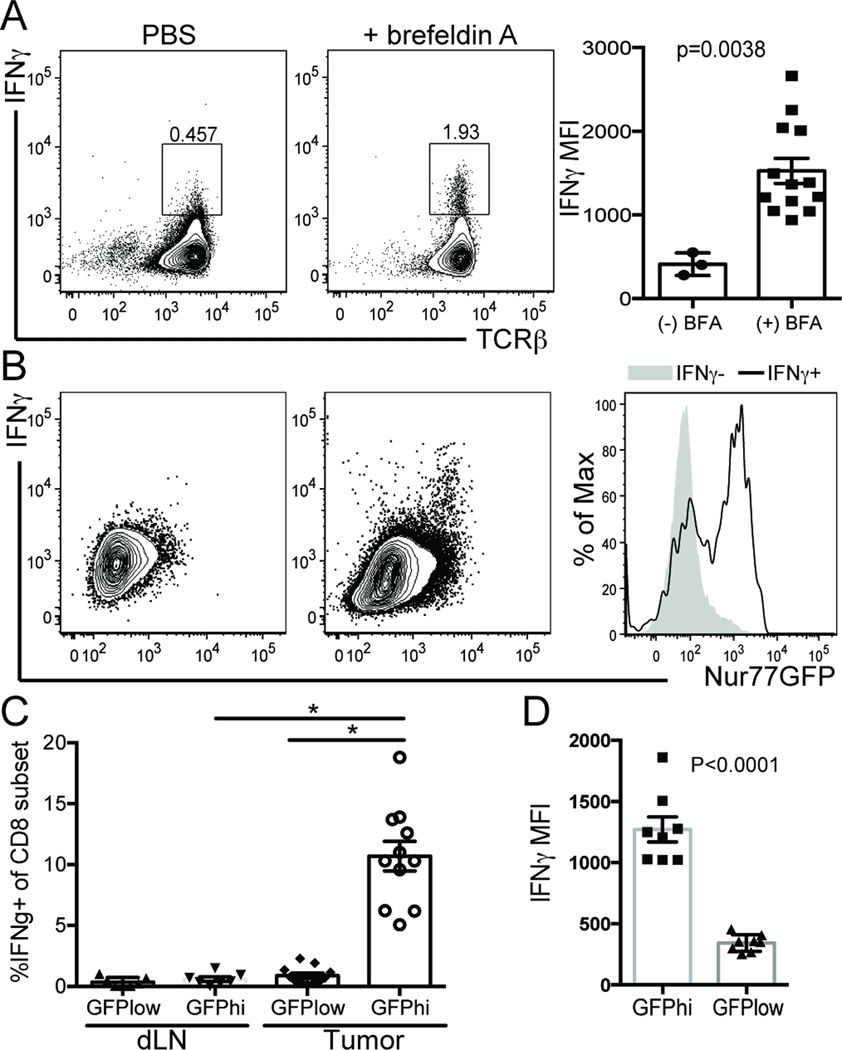
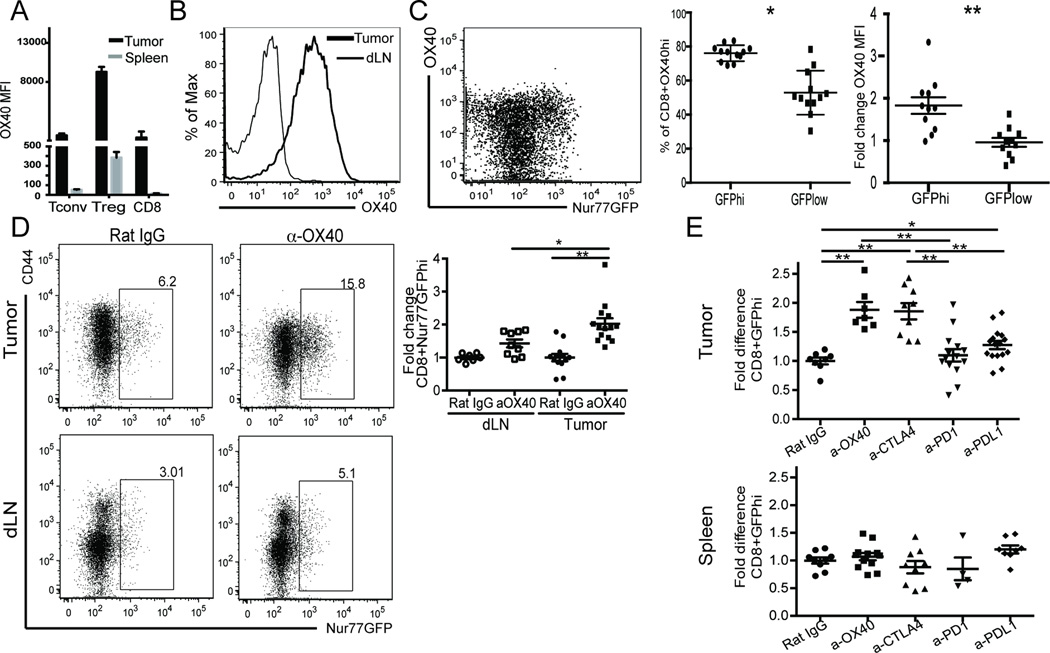
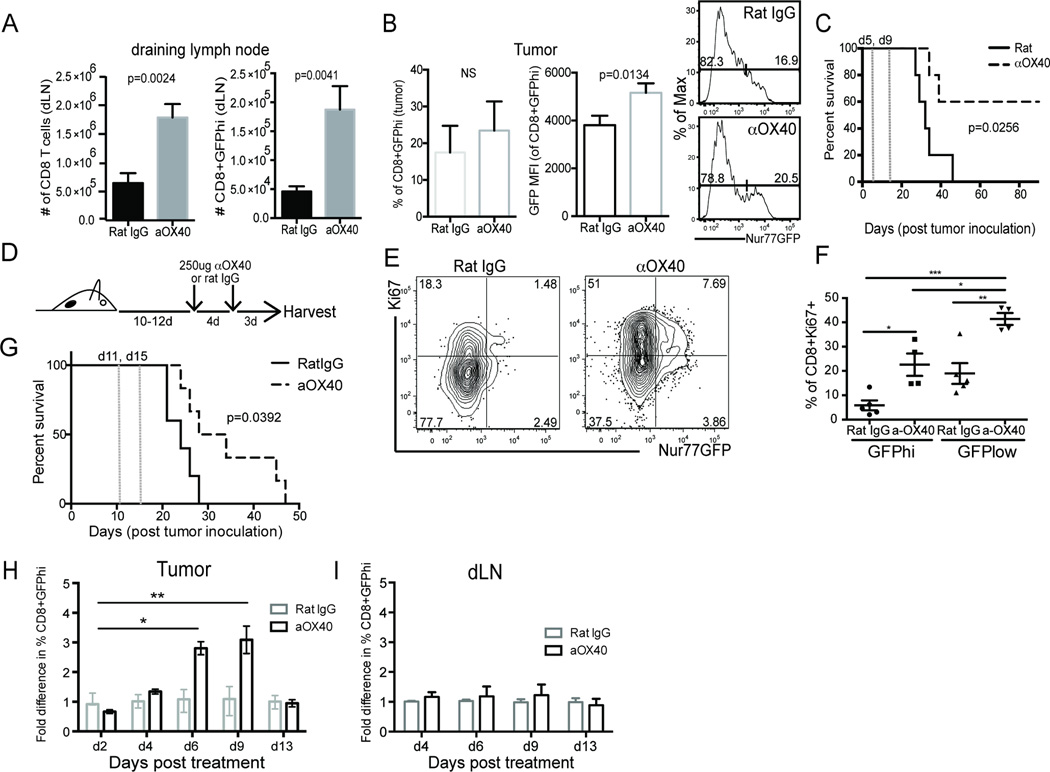
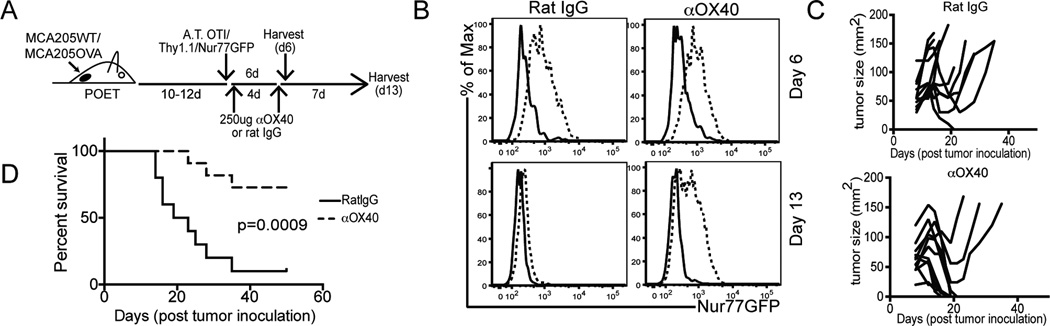
Cancer cells harbor high-affinity tumor-associated Ags capable of eliciting potent antitumor T cell responses, yet detecting these polyclonal T cells is challenging. Therefore, surrogate markers of T cell activation such as CD69, CD44, and programmed death-1 (PD-1) have been used. We report in this study that in mice, expression of activation markers including PD-1 is insufficient in the tumor microenvironment to identify tumor Ag-specific T cells. Using the Nur77GFP T cell affinity reporter mouse, we highlight that PD-1 expression can be induced independent of TCR ligation within the tumor. Given this, we characterized the utility of the Nur77GFP model system in elucidating mechanisms of action of immunotherapies independent of PD-1 expression. Coexpression of Nur77GFP and OX40 identifies a polyclonal population of high-affinity tumor-associated Ag-specific CD8(+) T cells, which produce more IFN-γ in situ than OX40 negative and doubles in quantity with anti-OX40 and anti-CTLA4 mAb therapy but not with anti-PD-1 or programmed death ligand-1. Moreover, expansion of these high-affinity CD8 T cells prolongs survival of tumor-bearing animals. Upon chronic stimulation in tumors and after adoptive cell therapy, CD8 TCR signaling and Nur77GFP induction is impaired, and tumors progress. However, this can be reversed and overall survival significantly enhanced after adoptive cell therapy with agonist OX40 immunotherapy. Therefore, we propose that OX40 agonist immunotherapy can maintain functional TCR signaling of chronically stimulated tumor-resident CD8 T cells, thereby increasing the frequency of cytotoxic, high-affinity, tumor-associated Ag-specific cells.


Figures

Figure 1
Figure 1. T cell activation markers within the tumor
A) Traditional markers of T cell activation were assessed on T cells from 3 different tumor models and paired draining lymph nodes 10–14 days after tumor inoculation on the hind flank. B) Nur77GFP expression on these same CD8 T cells was compared to activation molecule expression. C) Frequency of GFPhi CD8 T cells in spleen (top) versus tumor (bottom) of MCA205 tumor bearing mice. Data are representative of more than 6 experiments with n=3 animals per tumor model per experiment. Unpaired two-tailed Student’s t test was used for statistical analysis and mean with SEM is shown.
Figure 2
Figure 2. Tumor antigen specific upregulation of GFP
OVA tolerant POET mice were inoculated on the hind flanks with either MCA205 (WT) tumor cells or MCA205-OVA (OVA) expressing tumors. Ten days after tumor inoculation, OT-I/Thy1.1/Nur77GFP splenocytes were adoptively transferred into tumor bearing animals. A) Five days post adoptive transfer, OT-I T cells (identified by expression of Thy1.1 and their TCR alpha chain, Vα2) were isolated from the tumors. B) T cell activation markers were assessed on OT-I versus endogenous polyclonal CD8 T cells from WT (black dotted line, circles in bar graph) or OVA-expressing tumors (solid black line, squares in bar graph). Fold change was calculated from MFI of each activation marker on OTI T cells isolated from OVA expressing or WT tumors. Data are representative of 6 experiments with n=3–5 animals per treatment group per experiment. Unpaired two-tailed Student’s t test was used for statistical analysis and data represents mean with SD.
Figure 3
Figure 3. Tumor infiltrating CD8 T cells receive strong TCR signals
Nur77GFP mice were inoculated with A) MCA205-OVA expressing tumor cells on the hind flank. Once tumors were ~75mm2, 106 OT-I/Thy1.1/Nur77GFP T cells were adoptively transferred (AT). Six days after AT, OT-I T cells were recovered from the tumor and OT-I/GFP expression (black dot plot/solid black line) was compared to the total population of endogenous CD8+ T cells (dotted line) as well as to the brightest GFP+ CD8+ T cells (shaded histogram). Gated on live/TCRβ+/CD8+ for endogenous and live/TCRβ+/CD8+/Thy1.1+ for OT-I histograms. B) Animals were inoculated with TRAMPC-1, d42m1-T3, or MCA205OVA tumor cells in 100µL Matrigel on the hind flank. 5–7 days after inoculation, tumors were harvested and tumor antigen specific T cells identified by MHC I tetramers for known tumor antigens. GFP and PD1 expression was evaluated. C) At ~d14 after MCA205 tumor inoculation in Nur77GFP mice, bulk digested tumor (top) or splenocytes (bottom) were stimulated with anti-CD3 or PMA/Ionomycin for 4 hours before performing intracellular cytokine staining for IFNγ. D) Nur77GFP expression after stimulation in tumor vs spleen. Data shown is representative of 3 experiments with n=4 mice per experiment.
Figure 4
Figure 4. Nur77GFPhi CD8+ tumor infiltrating T cells make IFNγ
Nur77GFP mice were inoculated with MCA205 tumor cells on the hind flanks. ~12 days after tumor inoculation in situ IFNγ was assessed 6 hours after animals were injected with Brefeldin A or PBS alone. A) IFNγ production by T cells in tumor draining lymph nodes and B) tumor. The histogram overlays are representative of GFP expression from IFNγ- (shaded grey) and IFNγ+ (black line) populations of CD8 T cells. C) Percentage of IFNγ producing CD8 T cells in GFPhi vs GFPlow T cell subsets from tumor and dLN. D) IFNγ MFI in TCRβ+CD8+Nur77GFP subsets from the tumor. Data are representative of 3 experiments with n=3 animals per treatment group. Unpaired two-tailed Student’s t test was used for statistical analysis of two groups and graphed as mean with SEM. For more than two groups, a one-way ANOVA multiple comparisons analysis was used and *p≤0.0001.
Figure 5
Figure 5. OX40 immunotherapy expands high affinity CD8 T cells
A) CD4+Foxp3- (Tconv), CD4+Foxp3+ (Treg), and CD8 T cells from tumor and spleen of Foxp3RFP MCA205 tumor-bearing animals were isolated and OX40 MFI evaluated via flow cytometry. Gated on live/TCRβ+/. B) Expression of OX40 on CD8 T cells from the tumor (bold histogram) and spleen (thin histogram) of MCA205 tumor bearing animals. C) Expression of OX40 in Nur77GFP CD8+TIL. The bar graph shows the frequency of OX40+CD8+ within GFP subsets (left) and fold change in OX40 expression of CD8+GFPhi TIL to CD8+GFPlow subset of TIL (right) isolated from MCA205 bearing Nur77GFP mice. D) Nur77GFP MCA205 bearing animals were treated with 2 × 250µg αOX40 or rat IgG control when tumors were ~80mm2 in size. 7d after initiating treatment, TIL were isolated and fold increase in GFPhi T cells over rat IgG was determined. GFPhi gates were determined from a C57BL/6 control **p≤0.05, **p≤0.0001. E) MCA205 tumor bearing GFP mice were treated at day 10 post tumor inoculation with 2 × 250µg rat IgG, α-OX40, or α-CTLA4, or 3 × 200µg α-PD1 or α-PD-L1. All animals were harvested day 7 after therapy was started. Fold change in frequency of GFPhi CD8 T cells as compared to rat IgG control in tumor vs spleen. Data are representative of A-B) 3 experiments, n=4, C) more than 6 experiments n=3, D-E) 3 experiments n=3/group. For two-population comparison, student’s t-test was used and graphed as mean with SEM. Multiple populations were analyzed using one way multiple comparisons ANOVA *p≤0.01, ** p≤0.0001.
Figure 6
Figure 6. Expansion of GFPhi TIL after anti-OX40 immunotherapy enhances anti-tumor immunity
A-B) Nur77GFP MCA205 tumor-bearing mice were treated on days 5 and 9 after tumor inoculation with 2 doses of 250µg α−OX40 or control rat IgG. On day 10, one cohort of animals was euthanized and tumor and draining lymph nodes (dLN) were harvested, counted, and stained for flow cytometry analysis of GFP expression. C) The second cohort was monitored for long-term survival. Dotted vertical lines represent when animals were treated with immunotherapy. Data is representative of at least 2 independent experiments. D) Experimental design for E-G. E-F) Day 7 after 2 × 250µg of α-OX40 or rat IgG animals were euthanized, tumors harvested, cells fixed and intracellular staining performed for proliferation analysis. Data are representative of mean percentage of CD8+Ki67+ cells from each of 4 independent experiments. One way multiple comparison ANOVA was used for statistical analysis with * p≤0.05, **p≤0.01, ***p≤0.0001. G) Survival of rat IgG (solid line) and αOX40 treated (dotted line) MCA205 tumor bearing animals treated according to the experimental design in D). Dotted vertical lines represent when animals were treated with immunotherapy. Log Rank (Mantel Cox) test was used for statistical analysis. H) Fold change of percent GFPhi CD8 T cells in the tumor or I) draining LN (dLN) after a single dose of α-OX40 or rat IgG antibody given at day 10 after tumor inoculation. Median fold change in %CD8+GFPhi T cells is graphed with SEM indicated. Data was compiled from 3 independent experiments in which GFPhi frequency for OX40 treated animals was determined by first gating through live/TCRβ+/CD8+/OX40dim T cells or through live/TCRβ+/CD8+ for rat IgG treated animals *p≤0.001, **p≤0.0001.
Figure 7
Figure 7. anti-OX40 immunotherapy maintains Nur77GFP induction on tumor antigen-specific T cells
OVA tolerant POET mice were inoculated on the hind flank with either MCA205 WT or MCA205 OVA tumors and treated according to the experimental design in A). The first cohort of animals was analyzed at B) day 6 (top row) after adoptive transfer and the second (bottom row) at day 13 after adoptive transfer. Expression of Nur77GFP is indicated on live/TCRβ+/CD8+/Thy1.1+ T cells from the tumor. An independent cohort of animals were treated according to A) and monitored for long-term survival. C) spider plots and D) survival curves are shown for these animals. Data are representative of 3 independent experiments with a minimum of n=5 animals per tumor model and treatment group.

Similar articles

Cited by

References

    1. Zehn D, Lee SY, Bevan MJ. Complete but curtailed T-cell response to very low-affinity antigen. Nature. 2009;458:211–214. - PMC - PubMed
    1. Schumacher TN, Schreiber RD. Neoantigens in cancer immunotherapy. Science. 2015;348:69–74. - PubMed
    1. Gubin MM, Zhang X, Schuster H, Caron E, Ward JP, Noguchi T, Ivanova Y, Hundal J, Arthur CD, Krebber WJ, Mulder GE, Toebes M, Vesely MD, Lam SS, Korman AJ, Allison JP, Freeman GJ, Sharpe AH, Pearce EL, Schumacher TN, Aebersold R, Rammensee HG, Melief CJ, Mardis ER, Gillanders WE, Artyomov MN, Schreiber RD. Checkpoint blockade cancer immunotherapy targets tumour-specific mutant antigens. Nature. 2014;515:577–581. - PMC - PubMed
    1. Kreiter S, Vormehr M, van de Roemer N, Diken M, Lower M, Diekmann J, Boegel S, Schrors B, Vascotto F, Castle JC, Tadmor AD, Schoenberger SP, Huber C, Tureci O, Sahin U. Mutant MHC class II epitopes drive therapeutic immune responses to cancer. Nature. 2015;520:692–696. - PMC - PubMed
    1. Coulie PG, Lehmann F, Lethe B, Herman J, Lurquin C, Andrawiss M, Boon T. A mutated intron sequence codes for an antigenic peptide recognized by cytolytic T lymphocytes on a human melanoma. Proceedings of the National Academy of Sciences of the United States of America. 1995;92:7976–7980. - PMC - PubMed

Publication types

MeSH terms