

Comparative Large-Scale Mitogenomics Evidences Clade-Specific Evolutionary Trends in Mitochondrial DNAs of Bivalvia
- PMID: 27503296
- PMCID: PMC5010914
- DOI: 10.1093/gbe/evw187
Comparative Large-Scale Mitogenomics Evidences Clade-Specific Evolutionary Trends in Mitochondrial DNAs of Bivalvia
Abstract
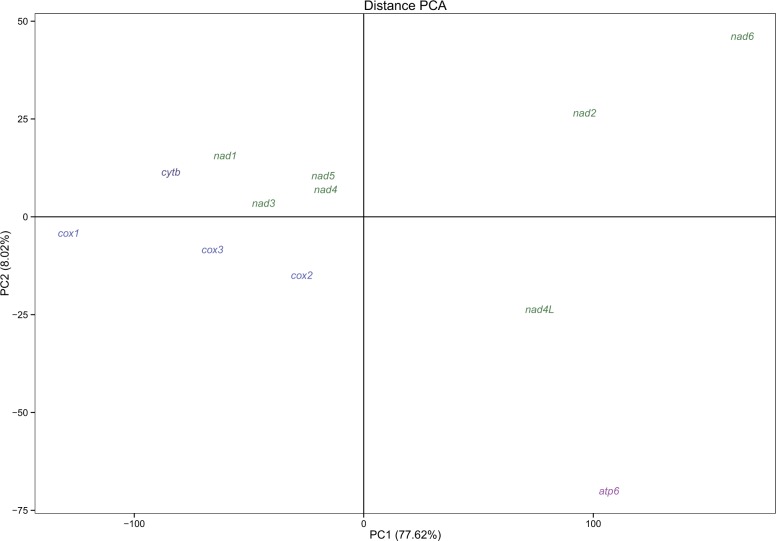
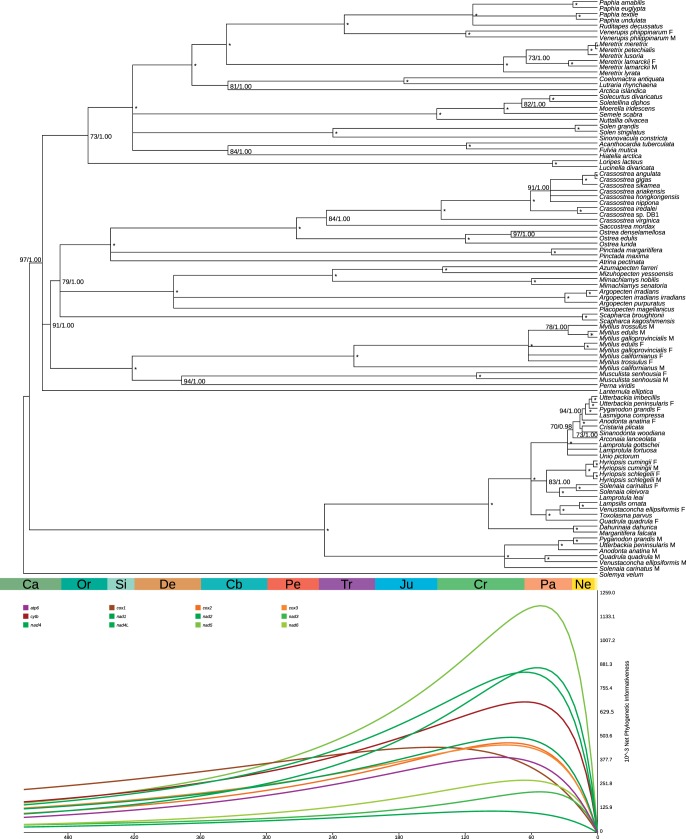
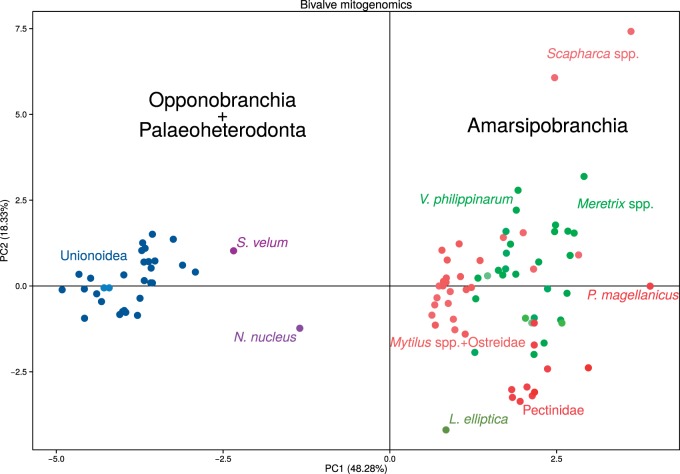
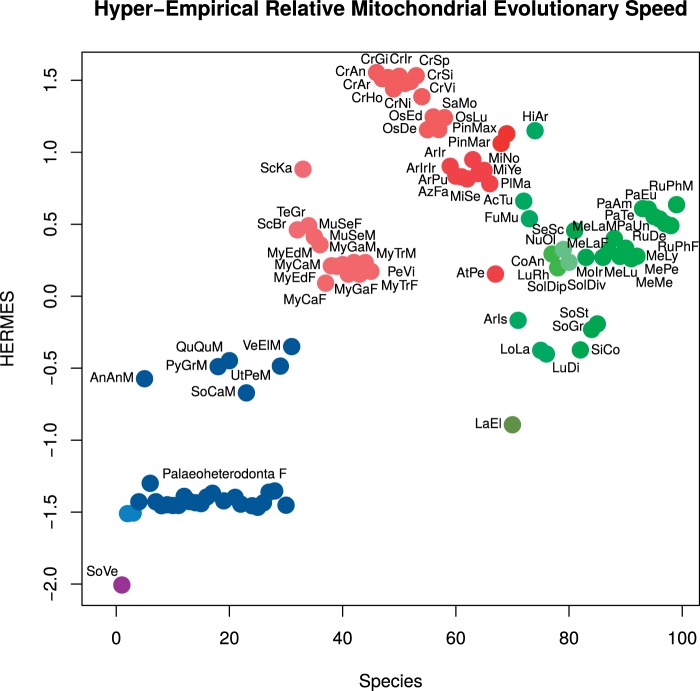
Despite the figure of complete bivalve mitochondrial genomes keeps growing, an assessment of the general features of these genomes in a phylogenetic framework is still lacking, despite the fact that bivalve mitochondrial genomes are unusual under different aspects. In this work, we constructed a dataset of one hundred mitochondrial genomes of bivalves to perform the first systematic comparative mitogenomic analysis, developing a phylogenetic background to scaffold the evolutionary history of the class' mitochondrial genomes. Highly conserved domains were identified in all protein coding genes; however, four genes (namely, atp6, nad2, nad4L, and nad6) were found to be very divergent for many respects, notwithstanding the overall purifying selection working on those genomes. Moreover, the atp8 gene was newly annotated in 20 mitochondrial genomes, where it was previously declared as lacking or only signaled. Supernumerary mitochondrial proteins were compared, but it was possible to find homologies only among strictly related species. The rearrangement rate on the molecule is too high to be used as a phylogenetic marker, but here we demonstrate for the first time in mollusks that there is correlation between rearrangement rates and evolutionary rates. We also developed a new index (HERMES) to estimate the amount of mitochondrial evolution. Many genomic features are phylogenetically congruent and this allowed us to highlight three main phases in bivalve history: the origin, the branching of palaeoheterodonts, and the second radiation leading to the present-day biodiversity.
Keywords: HERMES; bivalves; comparative mitogenomics; mitochondrial genomics; phylogeny.
© The Author 2016. Published by Oxford University Press on behalf of the Society for Molecular Biology and Evolution.
Figures
Similar articles
-
[Comparison of mitochondrial genomes of bivalves].Yi Chuan. 2009 Nov;31(11):1127-34. doi: 10.3724/sp.j.1005.2009.01127. Yi Chuan. 2009. PMID: 19933094 Chinese.
-
Updated mitochondrial phylogeny of Pteriomorph and Heterodont Bivalvia, including deep-sea chemosymbiotic Bathymodiolus mussels, vesicomyid clams and the thyasirid clam Conchocele cf. bisecta.Mar Genomics. 2017 Feb;31:43-52. doi: 10.1016/j.margen.2016.09.003. Epub 2016 Oct 6. Mar Genomics. 2017. PMID: 27720682
-
Mitochondrial phylogenomics of the Bivalvia (Mollusca): searching for the origin and mitogenomic correlates of doubly uniparental inheritance of mtDNA.BMC Evol Biol. 2010 Feb 18;10:50. doi: 10.1186/1471-2148-10-50. BMC Evol Biol. 2010. PMID: 20167078 Free PMC article.
-
Comparative mitogenomic analysis of the superfamily Tellinoidea (Mollusca: Bivalvia): Insights into the evolution of the gene rearrangements.Comp Biochem Physiol Part D Genomics Proteomics. 2020 Dec;36:100739. doi: 10.1016/j.cbd.2020.100739. Epub 2020 Sep 1. Comp Biochem Physiol Part D Genomics Proteomics. 2020. PMID: 32932163
-
First complete female mitochondrial genome in four bivalve species genus Donax and their phylogenetic relationships within the Veneroida order.PLoS One. 2017 Sep 8;12(9):e0184464. doi: 10.1371/journal.pone.0184464. eCollection 2017. PLoS One. 2017. PMID: 28886105 Free PMC article.
Cited by
-
Comparative analyses of the complete mitochondrial genomes of Dosinia clams and their phylogenetic position within Veneridae.PLoS One. 2018 May 2;13(5):e0196466. doi: 10.1371/journal.pone.0196466. eCollection 2018. PLoS One. 2018. PMID: 29718949 Free PMC article.
-
SmithRNAs: Could Mitochondria "Bend" Nuclear Regulation?Mol Biol Evol. 2017 Aug 1;34(8):1960-1973. doi: 10.1093/molbev/msx140. Mol Biol Evol. 2017. PMID: 28444389 Free PMC article.
-
Comparative mitogenomics of the Decapoda reveals evolutionary heterogeneity in architecture and composition.Sci Rep. 2019 Jul 24;9(1):10756. doi: 10.1038/s41598-019-47145-0. Sci Rep. 2019. PMID: 31341205 Free PMC article.
-
Complex mitogenomic rearrangements within the Pectinidae (Mollusca: Bivalvia).BMC Ecol Evol. 2022 Mar 10;22(1):29. doi: 10.1186/s12862-022-01976-0. BMC Ecol Evol. 2022. PMID: 35272625 Free PMC article.
-
Complete mitochondrial genome of freshwater pearl mussel Lamellidens marginalis (Lamarck, 1819) and its phylogenetic relation within unionidae family.Mol Biol Rep. 2022 Oct;49(10):9593-9603. doi: 10.1007/s11033-022-07857-5. Epub 2022 Aug 21. Mol Biol Rep. 2022. PMID: 35988099
References
Publication types
MeSH terms
Substances
LinkOut - more resources
Full Text Sources
Other Literature Sources
