. 2016 Aug 8;15(1):83.
doi: 10.1186/s12940-016-0167-3.

Heat stroke admissions during heat waves in 1,916 US counties for the period from 1999 to 2010 and their effect modifiers

Affiliations

Heat stroke admissions during heat waves in 1,916 US counties for the period from 1999 to 2010 and their effect modifiers

Yan Wang et al. Environ Health. .

Abstract

Background: Heat stroke is a serious heat-related illness, especially among older adults. However, little is known regarding the spatiotemporal variation of heat stroke admissions during heat waves and what factors modify the adverse effects.

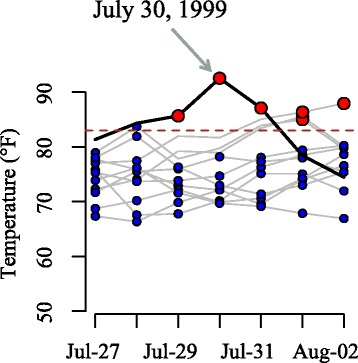
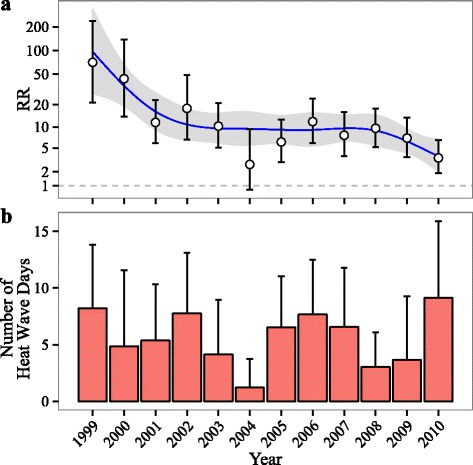
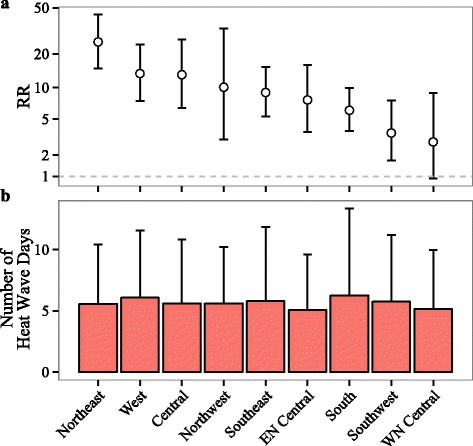
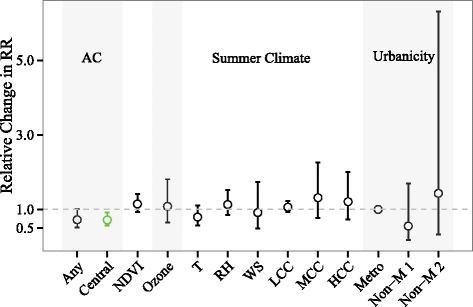
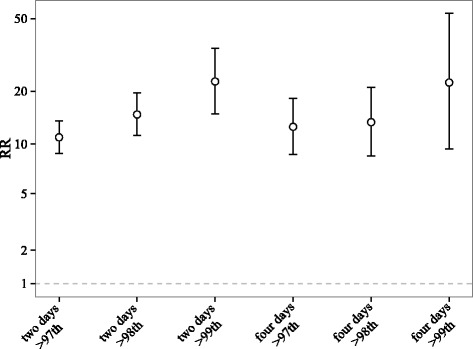
Methods: We conducted a large-scale national study among 23.5 million Medicare fee-for-service beneficiaries per year residing in 1,916 US counties during 1999-2010. Heat wave days, defined as a period of at least two consecutive days with temperatures exceeding the 97th percentile of that county's temperatures, were matched to non-heat wave days by county and week. We fitted random-effects Poisson regression models to estimate the relative risk (RR) of heat stroke admissions on a heat wave day as compared to a matched non-heat wave day. A variety of effect modifiers were tested including individual-level covariates, community-level covariates, meteorological conditions, and the intensity and duration of the heat wave event.

Results: The RR declined substantially from 71.0 (21.3-236.2) in 1999 to 3.5 (1.9-6.5) in 2010, and was highest in the northeast and lowest in the west north central regions of the US. We found a lower RR among counties with higher central air conditioning (AC) prevalence. More severe and longer-lasting heat waves had higher RRs.

Conclusions: Heat stroke hospitalizations associated with heat waves declined dramatically over time, indicating increased resilience to extreme heat among older adults. Considerable risks, however, still remain through 2010, which could be addressed through public health interventions at a regional scale to further increase central AC and monitoring heat waves.

Keywords: Effect modification; Heat stroke; Heat wave; Medicare beneficiaries; Spatiotemporal variation.


Figures

Fig. 1
Fig. 1
An example illustrating how control days were matched to heat wave days. July 30, 1999 was a heat wave day in Chicago. Five candidate control days occurred in the same county and same week of the year as this heat wave day. One of them was randomly selected and matched with the heat wave day
Fig. 2
Fig. 2
Temporal trend of (a) the relative risk (RR) of heat stroke on heat wave days compared to matched control days and (b) the average number of heat wave days per county per year over 1999–2010 (the error bars represent one standard deviation). The smoothed trends for the RR were estimated by natural splines with five degrees of freedom. The models controlled for indicator variables for day of the week. The RR (e.g. RR = x) should be interpreted as the risk of heat stroke admissions on heat wave days was x times the risk on matched non-heat wave days
Fig. 3
Fig. 3
Spatial variation of (a) the relative risk (RR) of heat stroke on heat wave days compared to matched control days, and (b) the average number of heat wave days per county per year across the climate regions (the error bars represent one standard deviation). The model controlled for indicator variables of year and day of the week
Fig. 4
Fig. 4
Relative change in the relative risk (RR) of heat stroke on heat wave days compared to matched non-heat wave days associated with changes in county-level covariates: AC prevalence (any and central AC, per 10 % increase), mean summer NDVI (per 0.1 increase), mean ozone concentration (per 10 ppb increase), summer climate [temperature (T): per 10 °F; RH: per 10 %; wind speed (WS): per 0.5 km h−1 increase; low cloud cover (LCC), medium cloud cover (MCC), high cloud cover (HCC): per 5 %], and urbanicity [metropolitan (Metro); non-metropolitan with population >20,000 (Non-M 1); non-metropolitan with population < 20,000 (Non-M 2)]. Estimates and error bars in green indicate modifiers that decrease the RR and whose confidence intervals exclude one. The models include both random slopes and random intercepts. The y-axis represents the ratio of the RR per the specified increase in each modifier, obtained as the exponent of the coefficient for the interaction term between the heat wave day indicator variable and the covariate
Fig. 5
Fig. 5
The relative risk (RR) of heat stroke on heat wave days as compared with matched control days by definition of a heat wave event. The definitions of heat wave are temperature >97th, 98th, or 99th percentile for at least two or four consecutive days

References

    1. Ye X, Wolff R, Yu W, Vaneckova P, Pan X, Tong S. Ambient temperature and morbidity: a review of epidemiological evidence. Environ Health Perspect. 2012;120(1):19–28. doi: 10.1289/ehp.1003198. - DOI - PMC - PubMed
    1. Bobb JF, Obermeyer Z, Wang Y, Dominici F. Cause-specific risk of hospital admission related to extreme heat in older adults. Jama. 2014;312(24):2659–2667. doi: 10.1001/jama.2014.15715. - DOI - PMC - PubMed
    1. Semenza JC, McCullough JE, Flanders WD, McGeehin MA, Lumpkin JR. Excess hospital admissions during the July 1995 heat wave in Chicago. Am J Prev Med. 1999;16(4):269–277. doi: 10.1016/S0749-3797(99)00025-2. - DOI - PubMed
    1. Huang C, Barnett AG, Wang X, Vaneckova P, FitzGerald G, Tong S. Projecting future heat-related mortality under climate change scenarios: a systematic review. Environ Health Perspect. 2011;119(12):1681–1690. doi: 10.1289/ehp.1103456. - DOI - PMC - PubMed
    1. Matthies F, Menne B. Prevention and management of health hazards related to heatwaves. Int J Circumpolar Health. 2009;68(1):8–22. doi: 10.3402/ijch.v68i1.18293. - DOI - PubMed

Publication types