. 2016 Dec;39(12):1847-1858.
doi: 10.1007/s00449-016-1659-9. Epub 2016 Aug 8.

Comparability of automated human induced pluripotent stem cell culture: a pilot study

Affiliations

Comparability of automated human induced pluripotent stem cell culture: a pilot study

Peter R T Archibald et al. Bioprocess Biosyst Eng. 2016 Dec.

Abstract

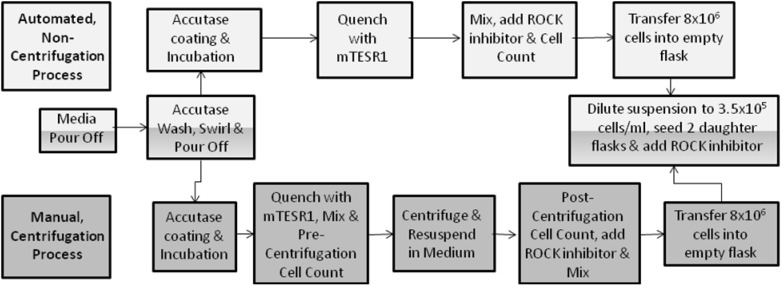
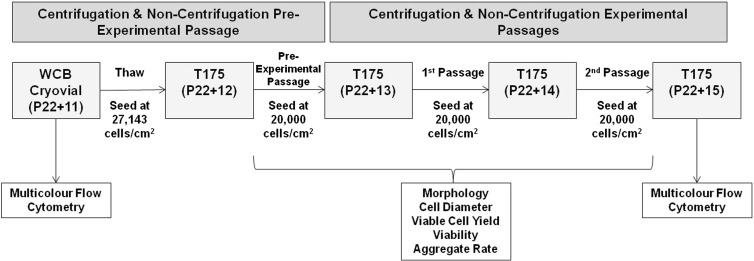
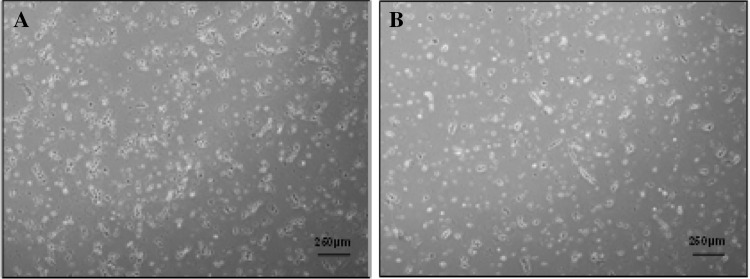
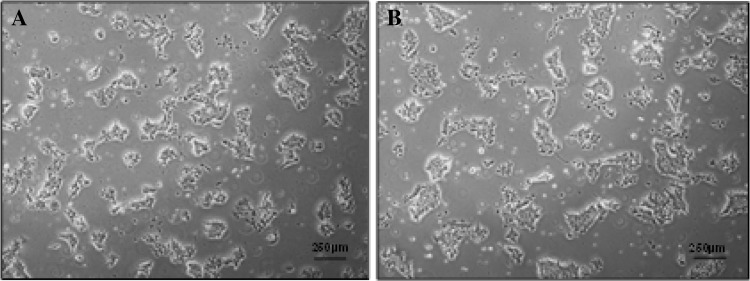
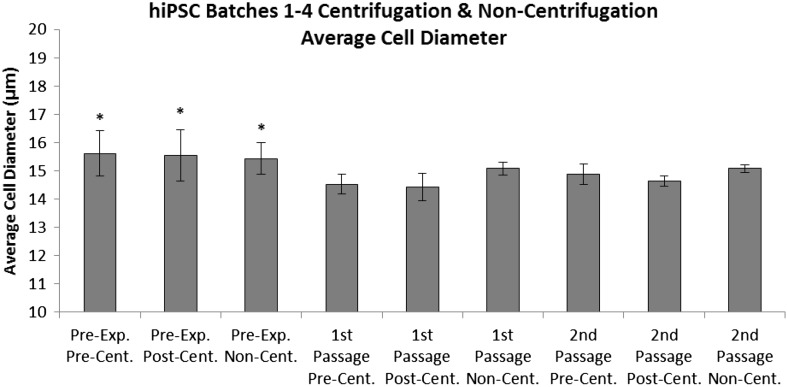
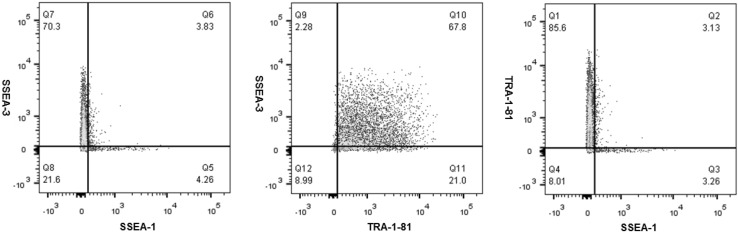
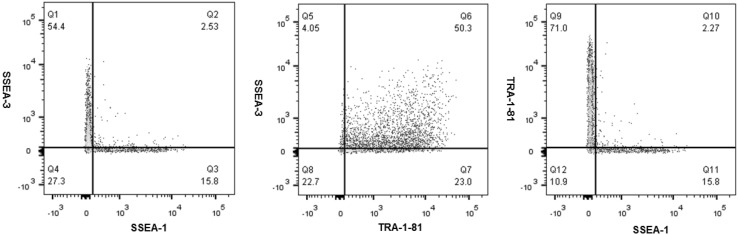
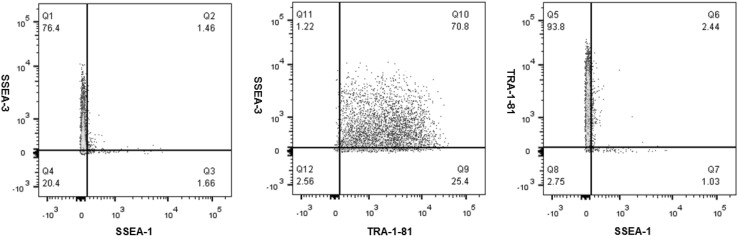
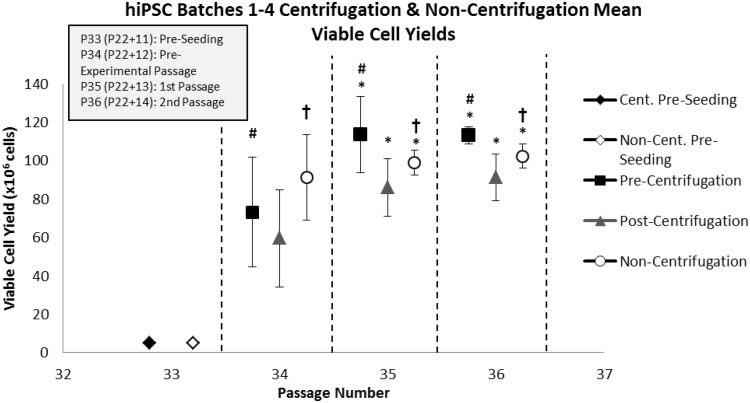
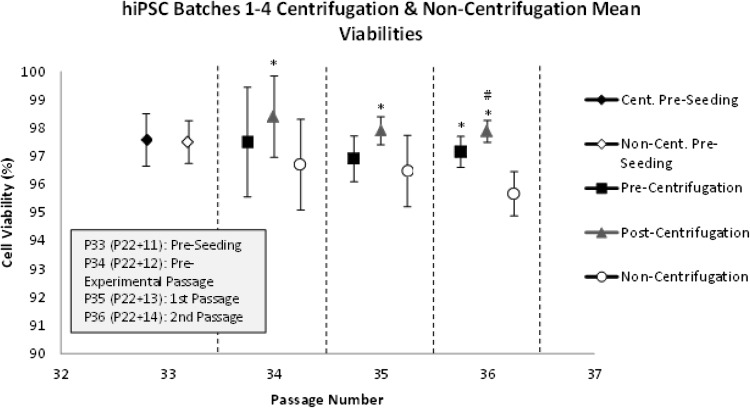
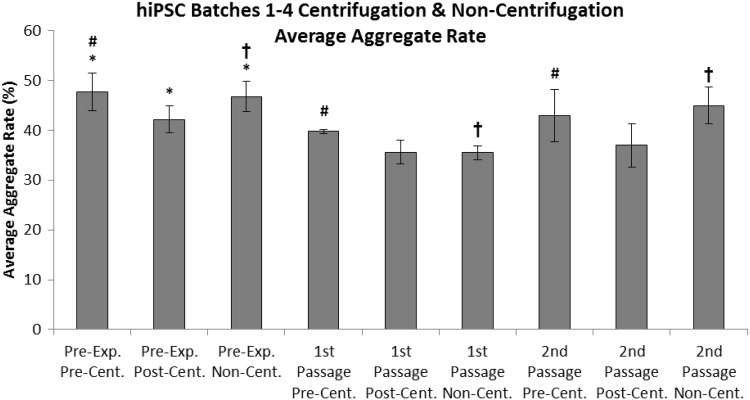
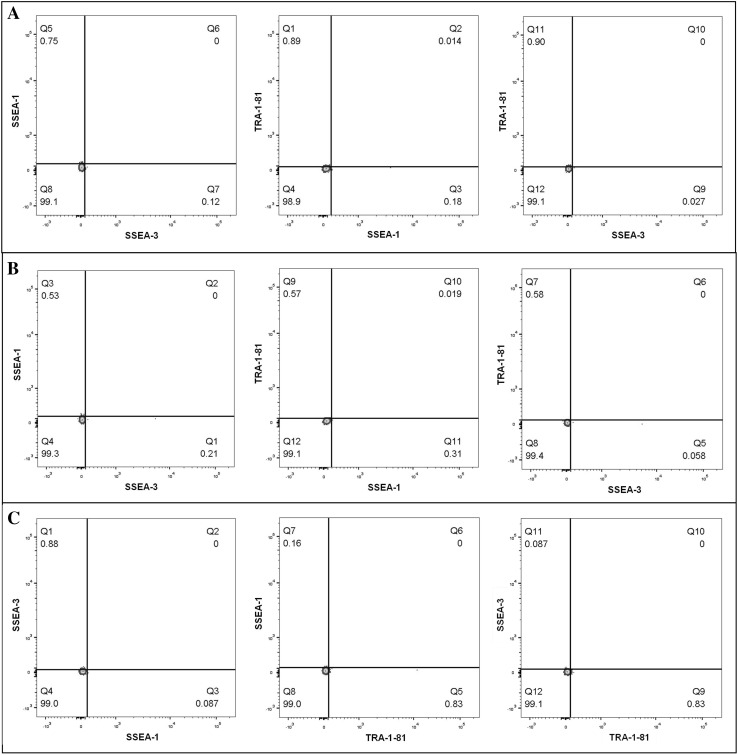
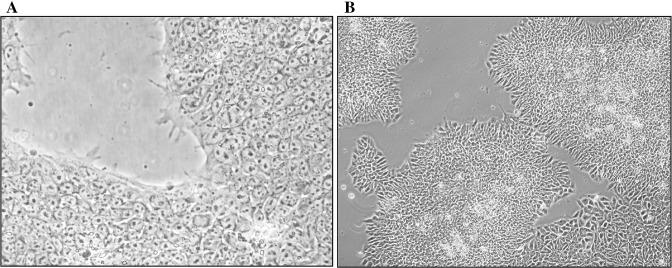
Consistent and robust manufacturing is essential for the translation of cell therapies, and the utilisation automation throughout the manufacturing process may allow for improvements in quality control, scalability, reproducibility and economics of the process. The aim of this study was to measure and establish the comparability between alternative process steps for the culture of hiPSCs. Consequently, the effects of manual centrifugation and automated non-centrifugation process steps, performed using TAP Biosystems' CompacT SelecT automated cell culture platform, upon the culture of a human induced pluripotent stem cell (hiPSC) line (VAX001024c07) were compared. This study, has demonstrated that comparable morphologies and cell diameters were observed in hiPSCs cultured using either manual or automated process steps. However, non-centrifugation hiPSC populations exhibited greater cell yields, greater aggregate rates, increased pluripotency marker expression, and decreased differentiation marker expression compared to centrifugation hiPSCs. A trend for decreased variability in cell yield was also observed after the utilisation of the automated process step. This study also highlights the detrimental effect of the cryopreservation and thawing processes upon the growth and characteristics of hiPSC cultures, and demonstrates that automated hiPSC manufacturing protocols can be successfully transferred between independent laboratories.

Keywords: Automation; Centrifugation; Characterisation; Comparability; Pluripotent stem cell; Scalable.


Conflict of interest statement

This research, in which TAP Biosystems’ CompacT SelecT automated cell culture platform was utilised, was funded by TAP Biosystems as well as Loughborough University and the Engineering and Physical Sciences Research Council (EPSRC). Neither Loughborough University, as a funding body, nor the EPSRC were involved in the preparation of this publication. However, Dave Thomas, Product Manager at TAP Biosystems, advised on study design and data interpretation, in addition to providing research supervision for this work by acting as an industrial supervisor. The terms of this arrangement have been reviewed and approved by Loughborough University.

Figures

Fig. 1
Fig. 1
Process diagram illustrating the differences between the CompacT SelecT manual (centrifugation) and automated (non-centrifugation) hiPSC culture process steps
Fig. 2
Fig. 2
TAP Biosystems’ CompacT SelecT automated cell culture platform (TAP Biosystems, Part of the Sartorius Stedim Biotech Group, Royston, UK)
Fig. 3
Fig. 3
Process diagram describing the pre-experimental and experimental centrifugation and non-centrifugation passages. WCB working cell bank
Fig. 4
Fig. 4
hiPSC batch 3 post-centrifugation (Ce) (a) and non-centrifugation (NC) (b) Day 1 Morphology
Fig. 5
Fig. 5
hiPSC batch 3 post-centrifugation (Ce) (a) and non-centrifugation (NC) (b) Day 4 Morphology
Fig. 6
Fig. 6
The average cell diameter of pre-centrifugation, post-centrifugation and non-centrifugation hiPSCs from all four batches and over the pre-experimental [replicates (n) = 4], 1st [replicates (n) = 4], and 2nd passages [replicates (n) = 6]. Standard deviations are plotted as error bars. Asterisk (*) denotes significance over 1st and 2nd passages (p = 0.05)
Fig. 7
Fig. 7
Scatter plots demonstrating multicolour flow cytometric analysis of pluripotency and differentiation marker co-expression of baseline hiPSCs from the working cell bank (P22 + 11)
Fig. 8
Fig. 8
Scatter plots demonstrating multicolour flow cytometric analysis of pluripotency and differentiation marker co-expression of centrifugation hiPSCs (P22 + 15)
Fig. 9
Fig. 9
Scatter plots demonstrating multicolour flow cytometric analysis of pluripotency and differentiation marker co-expression of non-centrifugation hiPSCs (P22 + 15)
Fig. 10
Fig. 10
The average pre-centrifugation, post-centrifugation and non-centrifugation viable hiPSC yield per flask over the pre-experimental (P34/P22 + 12) [replicates (n) = 4], 1st (P35/P22 + 13) [replicates (n) = 4], and 2nd (P36/P22 + 14) [replicates (n) = 6] passages, and across four batches. Standard deviations are plotted as error bars. Asterisk (*) denotes significance over pre-experimental passage (p = 0.05). Number sign (#) denotes significance of pre-centrifugation hiPSCs over post-centrifugation hiPSCs over all passages (p = 0.05). Dagger symbol (†) denotes significance of non-centrifugation hiPSCs over post-centrifugation hiPSCs over all passages (p = 0.05)
Fig. 11
Fig. 11
The mean viability of pre-centrifugation, post-centrifugation and non-centrifugation hiPSC samples over the pre-experimental (P34/P22 + 12) [replicates (n) = 4], 1st (P35/P22 + 13) [replicates (n) = 4], and 2nd (P36/P22 + 14) [replicates (n) = 6] passages, and across four batches. Standard deviations are plotted as error bars. Asterisk (*) denotes significance over non-centrifugation hiPSCs (p = 0.05). Number sign (#) denotes significance over pre-centrifugation hiPSCs in the 2nd passage (p = 0.05)
Fig. 12
Fig. 12
Average aggregate rate from pre-, post- and non-centrifugation hiPSC counts from all four batches over the pre-experimental (P34/P22 + 12) [replicates (n) = 4], 1st (P35/P22 + 13) [replicates (n) = 4], and 2nd (P36/P22 + 14) [replicates (n) = 6] passages. Standard deviations are plotted as error bars. Asterisk (*) denotes significance of pre-experimental passage over 1st and 2nd passages (p = 0.05). Number sign (#) denotes significance of pre-centrifugation hiPSCs over post-centrifugation hiPSCs (p = 0.05). Dagger symbol (†) denotes significance of non-centrifugation hiPSCs over post-centrifugation hiPSCs (p = 0.05)
Fig. 13
Fig. 13
a Top, b middle and c bottom. Baseline (a), centrifugation (b) and non-centrifugation (c) hiPSC isotype control multicolour flow cytometry scatter plots
Fig. 14
Fig. 14
a Left and b right. Exemplar images of a non-centrifugation (a) and post-centrifugation (b) hiPSC culture visualised under high magnification

References

    1. Takahashi K, Yamanaka S. Induction of pluripotent stem cells from mouse embryonic and adult fibroblast cultures by defined factors. Cell. 2006;126(4):663–676. doi: 10.1016/j.cell.2006.07.024. - DOI - PubMed
    1. Archer R, Williams DJ. Why tissue engineering needs process engineering. Nat Biotechnol. 2005;23(11):1353–1355. doi: 10.1038/nbt1105-1353. - DOI - PubMed
    1. Veraitch FS, Scott R, Wong JW, Lye GJ, Mason C. The impact of manual processing on the expansion and directed differentiation of embryonic stem cells. Biotechnol Bioeng. 2008;99(5):1216–1229. doi: 10.1002/bit.21673. - DOI - PubMed
    1. Archibald PRT, Chandra A, Thomas D, Morley G, Lekishvili T, Devonshire A, Williams DJ. Comparability of scalable, automated hMSC culture using manual and automated process steps. Biochem Eng J. 2016;108:69–83. doi: 10.1016/j.bej.2015.07.001. - DOI
    1. Thomas RJ, Anderson D, Chandra A, Smith NM, Young LE, Williams DJ, Denning C. Automated, scalable culture of human embryonic stem cells in feeder-free conditions. Biotechnol Bioeng. 2009;102(6):1636–1644. doi: 10.1002/bit.22187. - DOI - PubMed

MeSH terms

Substances

LinkOut - more resources