. 2016 Oct;172(2):968-979.
doi: 10.1104/pp.16.00840. Epub 2016 Aug 8.

Chronic Iron Limitation Confers Transient Resistance to Oxidative Stress in Marine Diatoms

Affiliations

Chronic Iron Limitation Confers Transient Resistance to Oxidative Stress in Marine Diatoms

Shiri Graff van Creveld et al. Plant Physiol. 2016 Oct.

Abstract

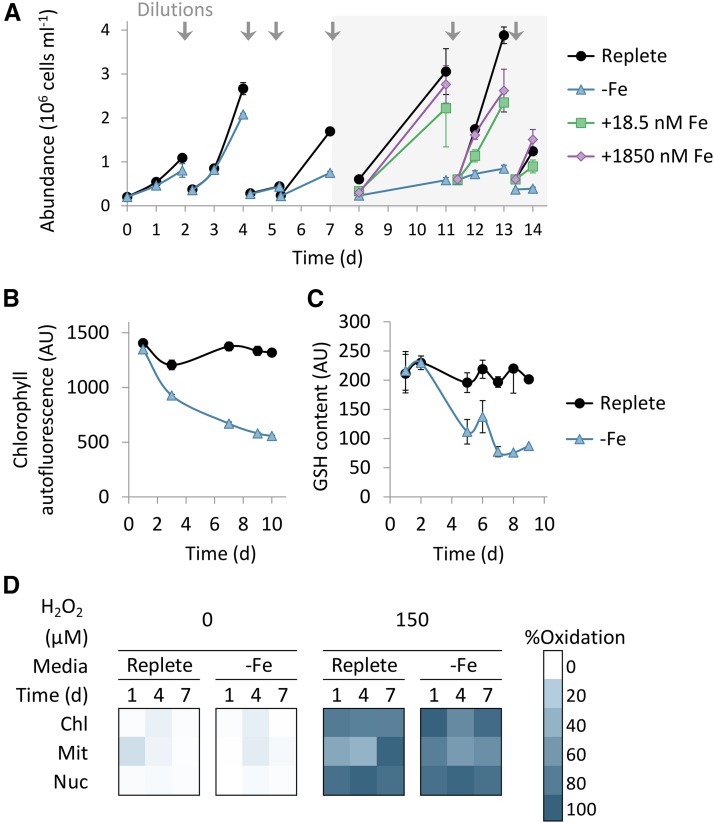
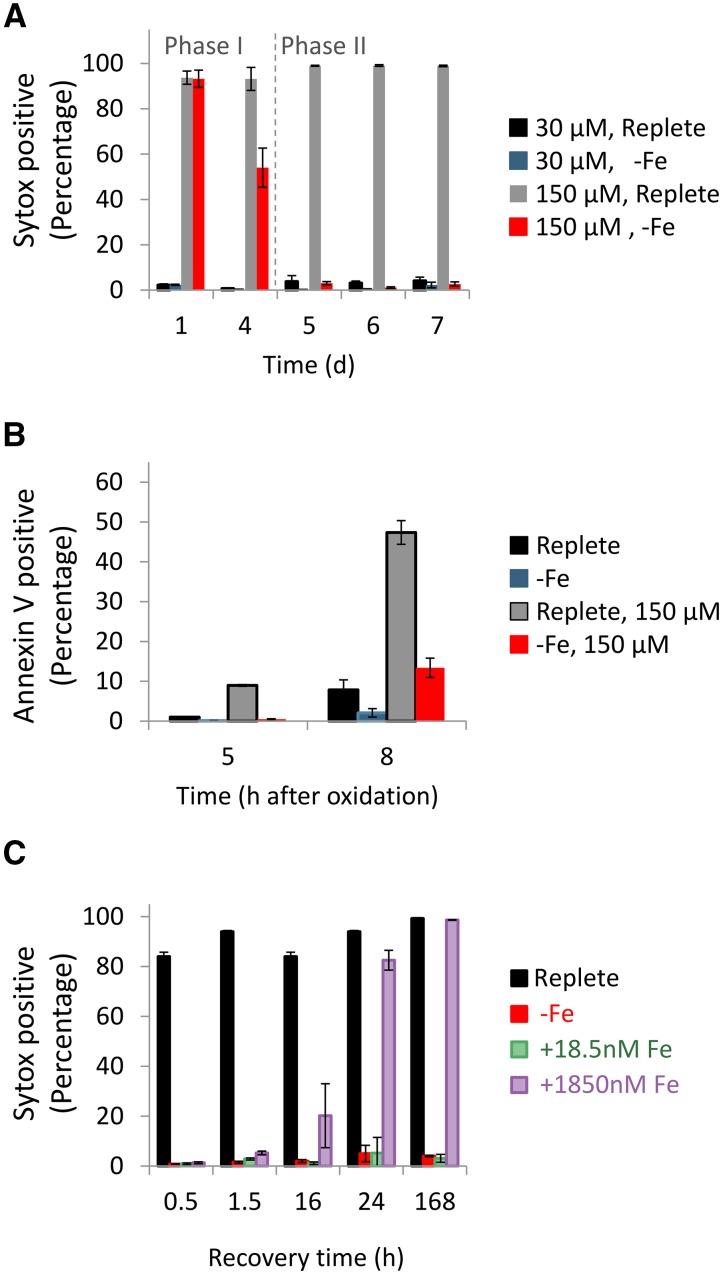
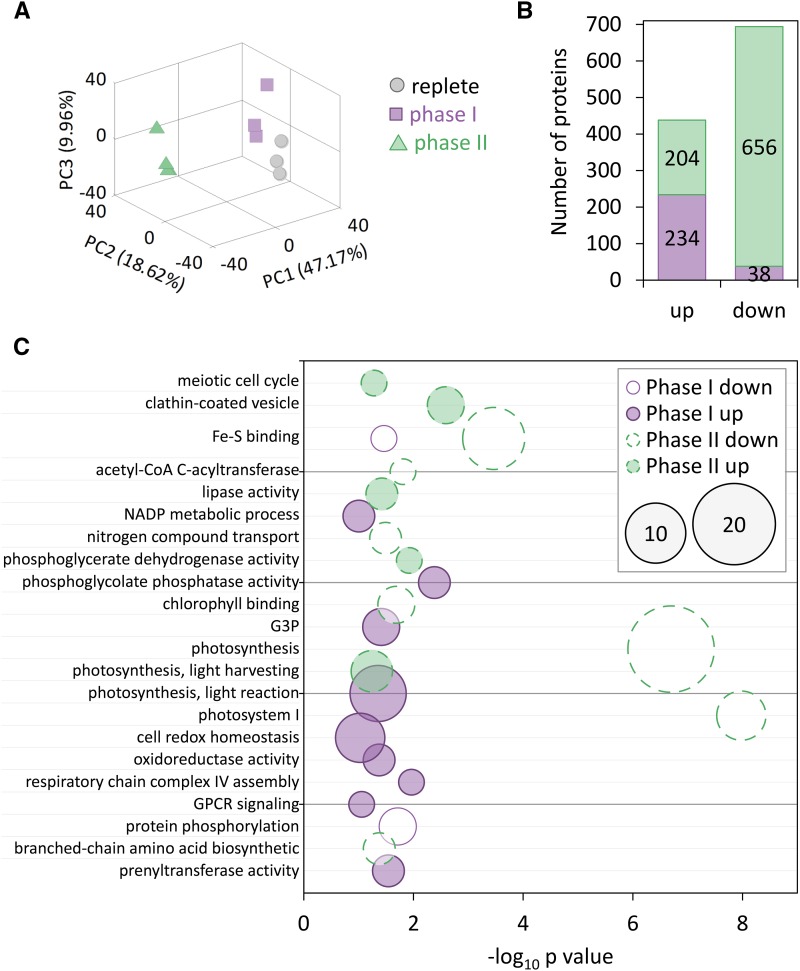
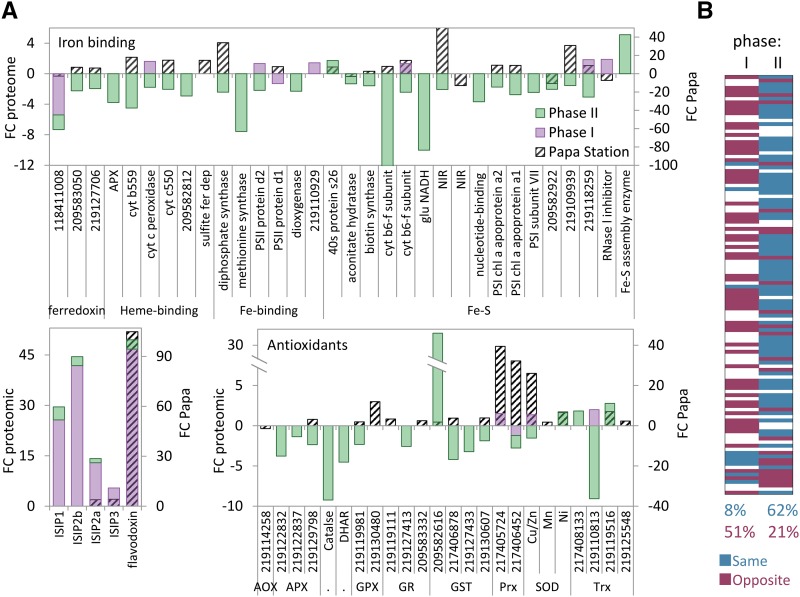
Diatoms are single-celled, photosynthetic, bloom-forming algae that are responsible for at least 20% of global primary production. Nevertheless, more than 30% of the oceans are considered "ocean deserts" due to iron limitation. We used the diatom Phaeodactylum tricornutum as a model system to explore diatom's response to iron limitation and its interplay with susceptibility to oxidative stress. By analyzing physiological parameters and proteome profiling, we defined two distinct phases: short-term (<3 d, phase I) and chronic (>5 d, phase II) iron limitation. While at phase I no significant changes in physiological parameters were observed, molecular markers for iron starvation, such as Iron Starvation Induced Protein and flavodoxin, were highly up-regulated. At phase II, down-regulation of numerous iron-containing proteins was detected in parallel to reduction in growth rate, chlorophyll content, photosynthetic activity, respiration rate, and antioxidant capacity. Intriguingly, while application of oxidative stress to phase I and II iron-limited cells similarly oxidized the reduced glutathione (GSH) pool, phase II iron limitation exhibited transient resistance to oxidative stress, despite the down regulation of many antioxidant proteins. By comparing proteomic profiles of P. tricornutum under iron limitation and metatranscriptomic data of an iron enrichment experiment conducted in the Pacific Ocean, we propose that iron-limited cells in the natural environment resemble the phase II metabolic state. These results provide insights into the trade-off between optimal growth rate and susceptibility to oxidative stress in the response of diatoms to iron quota in the marine environment.


Figures

Figure 1.
Figure 1.
Physiological response to iron limitation in the model diatom P. tricornutum. A, Time course of growth of batch cultures incubated in replete Fe conditions (black circles, f/2 media, 1,850 nM), or in −Fe (blue triangles, f/2 without iron, with 1 µM DFB). After 7 d, Fe-limited cultures were supplemented with either18.5 nM (green squares) and 1,850 nM (purple diamonds). Arrows indicate culture dilutions into fresh media as described in the method section. Gray background represents iron resupply at day 7. B, Chlorophyll autofluorescence per cell measured by flow cytometry (ex: 488 nm, em: 665 nm) during iron limitation. C, Quantification of the reduced GSH pool per cell during iron limitation measured as monochlorobimane fluorescence using flow cytometry (ex: 405 nm, em: 455 nm). D, roGFP oxidation in the chloroplast (Chl), mitochondria (Mit), and nucleus (Nuc), during iron limitation and 30 min after addition of 0 and 150 µM H2O2. Oxidation was measured by flow cytometry (ex: 405 nm or 488 nm, em: 525 nm). In all experiments, flow cytometry analysis is based on fluorescent measurements of at least 5,000 cells per sample. Error bars represent SE of biological triplicates.
Figure 2.
Figure 2.
Chronic iron limitation confers transient resistance to oxidative stress in the P. tricornutum. A, Cell death assessed by Sytox staining measured 24 h after treatment with 30 or 150 µM H2O2. The time (days) in the x axis represents the duration of iron limitation, similar to the time depicted in Figure 1. B, Phosphatidyl-Ser externalization measured by Annexin V stain at day 6 of iron limitation. Cells treated with 0 and 150 µM H2O2 were stained with Annexin V at 5 and 8 h posttreatment. C, Cell death assessed by Sytox positive cells, measured 24 h after treatment with 150 µM H2O2. Application of H2O2 was done 0.5, 1.5, 16, 24, and 168 h following iron resupply at day 7 of iron limitation. Flow cytometry analysis is based on fluorescent measurements of at least 5,000 cells per sample. Error bars represent SE of biological triplicates.
Figure 3.
Figure 3.
Decoupling between early oxidation and subsequent induction of cell death under chronic iron limitation. Scatter plots of degree roGFP oxidation in P. tricornutum cells targeted to the nucleus (3 h post H2O2 treatment, circles) and mitochondria (0.5 h post H2O2 treatment, triangles) in response to 0 to 150 µM H2O2, and level of cell death measured by Sytox positive cells 24 h posttreatment. A, Replete. B, Phase I (days 1–4 of iron limitation). C, Phase II (since day 5 of iron limitation). Each graph presents at least 130 samples.
Figure 4.
Figure 4.
Global proteomic profiling in P. tricornutum response to iron limitation. A, Principal component analysis of the proteomic data derived from Fe replete (replete, day 3, gray circles), phase I (day 3 of Fe limitation, purple squares), and phase II (day 5 of Fe- limitation, green triangles) cultures. B, Number of differentially expressed proteins (fold change < −1.5 or >1.5, P < 0.05) in phase I (purple, Fe-limited cells on day 3 compared to cells in Fe-replete on day 3) and phase II (green, Fe-limited cells on day 5 compared Fe-limited cells on day 3) cultures. C, Significantly enriched GO terms (hypergeometric test, P < 0.05, down-regulated < −1.5-fold change, up-regulated >1.5-fold change) related to each phase for up- or down-regulated proteins. x Axis represents −log10 of P value, size represents number of genes in each GO term.
Figure 5.
Figure 5.
Comparison between P. tricornutum proteomic profiling under iron limitation and metatranscriptome study at Ocean Station Papa. A, Fold change of iron-responsive and antioxidant proteins in phase I (purple) and phase II (green). At 98 h following iron enrichment in Ocean Station Papa (striped black) is presented on the secondary y axis (Marchetti et al., 2012). Gene numbers represent P. tricornutum GI numbers. B, Gene-to-gene comparison of proteins present in both P. tricornutum phase I or phase II proteomic data (P value < 0.05), and Papa Station, total of 116 genes. Genes with the same trend (induced in iron limitation proteomics in P. tricornutum and reduced in iron fertilization metatranscriptome or the opposite) are marked in blue. Genes with the opposite trend (induced in iron limitation proteomics in P. tricornutum and in iron fertilization metatranscriptome or the opposite) are marked in red. Genes with fold change between −1.5 to 1.5 are marked in white.

Similar articles

Cited by

References

    1. Allen AE, Laroche J, Maheswari U, Lommer M, Schauer N, Lopez PJ, Finazzi G, Fernie AR, Bowler C (2008) Whole-cell response of the pennate diatom Phaeodactylum tricornutum to iron starvation. Proc Natl Acad Sci USA 105: 10438–10443 - PMC - PubMed
    1. Andrews SC, Arosio P, Bottke W, Briat JF, von Darl M, Harrison PM, Laulhère JP, Levi S, Lobreaux S, Yewdall SJ (1992) Structure, function, and evolution of ferritins. J Inorg Biochem 47: 161–174 - PubMed
    1. Antunes F, Cadenas E, Brunk UT (2001) Apoptosis induced by exposure to a low steady-state concentration of H2O2 is a consequence of lysosomal rupture. Biochem J 356: 549–555 - PMC - PubMed
    1. Armbrust EV. (2009) The life of diatoms in the world’s oceans. Nature 459: 185–192 - PubMed
    1. Arrigo KR, Perovich DK, Pickart RS, Brown ZW, van Dijken GL, Lowry KE, Mills MM, Palmer MA, Balch WM, Bahr F, et al. (2012) Massive phytoplankton blooms under Arctic sea ice. Science 336: 1408. - PubMed

Publication types

MeSH terms