. 2016 Sep 6;113(36):10115-20.
doi: 10.1073/pnas.1609997113. Epub 2016 Aug 8.

Regulatory evolution of Tbx5 and the origin of paired appendages

Affiliations

Regulatory evolution of Tbx5 and the origin of paired appendages

Noritaka Adachi et al. Proc Natl Acad Sci U S A. .

Abstract

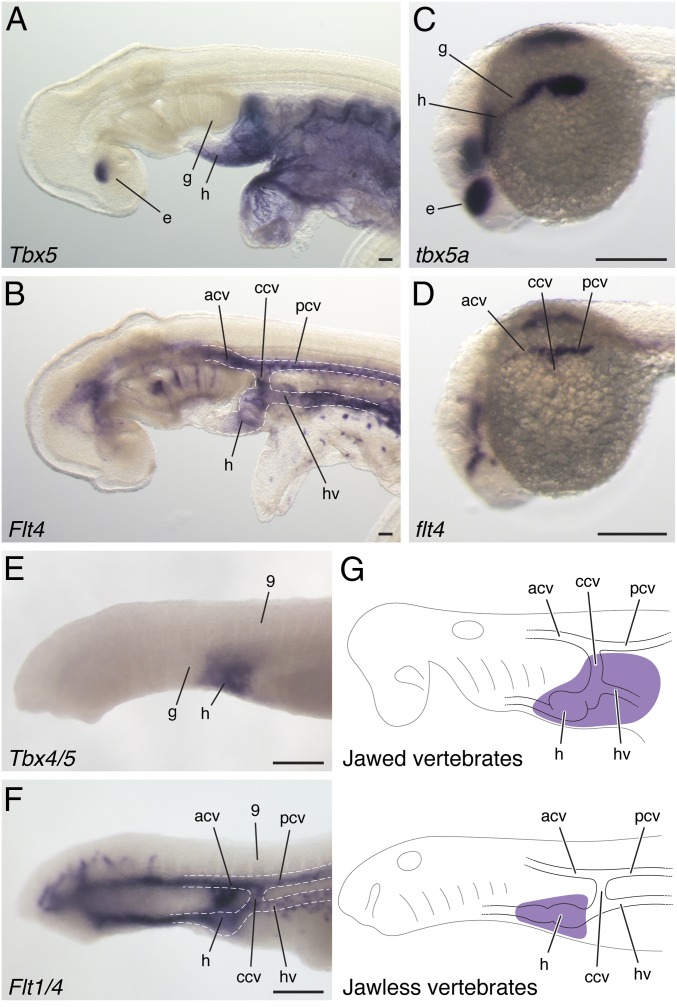
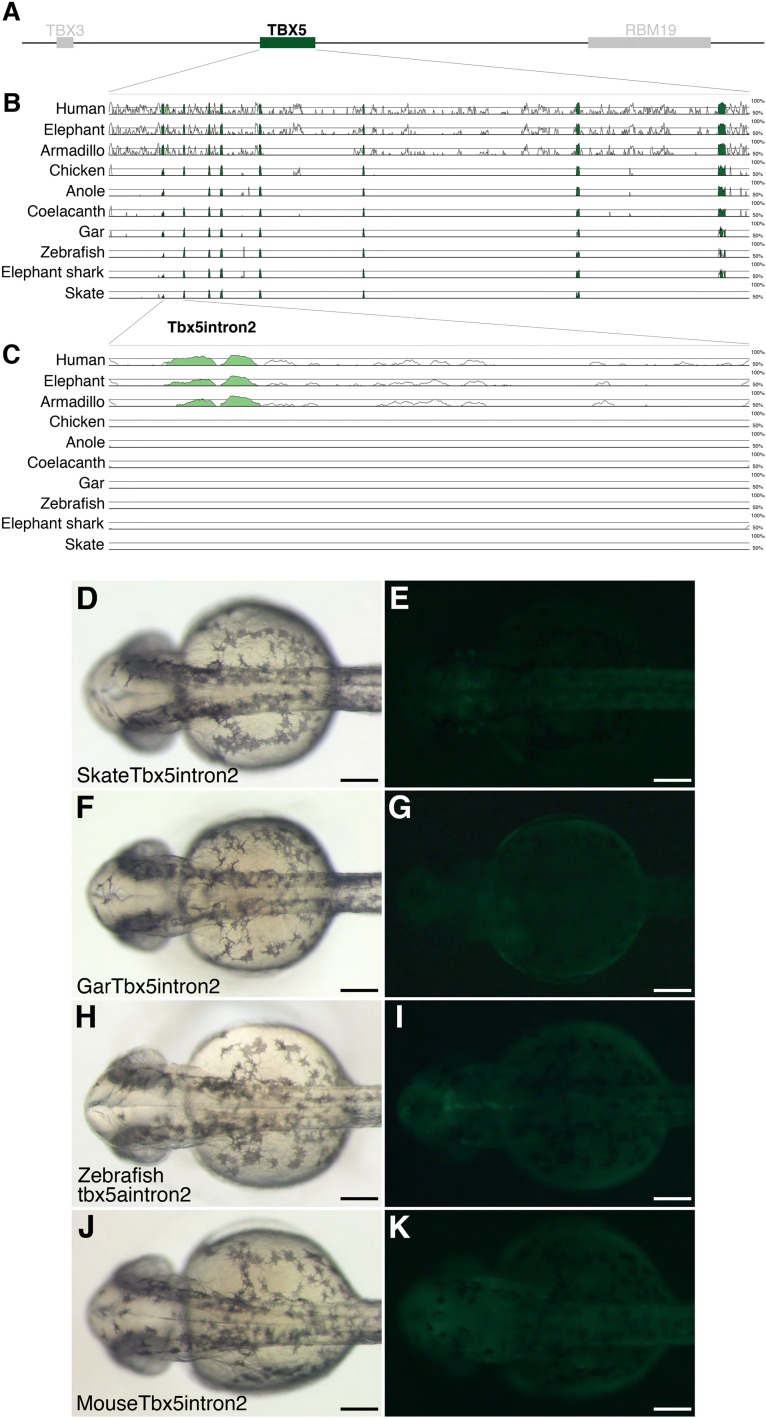
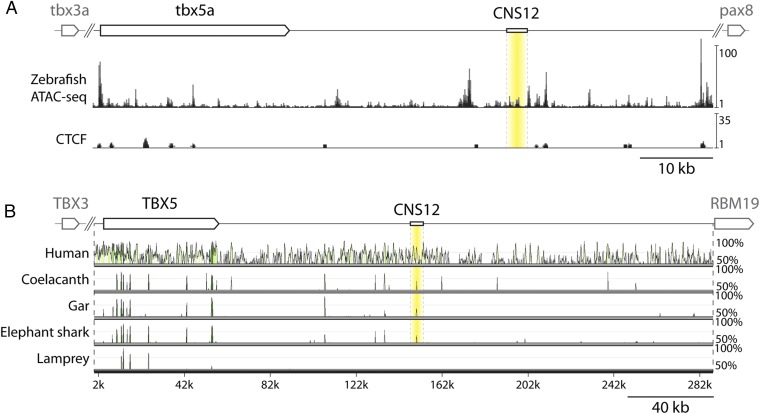
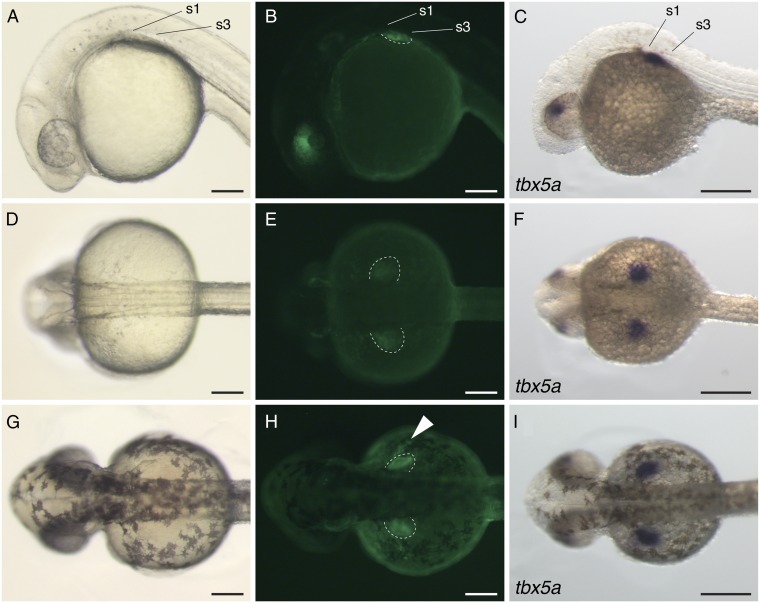
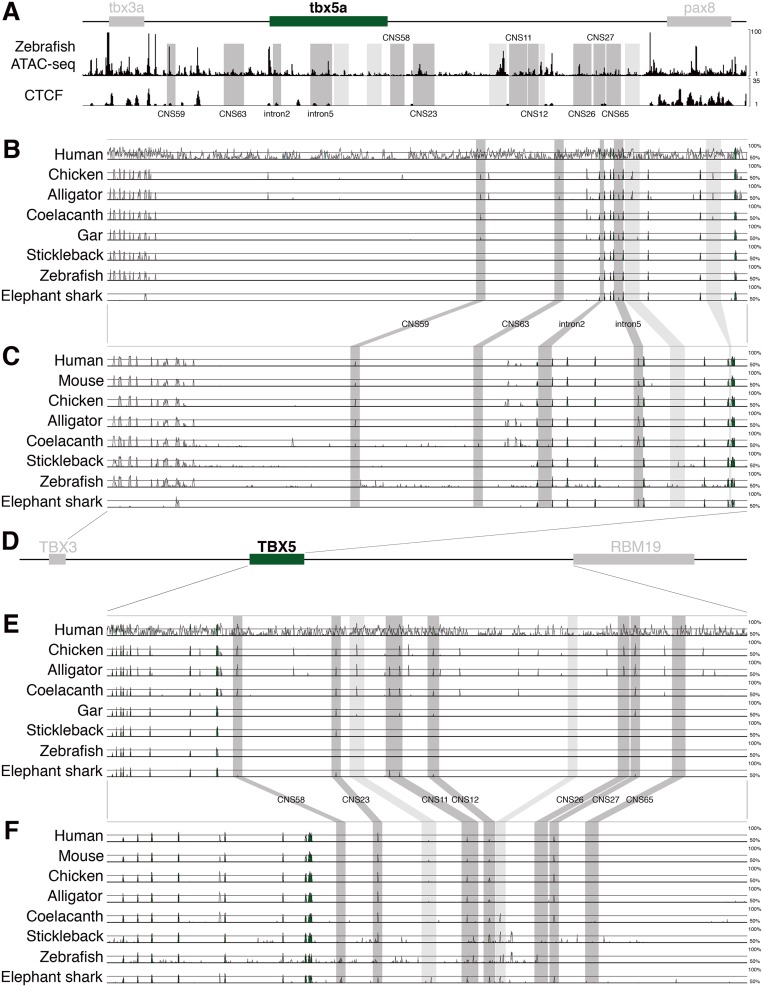
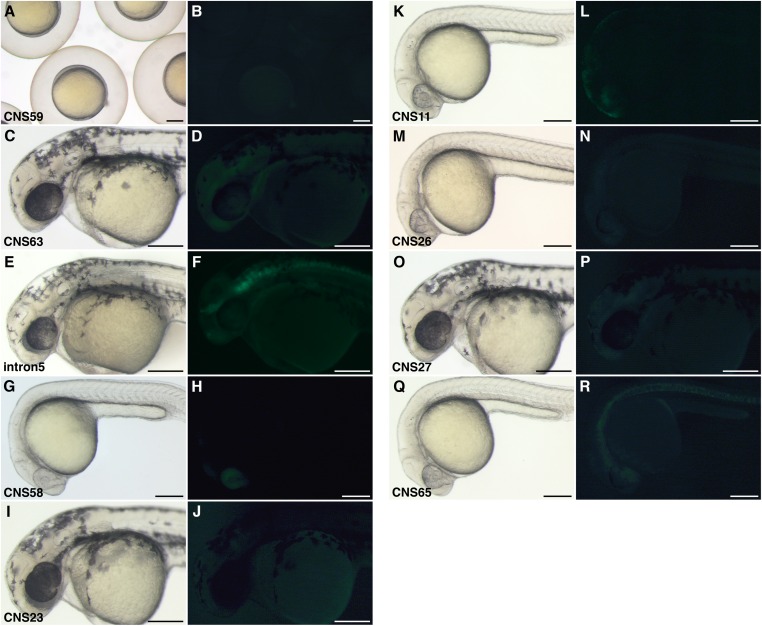
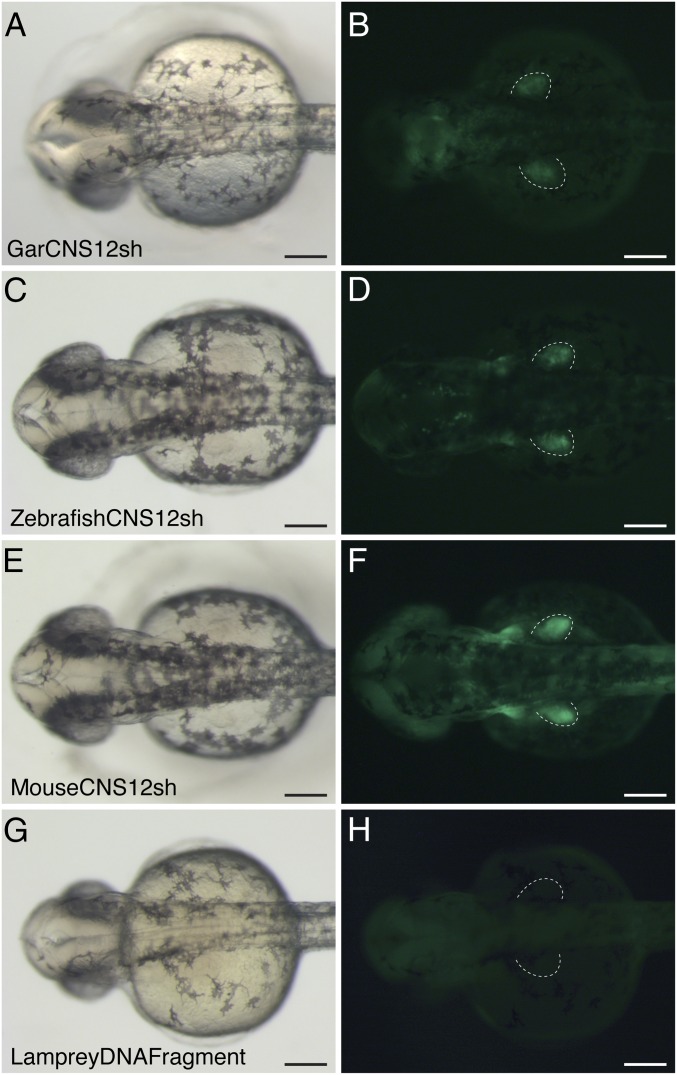
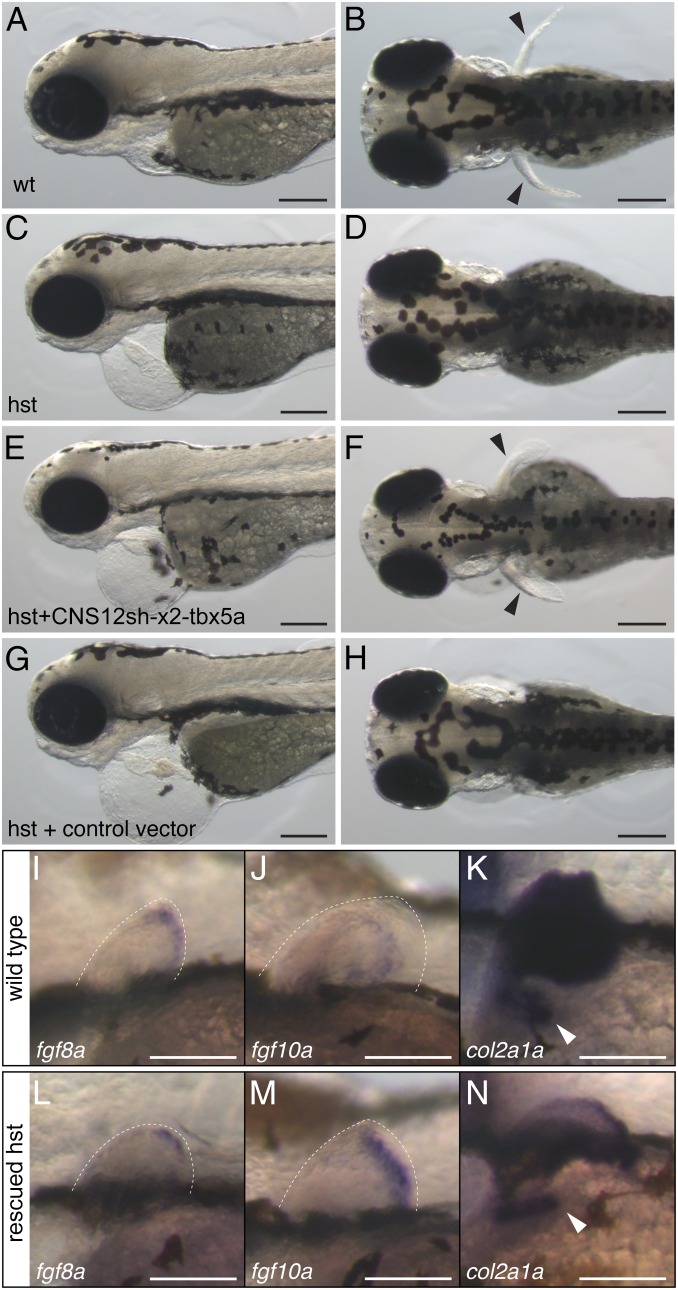
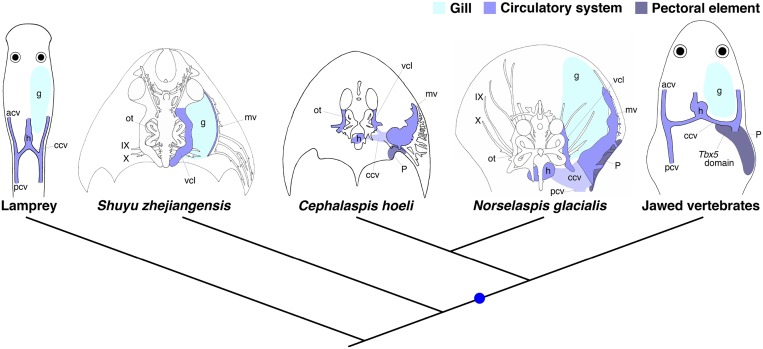
The diversification of paired appendages has been a major factor in the evolutionary radiation of vertebrates. Despite its importance, an understanding of the origin of paired appendages has remained elusive. To address this problem, we focused on T-box transcription factor 5 (Tbx5), a gene indispensable for pectoral appendage initiation and development. Comparison of gene expression in jawless and jawed vertebrates reveals that the Tbx5 expression in jawed vertebrates is derived in having an expression domain that extends caudal to the heart and gills. Chromatin profiling, phylogenetic footprinting, and functional assays enabled the identification of a Tbx5 fin enhancer associated with this apomorphic pattern of expression. Comparative functional analysis of reporter constructs reveals that this enhancer activity is evolutionarily conserved among jawed vertebrates and is able to rescue the finless phenotype of tbx5a mutant zebrafish. Taking paleontological evidence of early vertebrates into account, our results suggest that the gain of apomorphic patterns of Tbx5 expression and regulation likely contributed to the morphological transition from a finless to finned condition at the base of the vertebrate lineage.

Keywords: Tbx5 enhancer; development; evolution; paired fins.


Conflict of interest statement

The authors declare no conflict of interest.

Figures

Fig. 1.
Fig. 1.
Comparison of Tbx5 cognate genes in vertebrates. Skate Tbx5 (A) and Flt4 (B) expression at stage 23. Zebrafish tbx5a (C) and flt4 (D) expression at 22 hpf. Sea lamprey Tbx4/5 (E) and Flt1/4 (F) expression at stage 24. (G) A depiction of the Tbx5 expression domain (purple) relative to embryonic components in jawed and jawless vertebrates. acv, anterior cardinal vein; ccv, common cardinal vein; e, eye; g, gills; h, heart; hv, hepatocardiac vein; pcv, posterior cardinal vein; 9, somite 9. (Scale bars: 200 μm.)
Fig. S1.
Fig. S1.
Molecular phylogenetic trees of Tbx4/5 (A) and Flt1/4 (B) genes. (A) One hundred eighty-six amino acid sites of Tbx4/5 cognate genes in chordates are used to construct the maximum-likelihood tree. Skate Tbx5 is included in Tbx5 gene cluster, whereas sea lamprey Tbx4/5 is placed outside of Tbx4 and Tbx5 gene clusters. (B) Two hundred seventy-one amino acid sites are used in Flt gene phylogenetic analysis. The maximum-likelihood tree shows the orthology of skate Flt4 with other Flt4 genes. Sea lamprey Flt1/4 is located outside of Flt1 and Flt4 gene clusters. The clear orthology of sea lamprey genes (Tbx4/5 and Flt1/4) to jawed vertebrate genes (Tbx5 and Flt4) is uncertain due to the incomplete sequencing of the sea lamprey genome and hidden paralogy (51). Amphioxus (Branchiostoma floridae) and tunicate (Ciona intestinalis) genes are applied for the out-group. Numbers near the branches represent boot-strap values of 1,000 replicates.
Fig. S2.
Fig. S2.
Tbx4/5 and Flt1/4 expression in sea lamprey embryos. Tbx4/5 (A−L) and Flt1/4 (M−P) expression in developing sea lampreys. (A) Tbx4/5 was undetectable at stage 21. (B) Tbx4/5 is initially detected in the heart primordium at stage 22. (C−F) Tbx4/5 is expressed in the heart. The posterior border of Tbx4/5 expression and heart domain are not clear due to the premature development of heart and cardinal veins at these stages. (G and H) The heart expression of Tbx4/5 becomes barely detectable at stages 27 and 28. (I−L) Tbx4/5 is undetectable in the heart at stages 29 and 30. The expression is never found in the median fin (J and L). Tbx4/5 expression was not found in the dorsal portion of the eye in sea lamprey embryos. (M) Flt1/4 was detectable in the dorsal and ventral aortas, but not in the cardinal veins at stage 23. (N and O) Flt1/4 was detected in the cardinal veins at stages 24 and 25. (P) Flt1/4 was weakly expressed in the cardinal veins at stage 26. (Scale bars: 200 μm.)
Fig. S3.
Fig. S3.
tbx5a and flt4 expression in zebrafish. tbx5a (A and B) and flt4 (C and D) expression at 24 hpf of zebrafish embryos. Dorsolateral views (A and C) and dorsal views (B and D). tbx5a is expressed next to somites 1–4. The posterior half of the common cardinal vein labeled by flt4 is located next to somite 1. acv, anterior cardinal vein; ccv, common cardinal vein; pcv, posterior cardinal vein; s1, somite 1; s3, somite 3. (Scale bars: 200 μm.)
Fig. S4.
Fig. S4.
Sequence alignment of Tbx5 coding region and Tbx5 intron2 transgenic zebrafish. (A) A schematic representation of human TBX5 locus. (B) mVISTA analysis around Tbx5 using the mouse sequence as base. (C) Enlargement of Tbx5 intron2. Conserved sequences are indicated as peaks. Brightfield (D, F, H, and J) and fluorescent (E, G, I, and K) images of Tbx5 intron2 transgenic zebrafish. All images are from dorsal view at 36 hpf. Skate (D and E), gar (F and G), zebrafish (H and I) and mouse (J and K) Tbx5 intron2 never drive GFP signal in the pectoral fin bud. (Scale bars: 200 μm.)
Fig. 2.
Fig. 2.
Chromatin state and sequence comparison adjacent to the Tbx5 locus. (A) A schematic representation of zebrafish tbx5a locus, ATAC-seq data from 24 hpf zebrafish, and predicted CTCF sites. CNS12 is denoted in yellow. (B) A schematic representation of human TBX5 locus and mVISTA analysis with Tbx5 (Tbx4/5 in Japanese lamprey) coding and the downstream noncoding sequences using the mouse sequence for comparison. CNS12 is labeled in yellow, and peaks at the middle of the label indicate CNS12sh.
Fig. 3.
Fig. 3.
Gar CNS12 drives GFP expression in the pectoral fin of zebrafish. Brightfield (A, D, and G) and fluorescent (B, E, and H) images of gar CNS12 transgenic zebrafish. Lateral views are in AC and dorsal views are in DI. GFP expression is found in the dorsal part of the eye and pectoral fin field at 24 hpf (A, B, D, and E), and in the common cardinal vein (arrowhead) and pectoral fin bud at 36 hpf (G and H). Dotted lines outline the pectoral fin. Zebrafish tbx5a in situ hybridization at 24 hpf (C and F) and at 36 hpf (I). (Scale bars: 200 μm.)
Fig. S5.
Fig. S5.
Chromatin state and alignments of genomic sequence around the Tbx5 locus. (A) A schematic representation of the zebrafish tbx5a locus, ATAC-seq data from 24 hpf zebrafish, and predicted CTCF sites. mVISTA analyses of genomic sequence between Tbx3 and Tbx5 by using the mouse sequence as baseline (B), and gar sequence as baseline (C). (D) Schematic representation of human TBX5 locus. mVISTA analyses of Tbx5 and downstream sequence using the mouse sequence as baseline (E), and gar sequence as baseline (F). Conserved sequences are indicated as peaks. DNA fragments tested in transgenic zebrafish are highlighted in dark gray. DNA fragments marked in light gray were tested in transient injection of reporter construct and did not show GFP expression in the pectoral fin.
Fig. S6.
Fig. S6.
Transgenic zebrafish with DNA fragment around Tbx5 locus. Brightfield (A, C, E, G, I, K, M, O, and Q) and fluorescent (B, D, F, H, J, L, N, P, and R) images. (A and B) CNS59 transgenic zebrafish at 9 hpf. One stable line is screened. (C and D) CNS63 transgenic zebrafish at 36 hpf: one line. (E and F) Tbx5 intron5 transgenic zebrafish at 36 hpf: seven lines. (G and H) CNS58 transgenic zebrafish at 24 hpf: two lines. (I and J) CNS23 transgenic zebrafish at 36 hpf: six lines. (K and L) CNS11 transgenic zebrafish at 24 hpf: one line. (M and N) CNS26 transgenic zebrafish at 36 hpf: one line. (O and P) CNS27 transgenic zebrafish at 36 hpf: one line. (Q and R) CNS65 transgenic zebrafish at 24 hpf: two lines. (Scale bars: 200 μm.)
Fig. S7.
Fig. S7.
GFP expression pattern of gar CNS12 transgenic zebrafish. Brightfield (A, C, E, and F) and fluorescent (B, D, and G) images of gar CNS12 transgenic zebrafish. Lateral views in (A, B, and E−G) and dorsal views in (C and D). (A and B) GFP expressions are found in the dorsal eye and pectoral fin bud at 36 hpf. Dotted lines outline the fin bud, in which GFP signals are detected in the mesenchyme. (C and D) GFP are expressed on the posterior edge of the ccv (dotted lines and arrowhead). (E) A 4-wk-old juvenile of the transgenic fish. (F) The juvenile has the pelvic fin bud (black arrowhead). (G) The fin bud does not show GFP signals (white arrowhead). A green emission is detected in the digestive tract. ccv, common cardinal vein; e, eye; pf, pectoral fin. (Scale bars: A−D, 200 μm; E−G, 500 μm.)
Fig. 4.
Fig. 4.
Brightfield (A, C, and E) and fluorescent (B, D, and F) images of CNS12sh transgenic zebrafish from dorsal view at 36 hpf. Gar (A and B), zebrafish (C and D), and mouse (E and F) CNS12sh drive GFP expression in the pectoral fin bud. (G and H) Transgenic zebrafish with Japanese lamprey DNA fragment aligned to jawed vertebrate CNS12 at 36 hpf. Dotted lines outline the pectoral fin. (Scale bars: 200 μm.)
Fig. S8.
Fig. S8.
Sequence alignment of CNS12 from jawed vertebrates and Japanese lamprey DNA fragment. Gar CNS12sh sequence is highlighted in gray.
Fig. 5.
Fig. 5.
tbx5a driven by CNS12sh rescues pectoral fin formation in hst. Wild-type (A and B) and hst (CH) at 3 dpf. Lateral views (A, C, E, and G) and dorsal views (B, D, F, and H). Black arrowheads indicate pectoral fins. fgf8a (I and L), fgf10a (J and M), and col2a1a (K and N) in situ hybridization in the wild-type (IK) and rescued hst (LN) at 3 dpf. Dotted lines outline the pectoral fin and white arrowheads indicate the scapulocoracoid. (Scale bars: AH, 200 μm; IN, 100 μm.)
Fig. S9.
Fig. S9.
Various phenotypes of pectoral fins in rescued hst. Schematic of vectors used in the rescue (A) and control (B) experiments. Dorsal views of rescued hst zebrafish at 3 dpf. Arrowheads indicate pectoral fins. (C) The right fin, almost identical to the wild-type fin, is well developed compared with the left one. (D) Likewise in C, the right fin is bigger than the left one, but both right and left fins are less developed compared with the wild-type fin. (E) A small left fin is rescued. (F) A small right fin is rescued. (G and H) tbx5a in situ hybridization in the wild-type (G) and rescued hst (H) at 3 dpf. Dotted lines outline the fin bud. cFos, cFos minimal promoter; CNS12sh, CNS12 short; Drtbx5a, Danio rerio tbx5a coding sequence; Tol2, Tol2 transposon sequence. (Scale bars: C−F, 200 μm; G and H, 100 μm.)
Fig. S10.
Fig. S10.
Vertebrate phylogeny and evolution of pectoral elements. Head and anterior trunk regions, together with internal anatomy, are schematized in lamprey, galeaspids (Shuyu zhejiangensis), osteostracans (Cephalaspis hoeli and Norselaspis glacialis), and jawed vertebrates. The heart, lateral head vein, and marginal vein in fossil species are reconstructed based on the ossified capsule and canals. The common cardinal vein and posterior cardinal vein of osteostracans are inferred based on the morphology of the pericardial capsule, lateral head and marginal vein canals, and larval lamprey anatomy (41, 52, 53). Osteostracans possess the pectoral elements that are morphologically comparable to that of placoderms, a paraphyletic assemblage of stem-jawed vertebrates (–, , –45). Those components, the pericardial capsule and pectoral elements, are missing in galeaspids, a sister group of osteostracans and jawed vertebrates (7, 10, 12, 40). Note that the topographical relationship of the pectoral appendage in osteostracans relative to the heart, gills, and ccv is comparable to that of jawed vertebrates. Galeaspids was redrawn from ref. , and osteostracans was redrawn from refs. , , , and . Blue spot indicates gain of pectoral elements, and hypothesized gain of Tbx5 expression posterior to the heart and CNS12. acv, anterior cardinal vein; ccv, common cardinal vein; g, gills; h, heart; IX, glossopharyngeal nerve (ninth cranial nerve); mv, marginal vein; ot, otic components; p, pectoral element; pcv, posterior cardinal vein; vcl, vena capitis lateralis (lateral head vein); X, vagus nerve (10th cranial nerve).

Similar articles

Cited by

References

    1. Thacher JK. Median and paired fins, a contribution to the history of the vertebrate limbs. Trans Conn Acad Arts Sci. 1877;3:281–310.
    1. Mivart S. Notes on the fins of elasmobranchs, with considerations on the nature and homologues of vertebrate limbs. Trans Zool Soc Lond. 1879;10:439–484.
    1. Balfour FM. On the dedopment of the skeleton of the paired fins of Elasmobranchii, considered in relation to its bearings on the nature of the limbs of the vertebrata. Proc Zool Soc Lond. 1881;49(3):656–671.
    1. Gegenbaur C. Elements of Comparative Anatomy. MacMillan and Co.; London: 1878.
    1. Goodrich E. Studies on the Structure and Development of Vertebrates. MacMillan and Co., Limited; London: 1930.

Publication types

MeSH terms