. 2016 Oct 1;76(19):5696-5706.
doi: 10.1158/0008-5472.CAN-16-0839. Epub 2016 Aug 8.

Adaptive NK Cells with Low TIGIT Expression Are Inherently Resistant to Myeloid-Derived Suppressor Cells

Affiliations

Adaptive NK Cells with Low TIGIT Expression Are Inherently Resistant to Myeloid-Derived Suppressor Cells

Dhifaf Sarhan et al. Cancer Res. .

Abstract

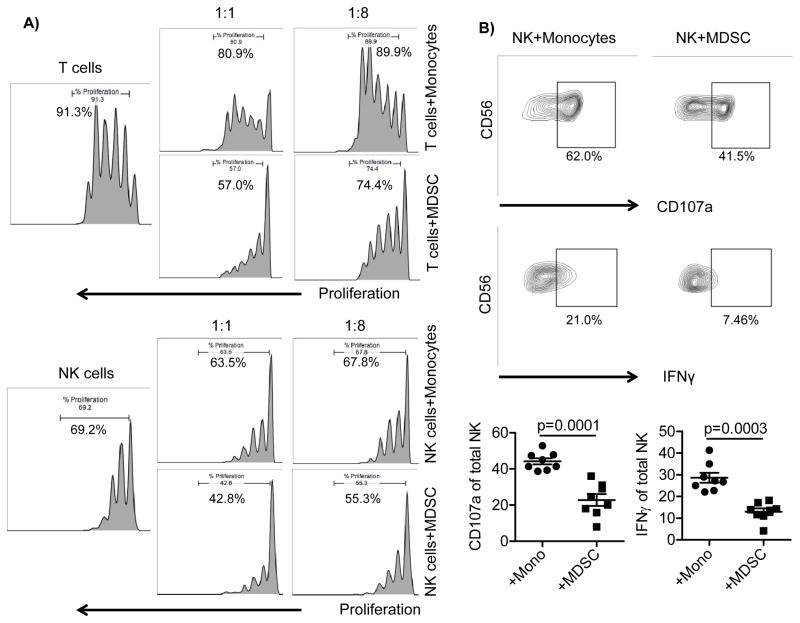
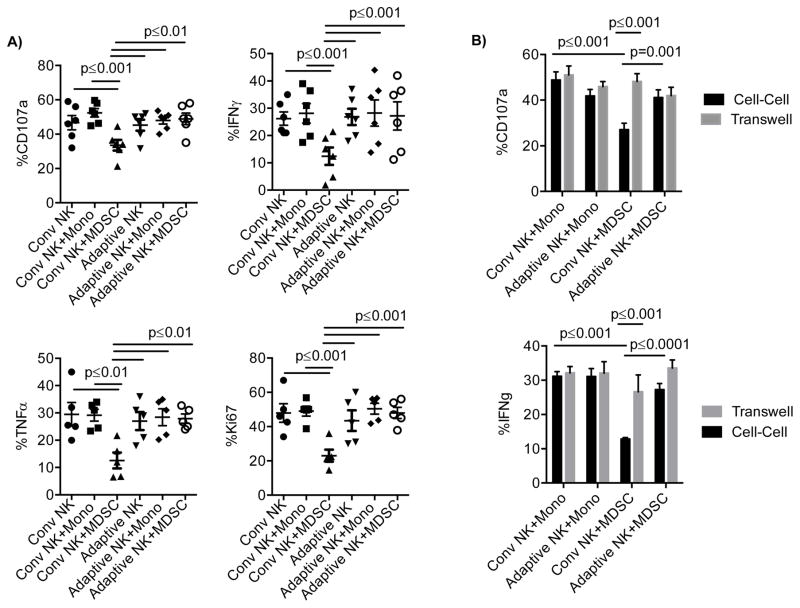
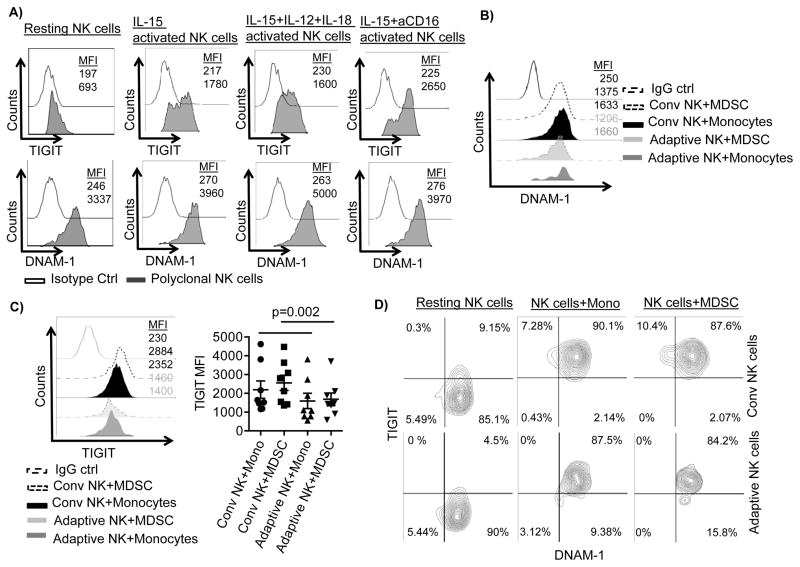
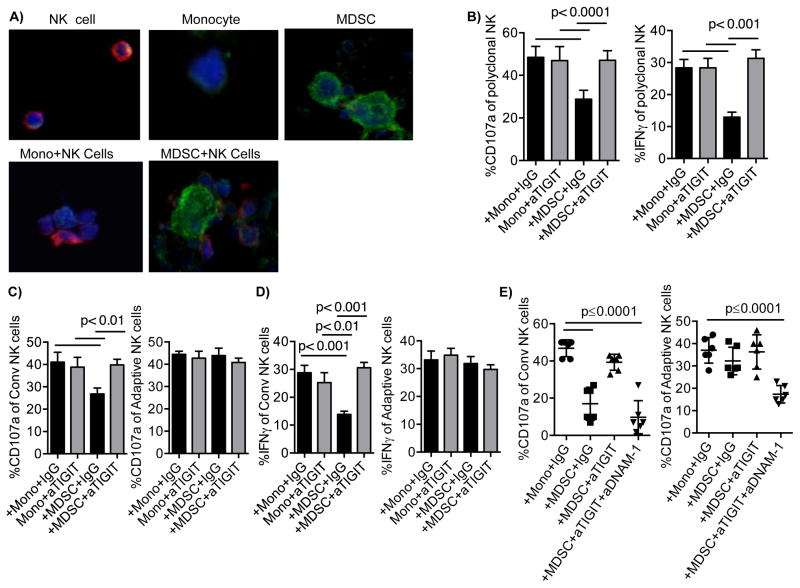
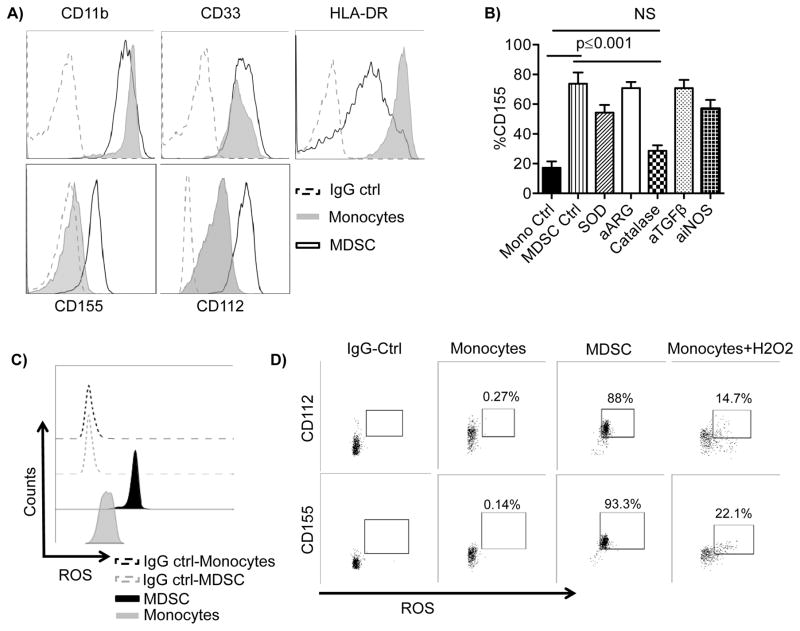
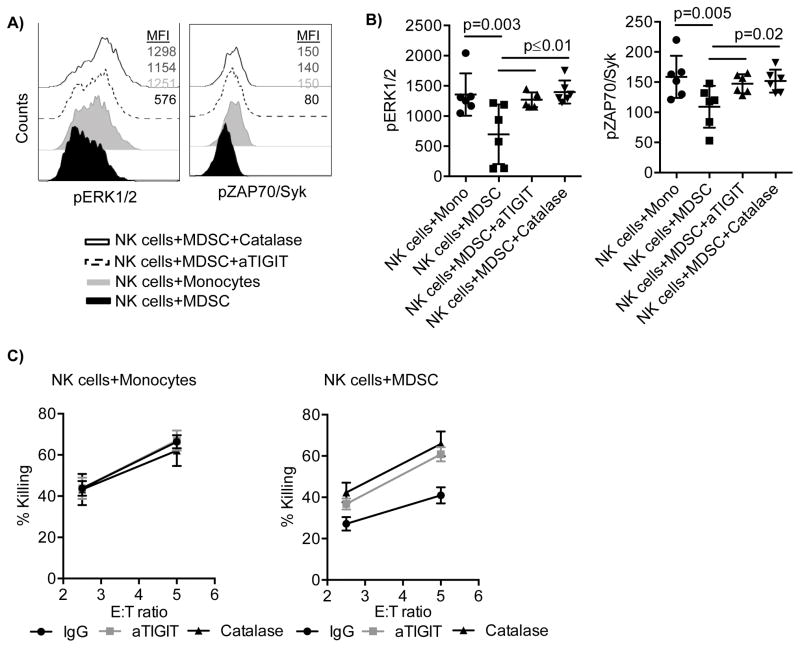
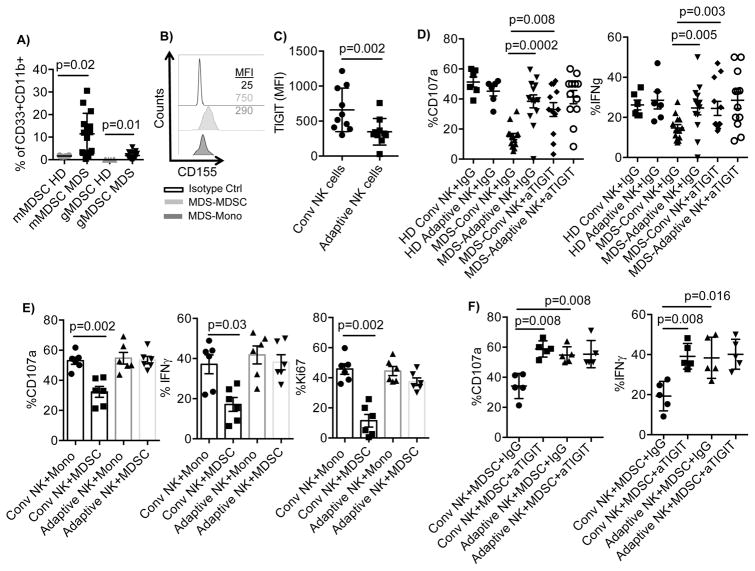
Human cytomegalovirus (CMV)-induced adaptive natural killer (NK) cells display distinct phenotypic and functional characteristics, including properties of immune memory. We hypothesized that these cells may be more resistant to suppression mediated by immunoregulatory cell subsets, making them attractive for use in cancer therapy. Here we report that relative to conventional NK cells, adaptive NK cells express lower levels of the inhibitory receptor T-cell Ig and ITIM domain (TIGIT), which results in resistance to immune suppression mediated by myeloid-derived suppressor cells (MDSC), as derived from cytokine induction in normal blood or patients with myelodysplastic syndrome. In contrast, conventional NK cells were potently suppressed by MDSCs, an effect abrogated completely by TIGIT blockade. Mechanistically, TIGIT signaling in NK cells after MDSC coculture led to a decrease in the phosphorylation of ZAP70/Syk and ERK1/2. These effects were reversed by blocking TIGIT on NK cells or by inhibiting production of reactive oxygen species (ROS) by MDSCs, the latter of which upregulated the TIGIT ligand CD155 on MDSCs. Accordingly, the blunted cytotoxicity of NK cells cocultured with MDSCs against tumor cells could be reversed by blocking TIGIT or ROS production. Overall, our results show how adaptive NK cells arising in response to CMV infection can escape MDSC-mediated suppression, and defined TIGIT antagonists as a novel type of checkpoint inhibitor to enhance NK-cell-mediated responses against cancer and infection. Cancer Res; 76(19); 5696-706. ©2016 AACR.


Conflict of interest statement

Dr. JS Miller serves on the Scientific Advisory Board of Celgene, Fate Therapeutics and Oxis Biotech. Dr. BR Blazar declares a financial conflict with Tmunity and Kadmon Corp. Dr. Miller’s and Blazar’s relationships have been reviewed and managed by the University of Minnesota in accordance with its conflict of interest polices. None of these relationships had any role in this research, which was funded by the NIH. The other authors have no conflict of interest to declare.

Figures

Figure 1
Figure 1. MDSCs suppress T and NK cell proliferation and NK cell functions
A) Purified T and NK cells from healthy blood donors were labeled by CellTrace Violet and co-cultured with MDSCs or monocytes at different ratios in the presence of CD3/CD28 beads (40 beads/1×105 cells) and IL-15 (1 ng/ml) for T cells or IL-15 (10 ng/ml) alone for NK cells. Proliferation was assessed on day 3 or 4, and representative data is shown of six independent experiments. B) Purified NK cells were co-cultured with monocytes or MDSCs at a 2:1 ratio in the presence of IL-15 (10 ng/ml) for 5 days. Cells were stimulated with agonistic CD16 (1 μg/ml) for 6 hours prior to staining and evaluated for degranulation (CD107a) and IFN-γ production. Cumulative (n=8) data are shown as mean ± SEM. The Student’s t test was used for statistical analysis.
Figure 2
Figure 2. Adaptive NK cells resist MDSC suppression
A) Purified NK cells from healthy blood donors were cultured alone or in contact with MDSCs or monocytes at a 2:1 ratio in the presence of IL-15 (10 ng/ml) for 5 days or B) in transwells allowing exchange of soluble factors only. Cells were stimulated with anti-CD16 six hours prior to staining, and degranulation, IFN-γ and TNF-production, as well as proliferation (Ki67) were assessed by flow cytometry. Pooled data of 5–7 independent experiments are shown as the mean ± SEM and statistical analysis were done using the Two-Way ANOVA.
Figure 3
Figure 3. Conventional NK cells express higher TIGIT compared to adaptive NK cells
A) Purified NK cells from healthy blood donors were cultured before staining in the absence or presence of IL-15 (10 ng/ml) alone or with the additional stimulation of IL-12 (10 ng/ml) and IL-18 (100 ng/ml) for 18 hours or with stimulation with anti-CD16 (1 μg/ml) for 6 hours. One of 4 independent experiments is shown. NK cells were cultured with MDSCs or monocytes at a 2:1 ratio in presence of IL-15 (10 ng/ml) for 5 days. Cells were stimulated with anti-CD16 six hours prior to analysis. Representative histograms for B) DNAM-1 and C) TIGIT expression and aggregate data for TIGIT expression (n=8) are shown as mean fluorescence intensity (MFI) ± SEM. Two-Way ANOVA was used for statistical analysis. D) NK cells before and after co-culture with monocytes or MDSC were analyzed for co-expression of DNAM-1 and TIGIT. Representative data is shown of 3 independent experiments and 7 replicates.
Figure 4
Figure 4. TIGIT-dependent suppression of conventional NK cells by MDSC
A) Monocytes, MDSCs, and NK cells were labeled with CellTracker Blue, co-cultured on slides overnight then stimulated with anti-CD16 prior stained with anti-CD155 (green) and anti-TIGIT (red) followed by confocal microscopy. Individual cell types are shown at the upper panel or at the lower panel when co-cultured. Representative data of 2 independent experiments and 6 donors is shown. NK cells were cultured with monocytes or MDSCs in the presence of IL-15 and IgG control (10 ug/ml) or blocking antibodies against TIGIT (10 ug/ml) for 5 days. Degranulation (n=9) and IFN-γ production (n=8) were evaluated in B) polyclonal NK cells, C) conventional (n=8) and D) adaptive NK cells (n=9). E) Alternatively, cells were co-blocked by anti-TIGIT and anti-DNAM-1(10 ug/ml) (n=6). Pooled data are shown as mean ± SEM of n number of replicates, and the Two-Way and One-way (E) ANOVA were used for statistical analysis.
Figure 5
Figure 5. Reactive Oxygen Species (ROS) induce CD155 expression on MDSCs
A) MDSCs and monocytes were stained for the antigens shown. One representative example from 10 independent experiments is shown. B) Induced MDSCs were stained for CD155 and analyzed by flow cytometry following overnight treatment with superoxide dismutase (SOD, 200 IU/mL), arginase inhibitor (a-ARG, arginase inhibitor N(ω)-hydroxy-nor-l-arginine, 500 μM), ROS scavenger (Catalase, 200 IU/mL), blocking antibodies against TGF-β (10 μg/ml), iNOS inhibitor (aiNOS, NG-monomethyl-l-arginine, 500 μM), or left untreated compared to control monocytes. Pooled (n=4) data from n independent experiments are shown as mean ± SEM, and statistical analysis were done using the Two-way ANOVA. C) Unstimulated monocytes and MDSCs were stained for total ROS and analyzed by flow cytometry. D) Unstimulated or H2O2 (250 μM) monocytes for 1 hour and unstimulated MDSCs were stained for total ROS, CD112, and CD155 and analyzed by flow cytometry. Cells double positive for ROS and CD112 or CD155 are shown. One representative donor of 6 is shown. One representative isotype control is shown for all groups for simplicity as individual controls were similar between conditions.
Figure 6
Figure 6. TIGIT engagement inhibits pZAP70/Syk and pERK1/2 and results in inhibition of NK cell cytotoxicity
A) Purified NK cells were co-cultured with MDSCs or monocytes at a 2:1 ratio in the presence of IL-15 (10 ng/ml), IgG control (10 μg/ml) and in the presence or absence of blocking antibodies against TIGIT (10 μg/ml), or catalase (200 IU/mL) for 5 days. Cells were stimulated for 10 and 30 min with anti-CD16, and stained for pZAP/Syk or pERK1/2 respectively. Representative A) or cumulative B) data are shown from 3 independent experiments and 6 donors as mean ± SEM. Statistical analysis were done using the Two-Way ANOVA. C) NK cells from monocyte and MDSC co-cultures in the presence or absence of anti-TIGIT or catalase were washed and incubated with 51Cr-labeled K562 for 4 hours to assess NK cell cytotoxicity. Representative data from 3 independent experiments is shown as mean ± SEM.
Figure 7
Figure 7. TIGIT-dependent suppression of conventional NK cells by MDS MDSCs
A) PBMC (n=15) from MDS patients and healthy donors (n=6) were rested overnight, stained and the MDSC frequency were determined by flow cytometry. Monocytic MDSCs (mMDSCs) were defined as CD45+LinCD11b+CD33+HLA-DR−/lowCD14+ and granulocytic MDSCs (gMDSCs) as CD45+LinCD11b+CD33+CD15+. B) MDS-PBMC were stained for CD155 and gated for mMDSC and monocytes. Representative histograms are shown of 15. C) PBMCs (n=10) from MDS patients were rested overnight and evaluated for TIGIT expression by flow cytometry. D) PBMCs from healthy donors (HD, n=6) or MDS patients (n=13) were stimulated with IL-15 (10 ng/ml) in the presence of IgG control or anti-TIGIT, and anti-CD16 (1 ug/ml) for 6 hours and assessed for NK cell degranulation and IFN-γ production. E) Purified NK cells (n=6) from healthy blood donors were co-cultured with autologous monocytes or allogeneic MDSCs enriched from the blood of MDS patients at a 2:1 ratio in the presence of IL-15 (10 ng/ml) for 5 days. Following 6 hours stimulation with anti-CD16, degranulation and IFN-γ production was evaluated in conventional and adaptive NK cells by flow cytometry. F) Purified NK cells (n=5) from healthy blood donors were co-cultured with allogeneic MDSCs enriched from the blood of MDS patients at a 2:1 ratio in the presence of IL-15 (10 ng/ml), IgG control (10 ug/ml) and in the presence or absence of anti-TIGIT (10 ug/ml) for 5 days. 6 hours prior staining, cells were stimulated with anti-CD16 and degranulation and IFN-γ production was evaluated in conventional and adaptive NK cells by flow cytometry. Representative data are shown as mean ± SD, and statistical analysis were done on pooled data using the Student’s t test for (A), (C), (D), and Mann-Whitney test for (E) and (F).

References

    1. Kiessling R, Klein E, Pross H, Wigzell H. “Natural” killer cells in the mouse. II. Cytotoxic cells with specificity for mouse Moloney leukemia cells. Characteristics of the killer cell. European journal of immunology. 1975;5(2):117–21. - PubMed
    1. Herberman RB, Nunn ME, Lavrin DH. Natural cytotoxic reactivity of mouse lymphoid cells against syngeneic acid allogeneic tumors. I. Distribution of reactivity and specificity International journal of cancer. Journal international du cancer. 1975;16(2):216–29. - PubMed
    1. Narni-Mancinelli E, Vivier E, Kerdiles YM. The ‘T-cell-ness’ of NK cells: unexpected similarities between NK cells and T cells. International immunology. 2011;23(7):427–31. - PubMed
    1. Vivier E, Anfossi N. Inhibitory NK-cell receptors on T cells: witness of the past, actors of the future. Nature reviews Immunology. 2004;4(3):190–8. - PubMed
    1. Long EO, Kim HS, Liu D, Peterson ME, Rajagopalan S. Controlling natural killer cell responses: integration of signals for activation and inhibition. Annual review of immunology. 2013;31:227–58. - PMC - PubMed

Publication types

MeSH terms