. 2016 Jul 25:7:1063.
doi: 10.3389/fpls.2016.01063. eCollection 2016.

Water Deficit Affects Primary Metabolism Differently in Two Lolium multiflorum/Festuca arundinacea Introgression Forms with a Distinct Capacity for Photosynthesis and Membrane Regeneration

Affiliations

Water Deficit Affects Primary Metabolism Differently in Two Lolium multiflorum/Festuca arundinacea Introgression Forms with a Distinct Capacity for Photosynthesis and Membrane Regeneration

Dawid Perlikowski et al. Front Plant Sci. .

Abstract

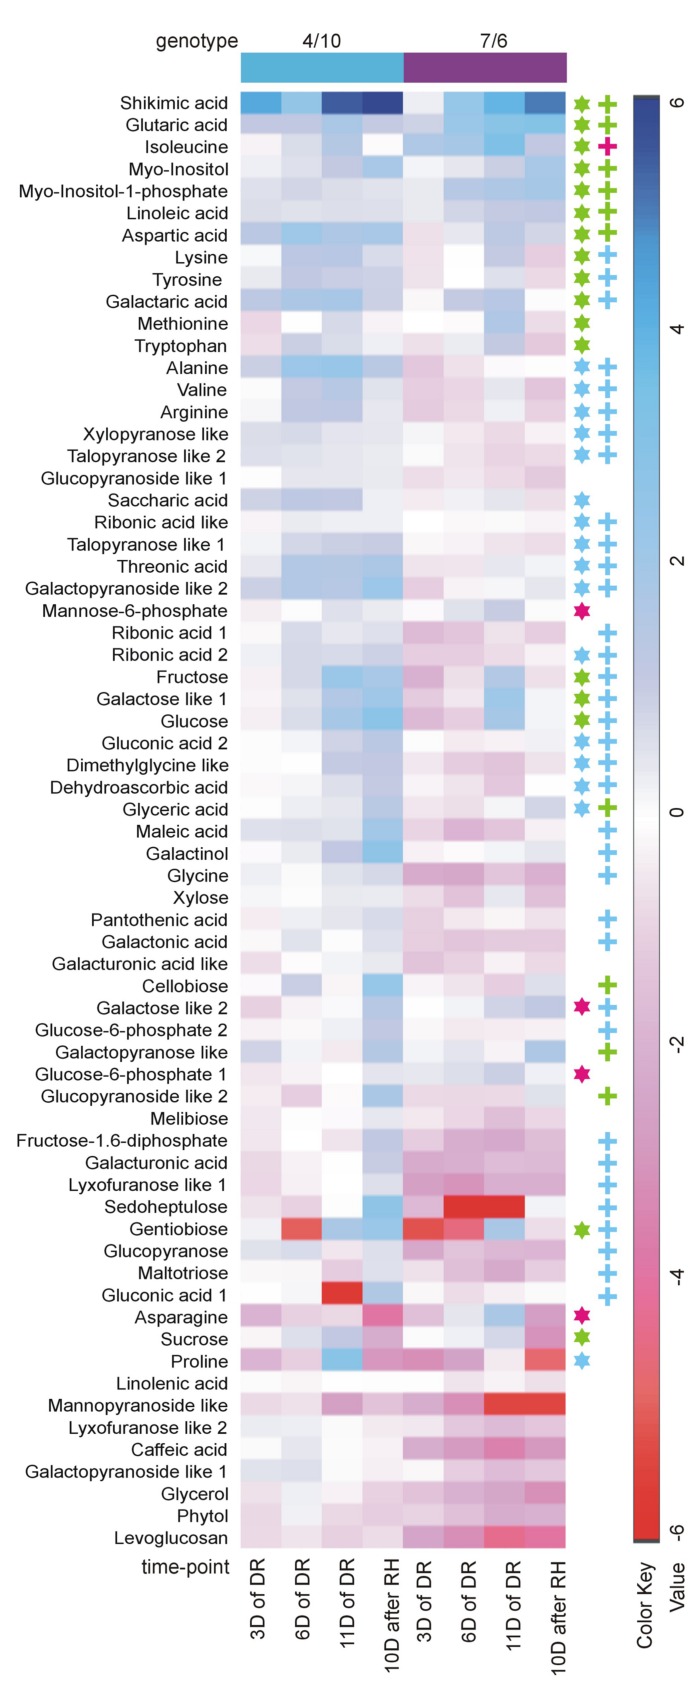
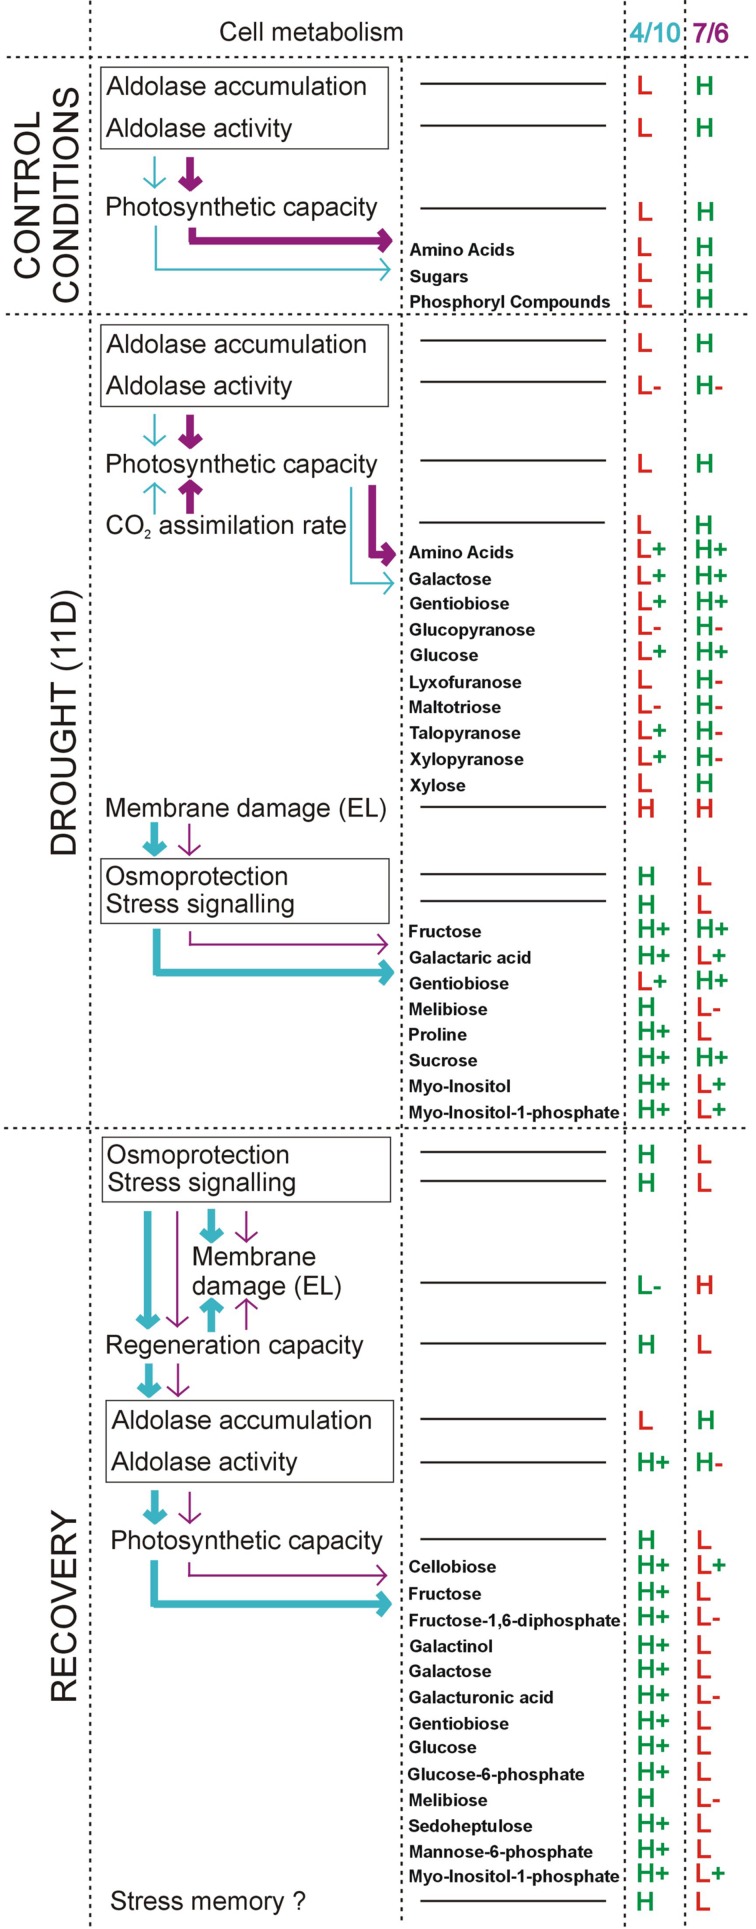
Understanding how plants respond to drought at different levels of cell metabolism is an important aspect of research on the mechanisms involved in stress tolerance. Furthermore, a dissection of drought tolerance into its crucial components by the use of plant introgression forms facilitates to analyze this trait more deeply. The important components of plant drought tolerance are the capacity for photosynthesis under drought conditions, and the ability of cellular membrane regeneration after stress cessation. Two closely related introgression forms of Lolium multiflorum/Festuca arundinacea, differing in the level of photosynthetic capacity during stress, and in the ability to regenerate their cellular membranes after stress cessation, were used as forage grass models in a primary metabolome profiling and in an evaluation of chloroplast 1,6-bisphosphate aldolase accumulation level and activity, during 11 days of water deficit, followed by 10 days of rehydration. It was revealed here that the introgression form, characterized by the ability to regenerate membranes after rehydration, contained higher amounts of proline, melibiose, galactaric acid, myo-inositol and myo-inositol-1-phosphate involved in osmoprotection and stress signaling under drought. Moreover, during the rehydration period, this form also maintained elevated accumulation levels of most the primary metabolites, analyzed here. The other introgression form, characterized by the higher capacity for photosynthesis, revealed a higher accumulation level and activity of chloroplast aldolase under drought conditions, and higher accumulation levels of most photosynthetic products during control and drought periods. The potential impact of the observed metabolic alterations on cellular membrane recovery after stress cessation, and on a photosynthetic capacity under drought conditions in grasses, are discussed.

Keywords: chloroplast aldolase; drought; forage grasses; membrane regeneration; photosynthetic activity; primary metabolites.


Figures

FIGURE 1
FIGURE 1
The activity and accumulation levels of chloroplast fructose bisphosphate aldolase (pFBA) at five time-points: before drought, after 3, 6 and 11 days of drought (DR), and 10 days of re-watering (RH) in Lolium multiflorum/Festuca arundinacea introgression forms. The bars represent a calculated mean value of enzyme activity expressed in μg glyceraldehyde produced by pFBA during 1 h of incubation at 30°C (A) and a mean of pFBA bands intensities values (B). Error bars represent standard deviations. The letters indicate groups of means that do not differ significantly at a significance level of 0.01 (Fisher’s LSD-test).
FIGURE 2
FIGURE 2
The accumulation levels of analyzed metabolites at five time-points: before drought, after 3, 6, and 11 days of DR, and 10 days of RH in L. multiflorum/F. arundinacea introgression forms. The bars represent a mean value (over replications) for Log2 transformed mass spectra peak intensities. Error bars represent none weighted standard errors. The letters indicate groups of means that do not differ significantly at a significance level of 0.01 (Fisher’s LSD-test).
FIGURE 3
FIGURE 3
The overall statistical comparison of differences in accumulation levels of the analyzed metabolites at five time-points: before drought, after 3, 6, and 11 days of DR, and 10 days of RH in L. multiflorum/F. arundinacea introgression forms. (A) Numbers of metabolites with a significantly higher accumulation level between the analyzed forms at the particular time-points. (B) Numbers of metabolites with a significant increase or decrease in an accumulation level between time-points in the 7/6 form. (C) Numbers of metabolites with a significant increase or decrease in an accumulation level between time-points in the 4/10 form.
FIGURE 4
FIGURE 4
The accumulation levels of the analyzed metabolites (relative to control values, calculated for mean Log2 transformed mass spectral peak intensities) at four time-points of the experiment: after 3, 6, and 11 days (D) of DR, and after 10 days of RH in the 4/10 and 7/6 L. multiflorum/F. arundinacea introgression forms. The values lower than the control are shown in shades of red, and the values higher than the control are shown in shades of blue. The asterisks indicate metabolites with a significant increase of an accumulation level after 11 days of drought: blue in the 4/10 form, magenta in the 7/6 form and green in both introgression forms. The crosses indicate metabolites with a significantly higher accumulation level after 10 days of re-watering: blue in the 4/10 form, magenta in the 7/6 form and green in both introgression forms.
FIGURE 5
FIGURE 5
The PCA of the analyzed metabolites accumulation level using the first two principal components with the highest variance. Close circles represent the 7/6 L. multiflorum/F. arundinacea introgression form, open circles – the 4/10 form. The time points are labeled, as follows: C, control; 3, the 3rd day of drought; 6, the 6th day of drought; 11, the 11th day of drought; RH, 10 days after re-hydration. Blue lines represent carbohydrate metabolites, green – amino acids, purple - other metabolites. Dotted line circles represent correlation groups (G1-6).
FIGURE 6
FIGURE 6
A model figure showing the most important conclusions of the present study. This model involves the results regarding chloroplast aldolase (pFBA) activity and specific metabolites’ accumulation levels under drought and recovery conditions in the 7/6 and 4/10 L. multiflorum/F. arundinacea introgression forms. In velvet – characteristics for the 7/6 form and in blue – for the 4/10 form, are presented. The intensity of the arrows shows quantitative differences in the indicated physiological/metabolic process between the analyzed introgression forms. Abbreviations: D, day; EL, electrolyte leakage; H, higher level, compared to the other introgression form; L, lower level, compared to the other introgression form; (+), increased level, compared to the control conditions; (-), decreased level, compared to the control conditions.

References

    1. Abernethy G. A., McManus M. T. (1998). Biochemical responses to an imposed water deficit in mature leaf tissue of Festuca arundinacea. Environ. Exper. Bot. 40 17–28. 10.1016/S0098-8472(98)00017-3 - DOI
    1. Ambavaram M. M., Basu S., Krishnan A., Ramegowda V., Batlang U., Rahman L., et al. (2014). Coordinated regulation of photosynthesis in rice increases yield and tolerance to environmental stress. Nat. Commun. 5:5302 10.1038/ncomms6302 - DOI - PMC - PubMed
    1. Amiard V., Morvan-Bertrand A., Billard J. P., Huault C., Keller F., Prud’homme M. P. (2003). Fructans, but not the sucrosyl-galactosides, raffinose and loliose, are affected by drought stress in perennial ryegrass. Plant Physiol. 132 2218–2229. 10.1104/pp.103.022335 - DOI - PMC - PubMed
    1. Ap Rees T. (1995). “What next?” in Sucrose Metabolism, Biochemistry, Physiology and Molecular Biology, eds Salerno G. L., Echeverria E. J. (Rockville, MD: American Society of Plant Physiologists; ), 278–283.
    1. Bandurska H. (2001). Does proline accumulated in leaves of water deficit stressed barley plants confine cell membrane injuries? II. Proline accumulation during hardening and its involvement in reducing membrane injuries in leaves subjected to severe osmotic stress. Acta Physiol. Plant. 23 483–490. 10.1007/s11738-001-0059-0 - DOI

LinkOut - more resources