. 2016 Aug 9:5:e16161.
doi: 10.7554/eLife.16161.

A shared numerical representation for action and perception

Affiliations

A shared numerical representation for action and perception

Giovanni Anobile et al. Elife. .

Abstract

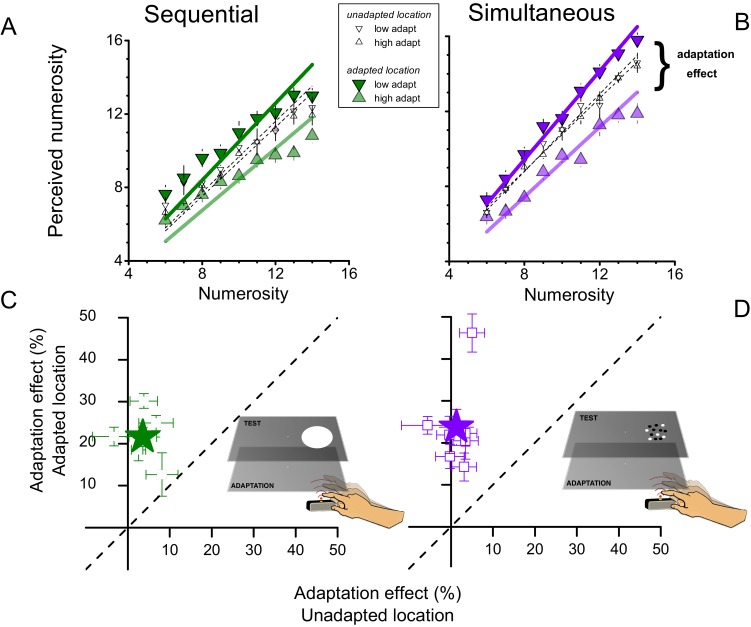
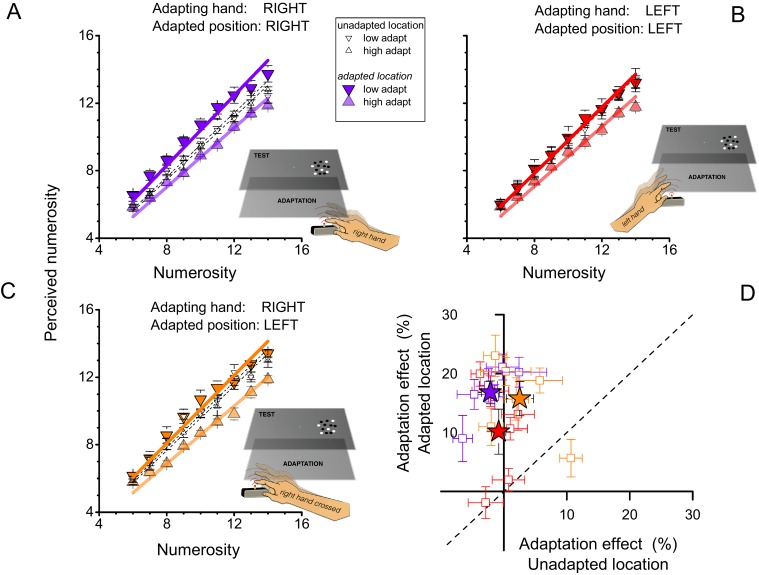
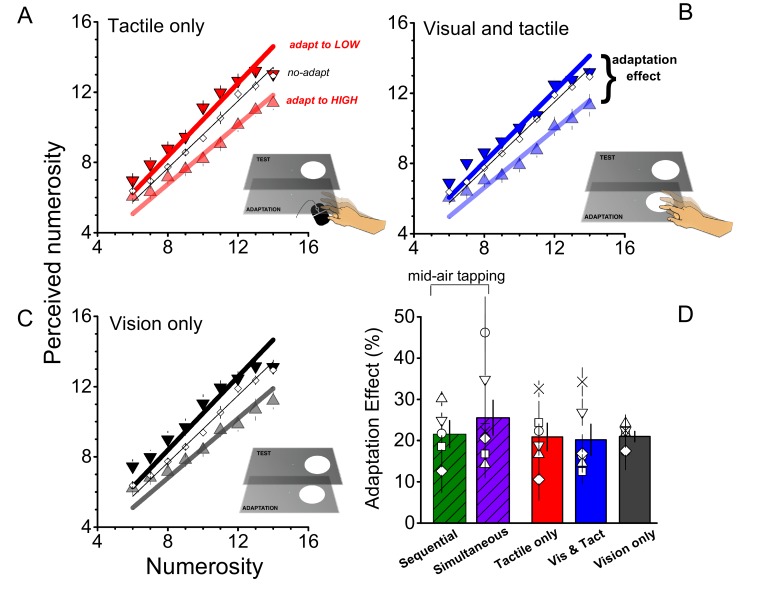
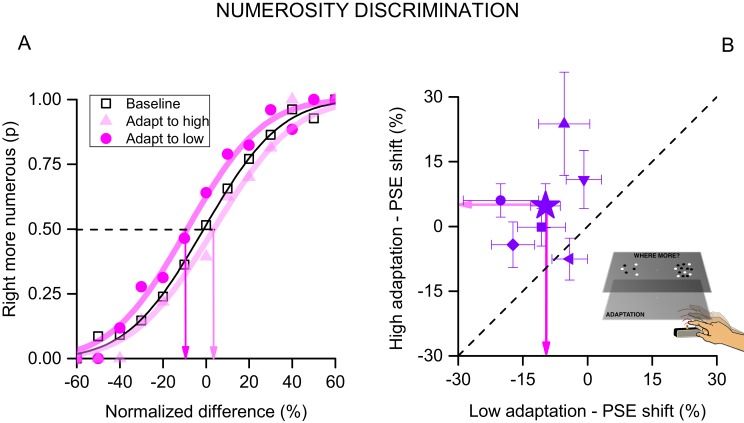
Humans and other species have perceptual mechanisms dedicated to estimating approximate quantity: a sense of number. Here we show a clear interaction between self-produced actions and the perceived numerosity of subsequent visual stimuli. A short period of rapid finger-tapping (without sensory feedback) caused subjects to underestimate the number of visual stimuli presented near the tapping region; and a period of slow tapping caused overestimation. The distortions occurred both for stimuli presented sequentially (series of flashes) and simultaneously (clouds of dots); both for magnitude estimation and forced-choice comparison. The adaptation was spatially selective, primarily in external, real-world coordinates. Our results sit well with studies reporting links between perception and action, showing that vision and action share mechanisms that encode numbers: a generalized number sense, which estimates the number of self-generated as well as external events.

Keywords: approximate number system; cross modal adaptation; cross modal perception; human; neuroscience; numerosity adaptation; numerosity perception.


Conflict of interest statement

The authors declare that no competing interests exist.

Figures

Figure 1.
Figure 1.. Effects of motor adaptation on perceived numerosity.
(A and B) Average perceived numerosity as a function of physical numerosity for slow tapping (downward triangles) and fast tapping (upward triangles), for sequential (left) and simultaneous (right) formats. Filled symbols indicate the conditions in which stimuli were spatially congruent with the tapping region, small open symbols to estimates obtained for the unadapted location (left-hand side). (C and D). Adaptation magnitudes for individual subjects when test and tapping were spatially congruent, plotted against the spatially incongruent condition. Stars reports averages, squares single subject data. Error bars refer to ± 1 SEM. DOI: http://dx.doi.org/10.7554/eLife.16161.003
Figure 2.
Figure 2.. Reference frame of motor adaptation.
(A) Average perceived numerosity as a function of physical numerosity for the slow-and fast-tapping conditions (downward and upward triangles respectively), for right-hand tapping. Filled symbols refer to trials when the stimuli were presented in the spatial region where the subjects had tapped (right side) small open symbols to trials when the stimuli were presented on the other side. This data replicates Figure 1B with a fresh subject pool. (B) Same as A, except subjects tapped with their left hands. Filled symbols refer to testing in the same spatial region where the subjects had tapped (left side), small open symbols to the right side. Other conventions like A. (C) Same as A, except the right hand tapped on the left side of the screen. Filled symbols refer to testing on the same spatial region where the subjects had tapped (left side), small open symbols to the right side. (D) Adaptation magnitudes for individual subjects when test and tapping were spatially congruent, plotted against the spatially incongruent condition. Color-coding as for A, B and C (purple: right hand, right side; red: left hand, left side; orange: right hand, left side). Stars reports averages, squares single subject data. Error bars refer to ± 1 SEM. DOI: http://dx.doi.org/10.7554/eLife.16161.004
Figure 3.
Figure 3.. Role of sensory feedback of motor adaptation on perceived numerosity.
(A), (B), (C) Average responses as a function of physical numerosity for slow adaptation (downward triangles), fast adaptation (upward triangles) and no adaptation (diamonds), for the three different conditions. (D) Bar graphs report the average adaptation effect for all adapting conditions (tactile only - red; visual and tactile - blue, visual only – black and the 2 conditions of Exp 1: sequential-green and simultaneous-violet). Open symbols show single subject data. Error bars report ± 1 SEM. All the conditions provided significant effects (all p-values < 0.05). The magnitude of the effect does not differ between conditions (p > 0.05). DOI: http://dx.doi.org/10.7554/eLife.16161.005
Figure 4.
Figure 4.. Forced-choice measurement of motor adaptation.
(A) Psychophysical functions for pooled data (6 subjects) after adaptation to fast (light violet circles), slow (dark violet triangles) or no (black squares) tapping. The curves indicate the proportion of trials when the test (presented on the right, the same side of tapping) was seen as more numerous than the unadapted stimulus (presented on the left), as a function of the numerosity difference (normalized by the averaged of the two stimuli). Adaptation to slow tapping shifted the curve leftwards, showing that subjects were biased to perceive the stimulus as more numerous that it was; and adaptation to fast tapping shifted it rightwards. The point where the best-fitting curves pass 50% is considered the point of subjective equality (PSE, indicated by the coloured arrows). (B) PSEs for individual subjects after adaptation to fast tapping (ordinate) against those after adaptation to low motor repetitions (abscissa). The filled star shows results for data averaged across subjects. Error bars report ± 1 SEM. DOI: http://dx.doi.org/10.7554/eLife.16161.006
Figure 5.
Figure 5.. Tapping rates for high and low adaptation.
Tapping rates (open symbols for single subject data; filled symbols for averages) for two different adaptation conditions: fast adaptation (ordinate) and slow adaptation (abscissa) for seven different experimental conditions. Black and red refers the two conditions in which subjects tapped in mid-air and then estimated numerosity of either sequential or simultaneous visual stimuli respectively. Gray, orange and violet refer to the three different versions of the simultaneous conditions devised to investigate the reference frame of adaptation: gray - subjects tapping with the right hand on the right side, orange - left hand on the left side and purple -right-hand on the left side. The adapting conditions in which subjects tapped on a surface (receiving tactile feedback) are indicated by green and blue symbols: green refers to the ‘visual and tactile’ condition in which participants tapped on touch-screen surface and were provided with visual feedback of their moving hand (visible) as well as by flashes on the monitor signaling the contact between the finger and the touch screen. Data in blue refer to the ‘tactile only’ condition in which subjects tapped on the mouse button placed beyond the screen (moving hand not visible). DOI: http://dx.doi.org/10.7554/eLife.16161.007

References

    1. Anobile G, Arrighi R, Togoli I, Burr D. 2016. A shared numerical representation for action and perception. Figshare. 3406066 - PMC - PubMed
    1. Anobile G, Cicchini GM, Burr DC. Separate mechanisms for perception of numerosity and density. Psychological Science. 2014;25:265–270. doi: 10.1177/0956797613501520. - DOI - PubMed
    1. Anobile G, Cicchini GM, Burr DC. Number as a primary perceptual attribute: A review. Perception. 2016;45:5–31. doi: 10.1177/0301006615602599. - DOI - PMC - PubMed
    1. Anobile G, Turi M, Cicchini GM, Burr DC. Mechanisms for perception of numerosity or texture-density are governed by crowding-like effects. Journal of Vision. 2015;15:e16161. doi: 10.1167/15.5.4. - DOI - PMC - PubMed
    1. Arrighi R, Cartocci G, Burr D. Reduced perceptual sensitivity for biological motion in paraplegia patients. Current Biology. 2011;21:R910–911. doi: 10.1016/j.cub.2011.09.048. - DOI - PubMed

Publication types

LinkOut - more resources