. 2016 Aug 9;12(8):e1005822.
doi: 10.1371/journal.ppat.1005822. eCollection 2016 Aug.

Polarized Cell Division of Chlamydia trachomatis

Affiliations

Polarized Cell Division of Chlamydia trachomatis

Yasser Abdelrahman et al. PLoS Pathog. .

Erratum in

Abstract

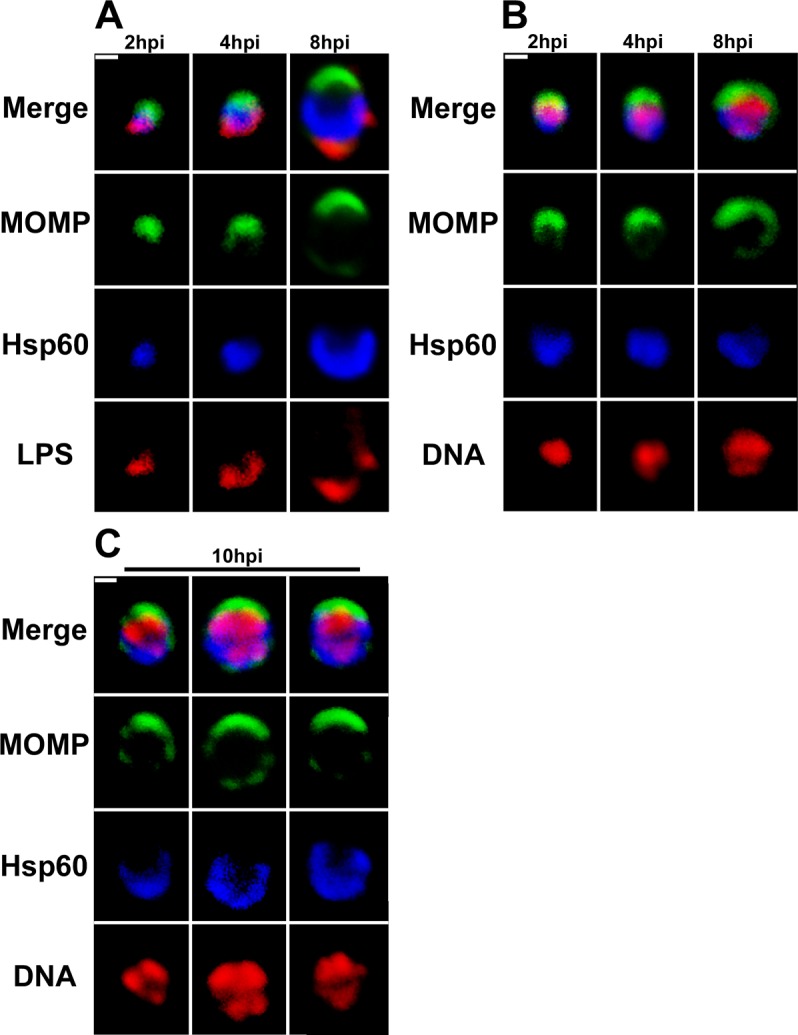
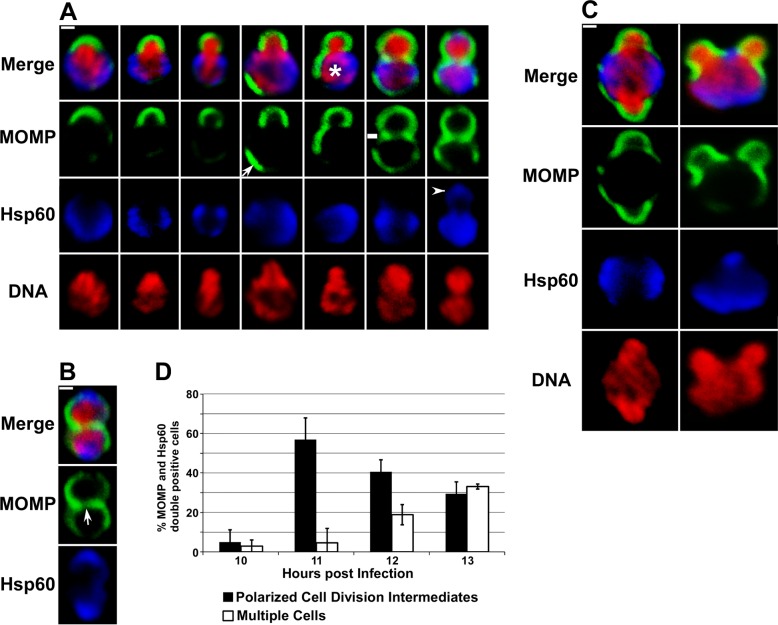
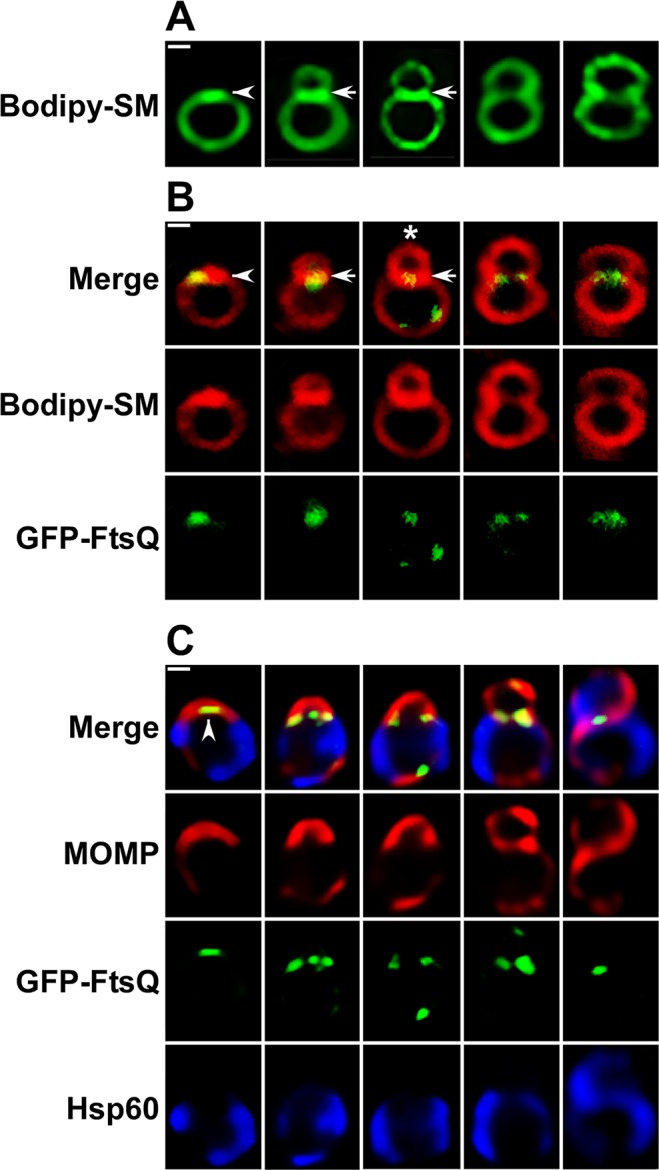
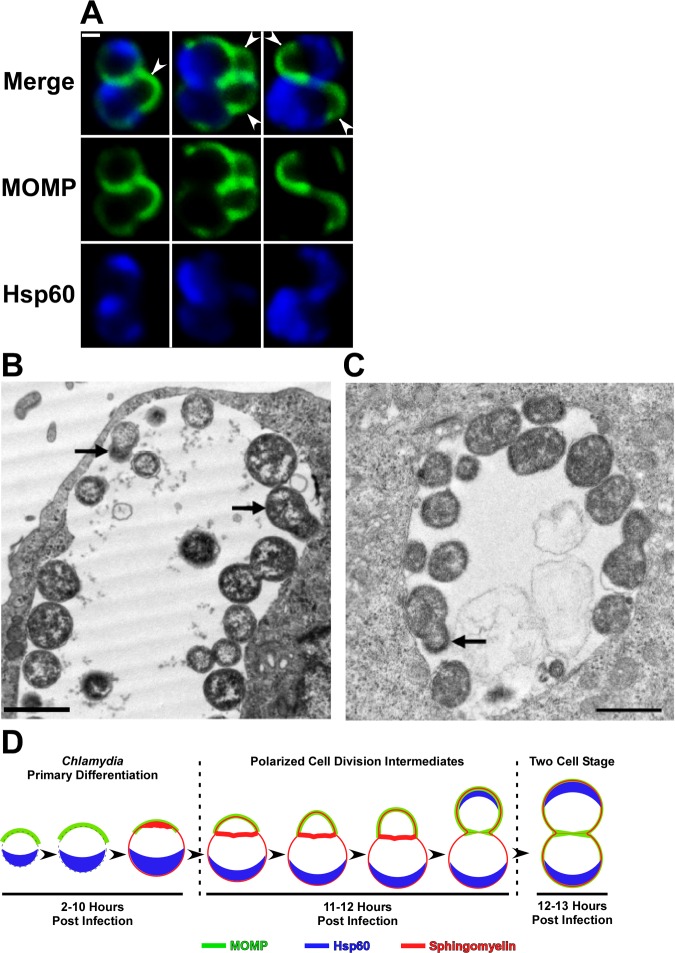
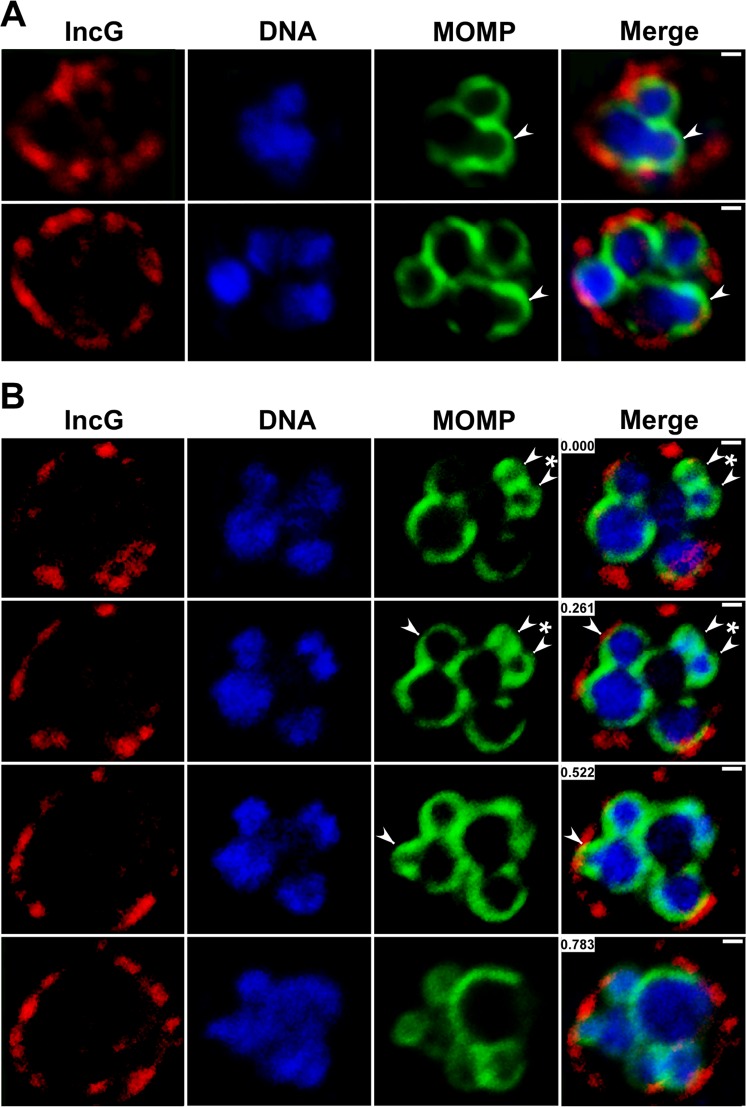
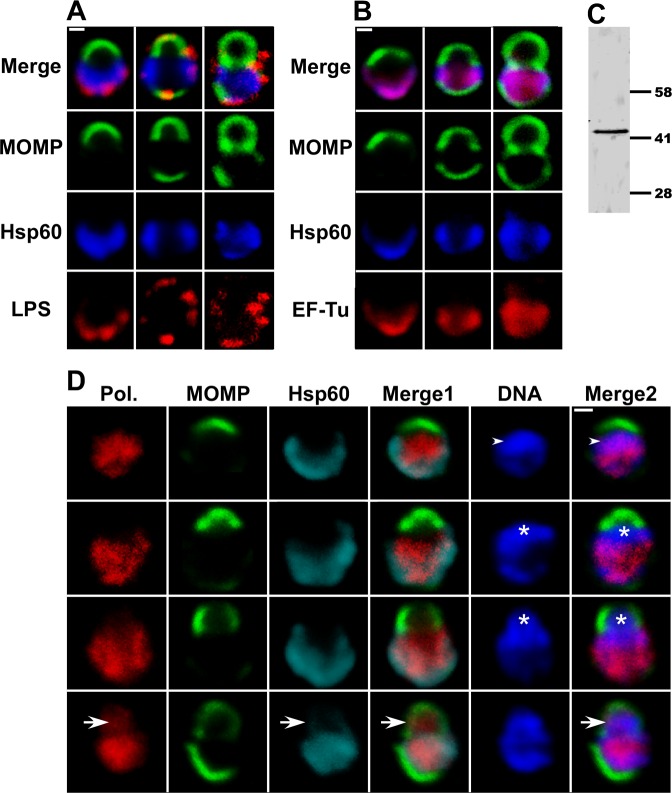
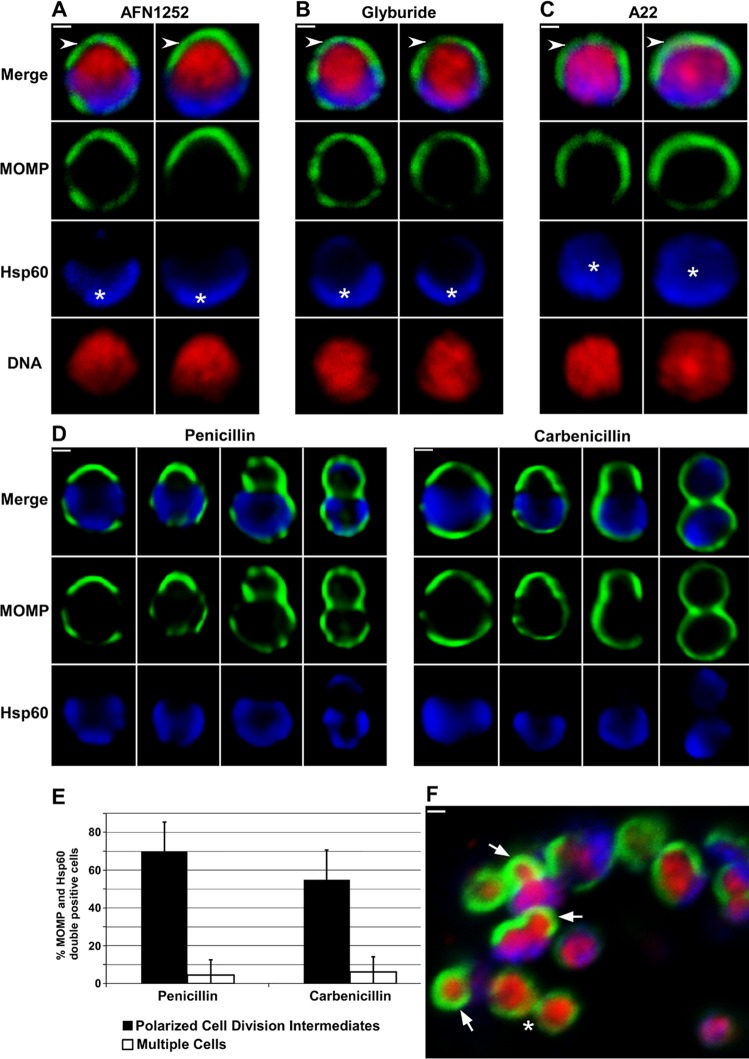
Bacterial cell division predominantly occurs by a highly conserved process, termed binary fission, that requires the bacterial homologue of tubulin, FtsZ. Other mechanisms of bacterial cell division that are independent of FtsZ are rare. Although the obligate intracellular human pathogen Chlamydia trachomatis, the leading bacterial cause of sexually transmitted infections and trachoma, lacks FtsZ, it has been assumed to divide by binary fission. We show here that Chlamydia divides by a polarized cell division process similar to the budding process of a subset of the Planctomycetes that also lack FtsZ. Prior to cell division, the major outer-membrane protein of Chlamydia is restricted to one pole of the cell, and the nascent daughter cell emerges from this pole by an asymmetric expansion of the membrane. Components of the chlamydial cell division machinery accumulate at the site of polar growth prior to the initiation of asymmetric membrane expansion and inhibitors that disrupt the polarity of C. trachomatis prevent cell division. The polarized cell division of C. trachomatis is the result of the unipolar growth and FtsZ-independent fission of this coccoid organism. This mechanism of cell division has not been documented in other human bacterial pathogens suggesting the potential for developing Chlamydia-specific therapeutic treatments.


Conflict of interest statement

The authors have declared that no competing interests exist.

Figures

Fig 1
Fig 1. Outer membrane and cytosolic markers are polarized in C. trachomatis serovar L2.
HeLa cells infected with C. trachomatis were fixed at 2, 4, 8 (A and B), or 10 (C) hours post-infection (hpi). Following fixation, the cells were permeabilized and LPS localization was determined by incubating cells with anti-LPS mouse monoclonal antibodies followed by donkey anti-mouse IgG conjugated to Alexa Fluor 568 (A; red), Hsp60 localization was determined using anti-Hsp60 rabbit polyclonal antibodies followed by donkey anti-rabbit IgG conjugated to Alexa Fluor 633 (A, B, and C; blue), and MOMP localization was determined using anti-MOMP goat polyclonal antibodies followed by donkey anti-goat IgG conjugated to Alexa Fluor 488 (A, B, and C; green). Following the antibody incubations, the cells were imaged by confocal microscopy. (B and C) DNA was visualized by staining with Hoechst 33342 (red). White bars are 0.5μ.
Fig 2
Fig 2. C. trachomatis divides by a polarized cell division process.
HeLa cells infected with C. trachomatis were fixed at 11 (A and C) or 13 (B) hours post-infection. Following permeabilization, the cells were incubated with rabbit polyclonal antibodies against Hsp60 (blue) and goat polyclonal antibodies against MOMP (green) followed by donkey anti-rabbit IgG conjugated to Alexa Fluor 568 and donkey anti-goat IgG conjugated to Alexa Fluor 488 secondary antibodies. The cells were then washed and stained with Hoechst 33342 prior to confocal analysis. Arrow in A points to a region of polarized MOMP in a mother cell. Dash in A denotes the presence of a MOMP-poor septum separating the mother and daughter cell. Arrowhead in A points to Hsp60 in the daughter cell. (B) Localization profile of MOMP, Hsp60, and DNA in a cell that has completed its first division. Arrow in B points to a MOMP-poor region in the center of the septum between the mother and daughter cell. (C) Examples of C. trachomatis at 11 hours post-infection that were simultaneously undergoing polar growth from two sites in the cell. (D) Infected HeLa cells were fixed at 10, 11, 12, or 13 hours post-infection and the percentage of C. trachomatis that were undergoing polarized cell division (black bars) or had completed the first division (white bars) were quantified. All of the MOMP and Hsp60 double-positive cells in randomly selected fields were included in the analysis. White bars are 0.5μ.
Fig 3
Fig 3. Analysis of the polarized cell division process of C. trachomatis serovar L2 in live and fixed cells.
(A) HeLa cells infected with C. trachomatis were incubated in the presence of green fluorescent BODIPY FL C5 ceramide as described in the Materials and Methods and polarized cell division intermediates were imaged in live cells at 11 hours post-infection using a Zeiss AxioImager.M2 microscope. (B) HeLa cells were infected with C. trachomatis serovar L2 that contained an anhydrotetracycline (aTc)-inducible plasmid expressing GFP-FtsQ [17]. aTc was added to infected cultures at 8 hours post-infection then the cells were labeled with red fluorescent BODIPY TR C5 ceramide. Polarized cell division intermediates were imaged in live cells at 11 hours post-infection using a Zeiss LSM710 confocal microscope. Arrowheads in A and B indicate regions of intense BODIPY-sphingomyelin fluorescence at one pole of a round cell prior to division. The polar patch of sphingomyelin fluorescence in B also contained GFP-FtsQ. Arrows in A and B indicate a sphingomyelin-rich membrane separating a nascent daughter cell from a mother cell. (C) HeLa cells were infected with C. trachomatis serovar L2 that contained aTc-inducible version of GFP-FtsQ. The fusion was induced by the addition of aTc to cultures at 8 hours post-infection and the cells were fixed at 11 hours post-infection. Following permeabilization, the cells were incubated with rabbit polyclonal antibodies against Hsp60 (blue), goat polyclonal antibodies against MOMP (red), and mouse monoclonal antibodies against GFP (green) followed by donkey anti-rabbit IgG conjugated to Alexa Fluor 633, donkey anti-goat IgG conjugated to Alexa Fluor 594, and donkey anti-mouse IgG conjugated to Alexa Fluor 488 secondary antibodies. The cells were then washed prior to imaging on a Zeiss AxioImager.M2 microscope. Note the size and morphology of (B) live and (C) fixed cells are very similar. Arrowhead in C indicates a region of GFP-FtsQ fluorescence in the MOMP-positive pole of the cell prior to cell division.
Fig 4
Fig 4. Confocal and EM analysis of the polarized cell division process of C. trachomatis serovar L2.
(A) HeLa cells were infected with C. trachomatis and fixed at 13 hours post-infection. Following permeabilization, the cells were incubated with rabbit polyclonal antibodies against Hsp60 (blue) and goat polyclonal antibodies against MOMP (green) followed by goat anti-rabbit IgG conjugated to Alexa Fluor 633 and donkey anti-goat IgG conjugated to Alexa Fluor 488 secondary antibodies. The cells were then washed prior to confocal analysis. Arrowheads in A point to sites of polarized growth in cells undergoing the second round of division. (B and C) Alternatively, cells were fixed at 17 hours post-infection and processed for transmission electron microscopy. Black arrows in B and C point to cells undergoing polarized cell division. (D) Model depicting the morphological changes that occur during the primary differentiation and the initial cell division of C. trachomatis are illustrated. The localization of MOMP (green), Hsp60 (blue), and sphingomyelin (red) is shown. The distribution of sphingomyelin has not been determined in the two earliest intermediates in this model (left hand side of D). The chlamydial membrane is depicted by a dashed line in these intermediates. White bar in A is 0.5μ. The black bars in B and C are 1μ.
Fig 5
Fig 5. Characterization of the polarized division process of Chlamydia in more mature inclusions.
HeLa cells were infected with C. trachomatis and fixed at 14 hours post-infection. The cells were then permeabilized and incubated with anti-MOMP goat polyclonal antibodies (green) and anti-IncG rabbit polyclonal antibodies (red) followed by donkey anti-goat IgG conjugated to Alexa Fluor 488 and donkey anti-rabbit IgG conjugated to Alexa Fluor 568 secondary antibodies (A and B). The cells were then washed and stained with Hoechst 33342 (blue) prior to confocal analysis. The images in B are consecutive confocal slices from a z-stack. Arrowheads in A and B point to sites of asymmetric membrane expansion. Asterisk in B indicates a cell simultaneously undergoing polar growth from two sites. The white bars are 0.5μ. The numbers in the merged images in B correspond to the position in the Z-stack in microns.
Fig 6
Fig 6. Localization of cytosolic and membrane markers during the polarized cell division process of C. trachomatis.
(A, B, and D) HeLa cells were infected with C. trachomatis serovar L2 and fixed at 11 hours post-infection. The cells were then permeabilized and LPS localization was determined by incubating cells with anti-LPS mouse monoclonal antibodies (A; red), RNA polymerase β subunit localization was determined using mouse monoclonal antibodies (Pol. in D; red), EF-Tu localization was determined using anti-EF-Tu mouse polyclonal antibodies (B; red). The distribution of the mouse primary antibodies was visualized by incubating cells with donkey anti-mouse IgG conjugated to Alexa Fluor 568. Hsp60 localization was visualized using anti-Hsp60 rabbit polyclonal antibodies followed by donkey anti-rabbit IgG conjugated to Alexa Fluor 633 (A and B—blue; D—cyan) and MOMP localization was visualized using anti-MOMP goat polyclonal antibodies followed by donkey anti-goat IgG conjugated to Alexa Fluor 488 (A, B, and D; green). In some instances, the cells were stained with Hoechst (D; blue) prior to confocal analysis. Each panel contains various intermediates in the polarized cell division process. Arrowheads in D denote regions in a nascent daughter cell where the DNA and the RNA polymerase β subunit co-localize. Asterisks in D mark nascent daughter cells that contain DNA but lack the RNA polymerase β subunit and Hsp60. Arrows in D point to region where the RNA polymerase β subunit and the bacterial chromosome co-localize in a nascent daughter cell that does not yet contain Hsp60. In Panel D, Merge1: merge of MOMP/ RNA polymerase β subunit/Hsp60; Merge2: merge of MOMP/ RNA polymerase β subunit/DNA. White bars in A, B, and D are 0.5μ. (C) A lysate prepared from HeLa cells infected with C. trachomatis at 24 hours post-infection was subjected to immunoblotting analysis with the EF-Tu antibodies. A single 43kDa species that matches the predicted molecular mass of EF-Tu was observed.
Fig 7
Fig 7. Inhibitors of membrane biosynthesis, peptidoglycan biosynthesis, and MreB prevent the polarized cell division of Chlamydia.
HeLa cells were infected with C. trachomatis serovar L2. At 11 hours post-infection, AFN1252 (A), glyburide (B), or A22 (C) was added to the cells and the cells were subsequently fixed at 16 hours post-infection. (D) Penicillin or carbenicillin was added to infected HeLa cells at 10 hours post-infection and the cells were fixed at 12 hours post-infection, or (F) carbenicillin was added to infected HeLa cells at 18 hours post-infection and the cells were fixed 40 minutes later. In each instance, the cells were permeabilized and incubated with rabbit antibodies against Hsp60 (blue) and goat antibodies against MOMP (green) followed by donkey anti rabbit IgG conjugated to Alexa Fluor 633 and donkey anti-goat IgG conjugated to Alexa Fluor 488. In some instances, the cells were stained with Hoechst 33342 (red) prior to microscopic analysis (A—C and F). Two cells illustrating the effect of AFN1252 (A), glyburide (B) and A22 (C) on the polarized cell division process are shown. The cells in A—C are representative of 100 cells that were analyzed from two independent experiments. Panel D illustrates the various intermediates in polarized cell division observed in penicillin-treated or carbenicillin-treated cells. Asterisks indicate polar (A and B) and diffuse (C) Hsp60. Arrows in F point to polarized cell division intermediates observed following carbenicillin treatment of a more mature inclusion containing multiple cells. The asterisk in F indicates a cell that has almost completed division. Images in A-C and F were acquired by confocal microscopy; images in D were acquired by epifluorescent microscopy. White bars are 0.5μ. (E) Penicillin or carbenicillin were added to infected HeLa cells at 10 hours post-infection and the cells were fixed at 12 hours post-infection. The percentage of C. trachomatis that were undergoing polarized cell division (black bars) or had completed the first division (white bars) were quantified. All of the MOMP and Hsp60 double-positive cells in randomly selected fields were included in the analysis. The data shown represents the analysis of more than 200 cells from two independent experiments.

Comment in

References

    1. Wagner M, Horn M (2006) The Planctomycetes, Verrucomicrobia, Chlamydiae and sister phyla comprise a superphylum with biotechnological and medical relevance. Curr Opin Biotechnol 17: 241–249. - PubMed
    1. Bernander R, Ettema TJ (2010) FtsZ-less cell division in archaea and bacteria. Curr Opin Microbiol 13: 747–752. 10.1016/j.mib.2010.10.005 - DOI - PubMed
    1. Abdelrahman YM, Belland RJ (2005) The chlamydial developmental cycle. FEMS Microbiol Rev 29: 949–959. - PubMed
    1. Matsumoto A, Manire GP (1970) Electron microscopic observations on the effects of penicillin on the morphology of Chlamydia psittaci. J Bacteriol 101: 278–285. - PMC - PubMed
    1. Tekniepe B, Schmidt J, Starr P (1981) Life cycle of a budding and appendaged bacterium belonging to morphotype IV of theBlastocaulis-Planctomyces group. Current Microbiology 5: 1–6.

LinkOut - more resources