. 2016 Sep;52(9):1457-69.
doi: 10.1037/dev0000188. Epub 2016 Aug 8.

Fadeout in an early mathematics intervention: Constraining content or preexisting differences?

Affiliations

Fadeout in an early mathematics intervention: Constraining content or preexisting differences?

Drew H Bailey et al. Dev Psychol. 2016 Sep.

Abstract

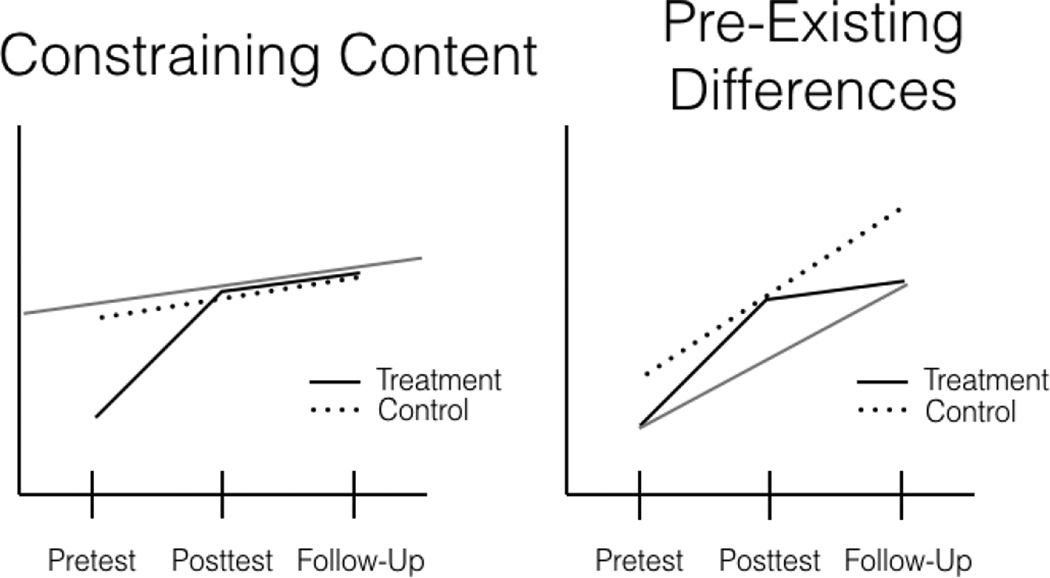
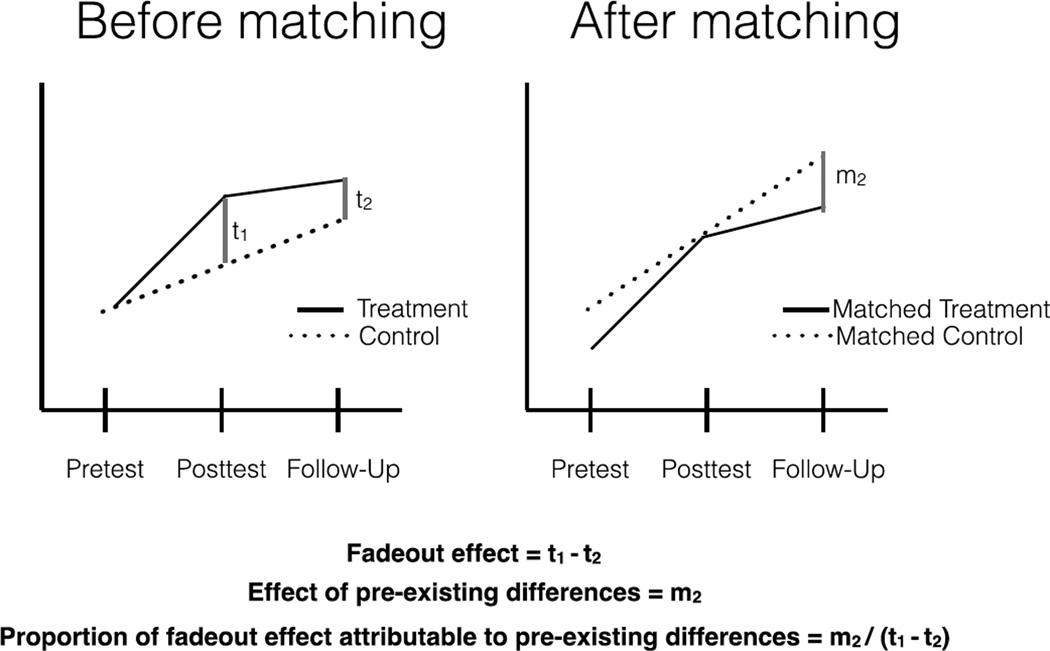
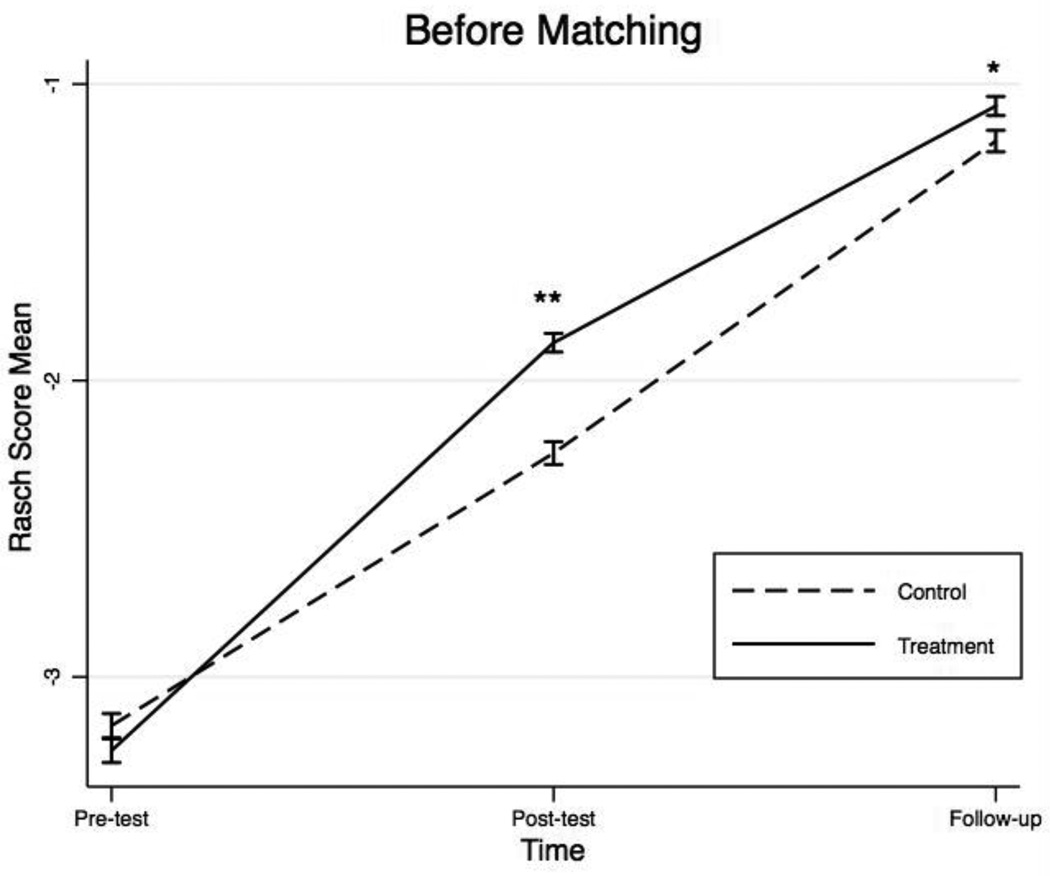
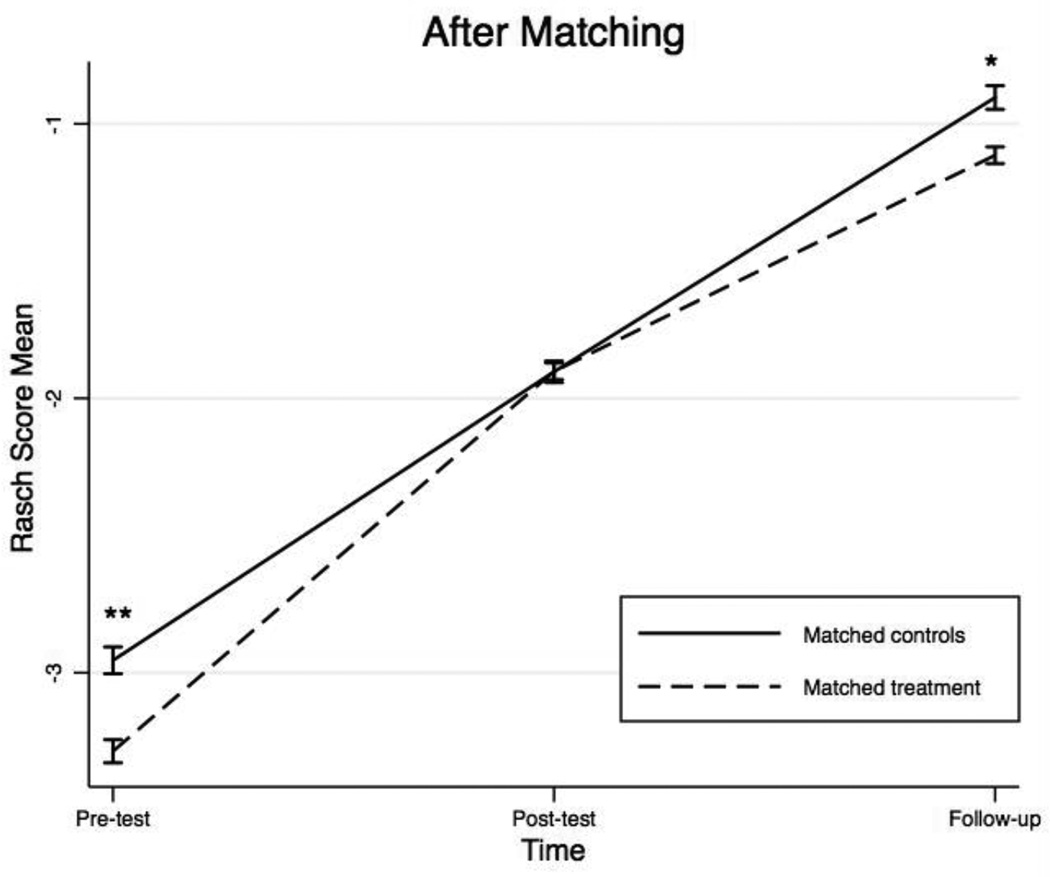
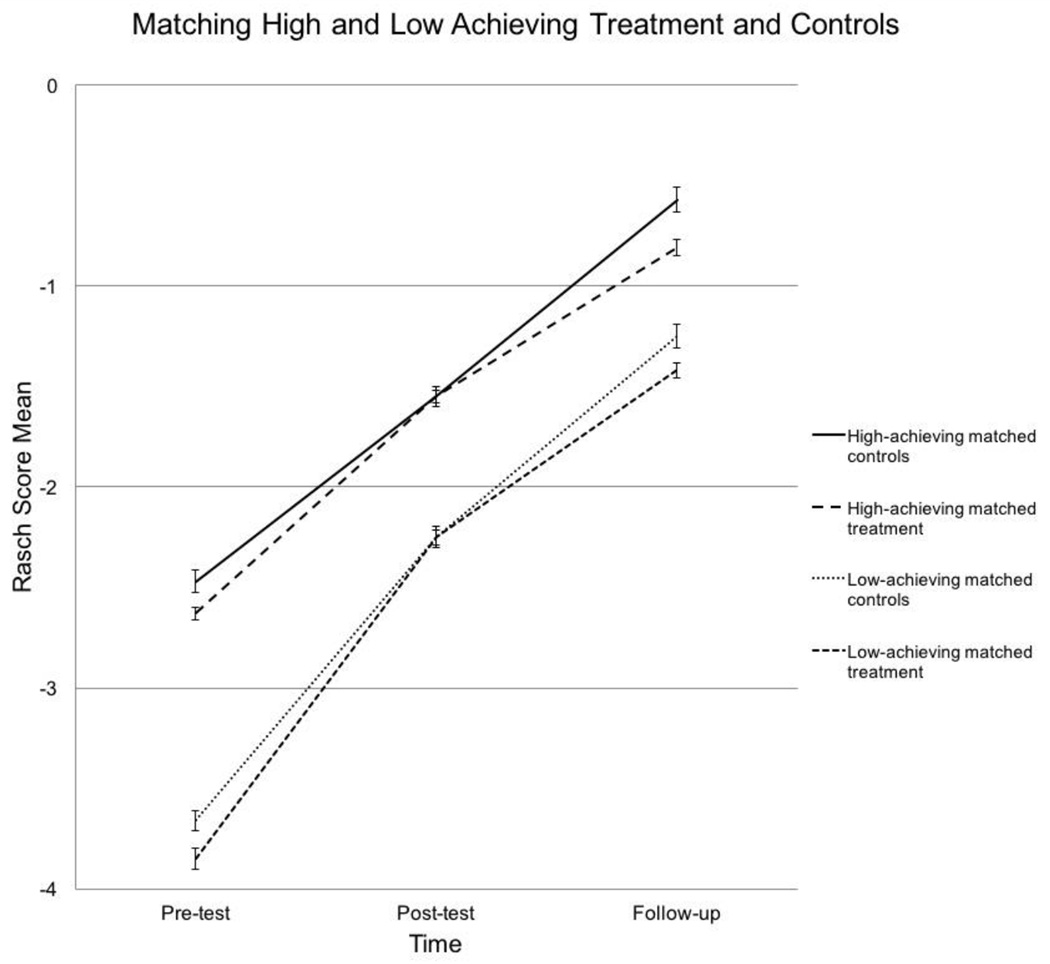
A robust finding across research on early childhood educational interventions is that the treatment effect diminishes over time, with children not receiving the intervention eventually catching up to children who did. One popular explanation for fadeout of early mathematics interventions is that elementary school teachers may not teach the kind of advanced content that children are prepared for after receiving the intervention, so lower-achieving children in the control groups of early mathematics interventions catch up to the higher-achieving children in the treatment groups. An alternative explanation is that persistent individual differences in children's long-term mathematical development result more from relatively stable preexisting differences in their skills and environments than from the direct effects of previous knowledge on later knowledge. We tested these 2 hypotheses using data from an effective preschool mathematics intervention previously known to show a diminishing treatment effect over time. We compared the intervention group to a matched subset of the control group with a similar mean and variance of scores at the end of treatment. We then tested the relative contributions of factors that similarly constrain learning in children from treatment and control groups with the same level of posttreatment achievement and preexisting differences between these 2 groups to the fadeout of the treatment effect over time. We found approximately 72% of the fadeout effect to be attributable to preexisting differences between children in treatment and control groups with the same level of achievement at posttest. These differences were fully statistically attenuated by children's prior academic achievement. (PsycINFO Database Record


Figures

Figure 1
Figure 1. Predicted Trajectories for Treatment and Higher Achieving Control Children Based on the Constraining Content and Pre-existing Differences Hypotheses
The gray line in the left panel represents an artificial ceiling imposed by the low-level content of instruction, which constrains the later trajectories of children in the treatment group, according to the constraining content hypothesis. The gray line in the right panel represents the trajectory the treatment group would have been predicted to follow, had they not received treatment, according to the pre-existing differences hypothesis. The key difference between the two hypotheses is that the pre-existing differences hypothesis predicts that the groups will differ in their trajectories following the post-test, whereas the constraining content hypothesis predicts that the groups will have similar trajectories.
Figure 2
Figure 2. Graphical Representation of Calculations of the Fadeout Effect and Effect of Pre-Existing Differences
The first graph in the left panel displays differences between the treatment and control children before they were matched. The difference between the treatment children and control children at post-test (represented by t1) is larger than the difference at follow-up (represented by t2). The fadeout effect is can be found by taking the difference between the two time points. The second graph in the right panel displays the trajectories of children’s achievement once they have been matched. Children who were matched to be in the control group outperformed children who were matched to be in the treatment group. The difference between the two groups at follow-up (represented by m2) is the effect of children’s pre-existing differences. The proportion of the fadeout effect attributable to pre-existing differences can be calculated by dividing the effect of pre-existing differences by the fadeout effect.
Figure 3
Figure 3. Observed Mathematics Achievement Trajectories of the Intervention Groups before Matching on Post-Test Mathematics Achievement
The graph above displays the mathematics achievement trajectories of the children in the treatment and control groups before they were matched. Children in the treatment group outperformed the children in the control group at post-test and follow-up. + p<.10; * p<.05; ** p<.01.
Figure 4
Figure 4. Observed Mathematics Achievement Trajectories of the Intervention Groups after Matching on Post-Test Mathematics Achievement
The graph above displays the mathematics achievement trajectories of the children in the treatment and control groups after they were matched. Children in the matched control group outperformed children who were matched in the treatment group. Groups had the same level of achievement at post-test because they were matched on scores at that time point. + p<.10; * p<.05; ** p<.01.
Figure 5
Figure 5. Observed Mathematics Achievement Trajectories of Pre-Test Split Intervention Groups after Matching on Post-Test Mathematics Achievement
The graph above displays the mathematics achievement trajectories of the children above and below the pre-test median score in the treatment and control groups after they were matched. For both achievement level subsets, children in the matched control group outperformed children who were matched in the treatment group at the follow-up. Groups within each achievement level had the same level of achievement at post-test because they were matched on scores at that time point.

References

    1. Bailey DH, Duncan G, Odgers C, Yu W. Persistence and fadeout in the impacts of child and adolescent interventions (Working Paper No. 2015–27) 2015 Retrieved from the Life Course Centre Working Paper Series Website: http://www.lifecoursecentre.org.au/working-papers/persistence-and-fadeou.... - PMC - PubMed
    1. Bailey DH, Watts TW, Littlefield AK, Geary DC. State and trait effects on individual differences in children’s mathematical development. Psychological Science. 2014;25(11):2017–2026. - PMC - PubMed
    1. Barnett WS, Brown K, Shore R. The Universal Vs. Targeted Debate: Should the United States Have Preschool for All? New Brunswick, NJ: NIEER; 2004.
    1. Blevins-Knabe B, Musun-Miller L. Number use at home by children and their parents and its relationship to early mathematical performance. Early Development and Parenting. 1996;5(1):35–45.
    1. Bodovski K, Farkas G. Do instructional practices contribute to inequality in achievement? The case of mathematics instruction in kindergarten. Journal of Early Childhood Research. 2007;5(3):301–322.